| Param | Original file | Final file |
|---|---|---|
| Filename | modeM0/AS1A07_065T01_9000003284_22195cztM0_level2.evt | modeM0/AS1A07_065T01_9000003284_22195cztM0_level2_quad_clean.evt |
| Size (bytes) | 494,850,240 | 74,871,360 |
| Size | 471.9 MB | 71.4 MB |
| Events in quadrant A | 3,447,132 | 448,572 |
| Events in quadrant B | 3,568,828 | 450,225 |
| Events in quadrant C | 3,487,074 | 432,066 |
| Events in quadrant D | 3,988,222 | 428,695 |
| Mode SS | |||
|---|---|---|---|
| Quadrant | BADHDUFLAG | Total packets | Discarded packets |
| A | 0 | 148 | 0 |
| B | 0 | 148 | 0 |
| C | 0 | 148 | 0 |
| D | 0 | 148 | 0 |
| Mode M9 | |||
|---|---|---|---|
| Quadrant | BADHDUFLAG | Total packets | Discarded packets |
| A | 0 | 3 | 0 |
| B | 0 | 3 | 0 |
| C | 0 | 3 | 0 |
| D | 0 | 3 | 0 |
| Mode M0 | |||
|---|---|---|---|
| Quadrant | BADHDUFLAG | Total packets | Discarded packets |
| A | 0 | 14885 | 1 |
| B | 0 | 15122 | 1 |
| C | 0 | 14936 | 1 |
| D | 0 | 16620 | 1 |
| Quadrant | Total seconds | Saturated seconds | Saturation percentage |
|---|---|---|---|
| A | 7288 | 89 | 1.221186% |
| B | 7289 | 97 | 1.330772% |
| C | 7289 | 137 | 1.879545% |
| D | 7289 | 147 | 2.016738% |
Noise dominated data is calculated using 1-second bins in cleaned event files. If a bin has >2000 counts, and if more than 50% of those come from <1% of pixels, then it is considered to be noise-dominated and hence unusable.
| Quadrant | # 1 sec bins | Bins with >0 counts | Bins with >2000 counts | High rate bins dominated by noise | Noise dominated (total time) | Noise dominated (detector-on time) | Marked lightcurve |
|---|---|---|---|---|---|---|---|
| A | 7633 | 7289 | 0 | 0 | 0.00% | 0.00% | 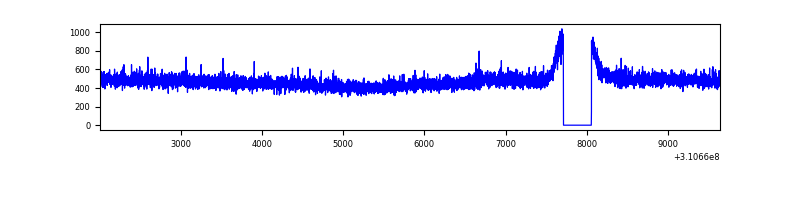 |
| B | 7634 | 7290 | 0 | 0 | 0.00% | 0.00% | 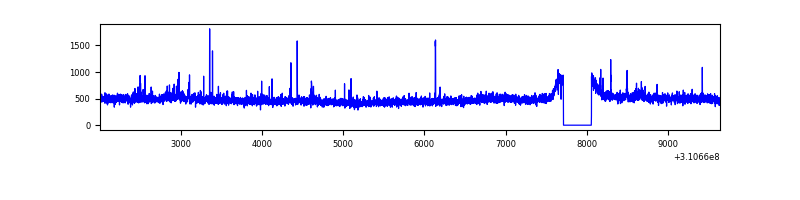 |
| C | 7634 | 7290 | 0 | 0 | 0.00% | 0.00% | 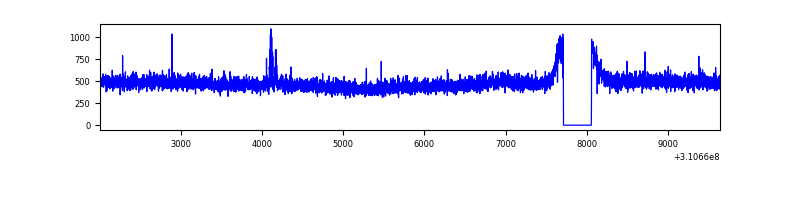 |
| D | 7634 | 7290 | 81 | 81 | 1.06% | 1.11% | 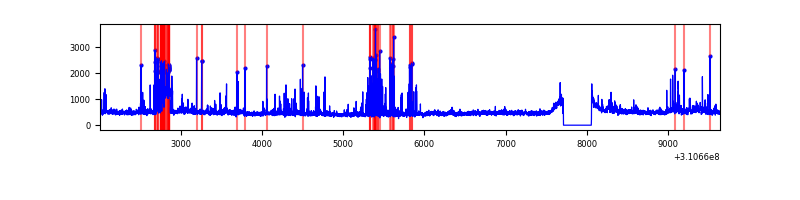 |
Top three noisy pixels from each quadrant. If the there are fewer than three noisy pixels in the level2.evt file, extra rows are filled as -1
| Pixel properties | Quadrant properties | ||||||
|---|---|---|---|---|---|---|---|
| Quadrant | DetID | PixID | Counts | Sigma | Mean | Median | Sigma |
| A | 13 | 254 | 13542 | 69.79 | 893 | 875 | 181.5 |
| A | 3 | 137 | 7697 | 37.58 | 893 | 875 | 181.5 |
| A | 0 | 226 | 7560 | 36.83 | 893 | 875 | 181.5 |
| B | 0 | 190 | 39974 | 227.72 | 885 | 862 | 171.8 |
| B | 4 | 171 | 22384 | 125.31 | 885 | 862 | 171.8 |
| B | 12 | 111 | 21055 | 117.57 | 885 | 862 | 171.8 |
| C | 14 | 238 | 134560 | 664.02 | 853 | 857 | 201.4 |
| C | 10 | 22 | 19756 | 93.86 | 853 | 857 | 201.4 |
| C | 10 | 91 | 8586 | 38.39 | 853 | 857 | 201.4 |
| D | 1 | 52 | 574362 | 2716.64 | 868 | 841 | 211.1 |
| D | 12 | 227 | 72348 | 338.71 | 868 | 841 | 211.1 |
| D | 2 | 234 | 35668 | 164.97 | 868 | 841 | 211.1 |
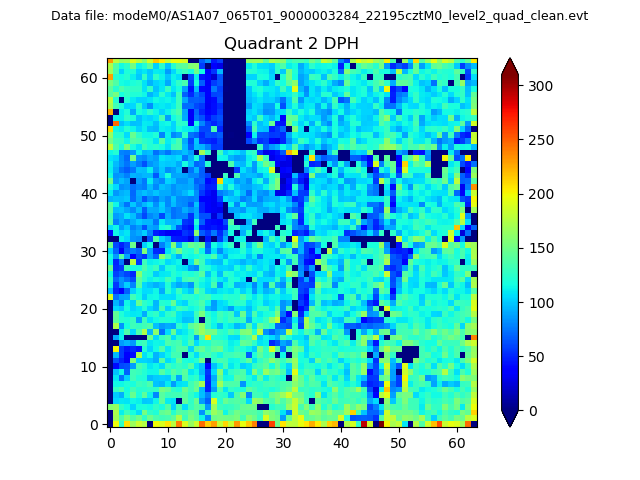
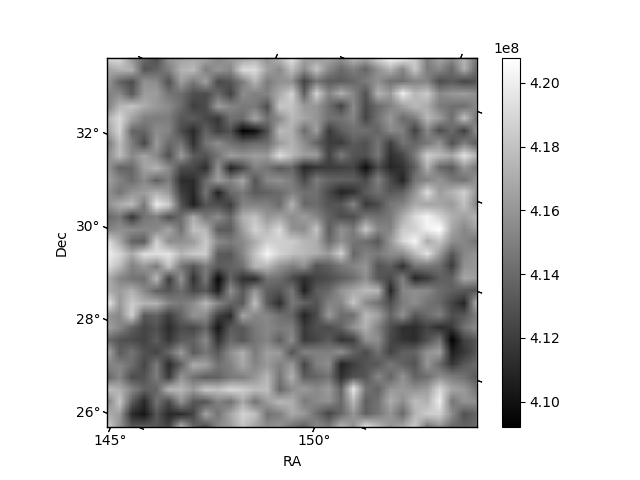
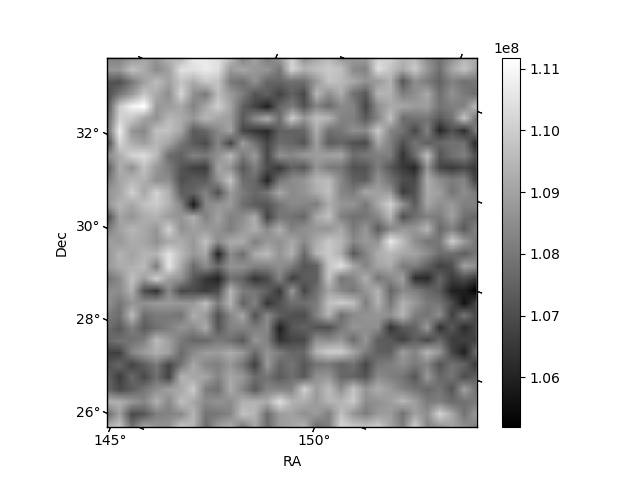
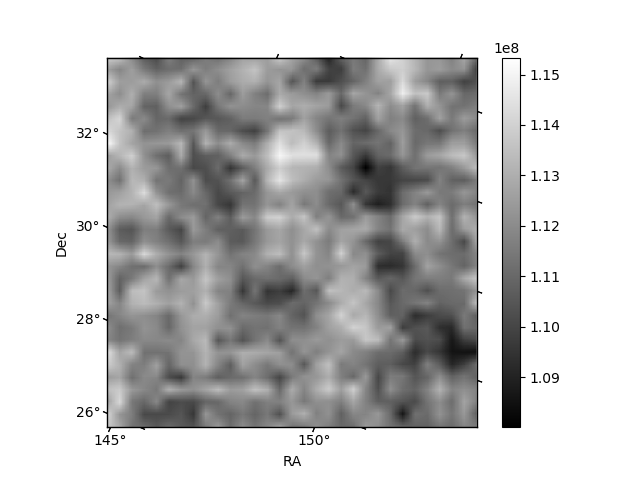
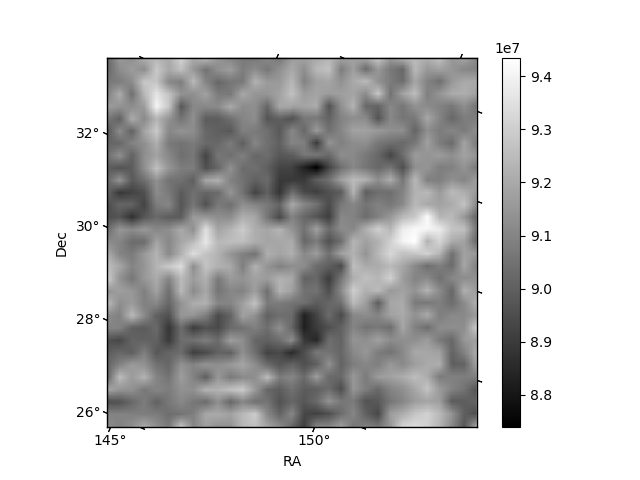
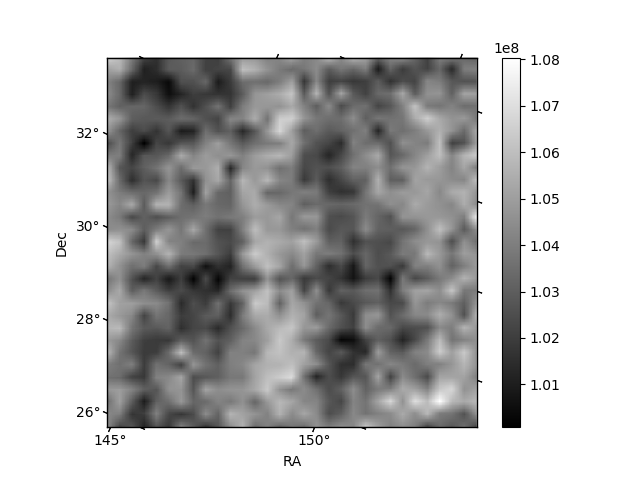
Histogram calculated using DETX and DETY for each event in the final _common_clean file
| Quadrant A | 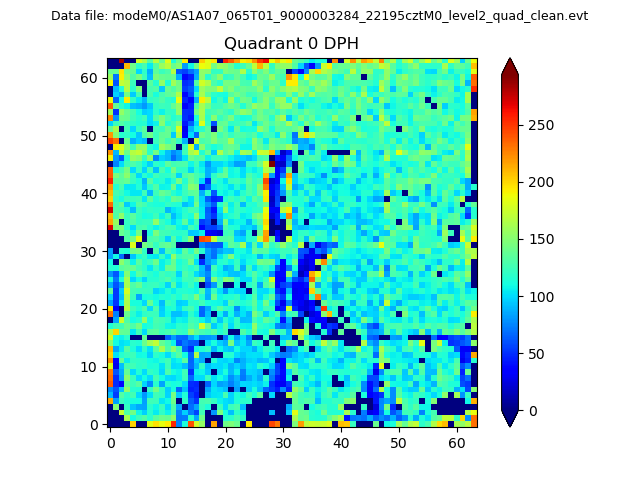 |
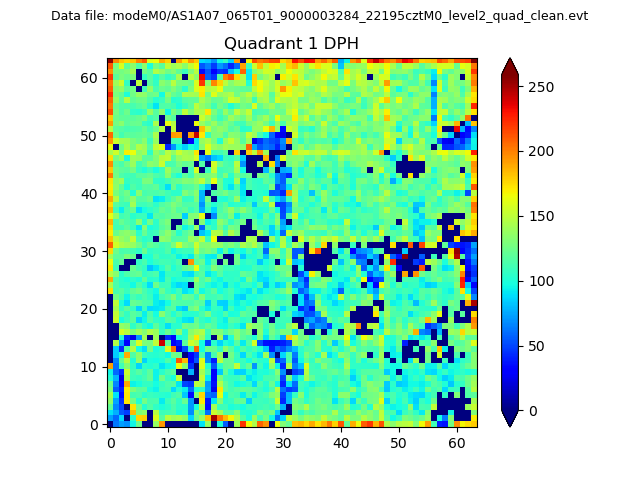 |
Quadrant B |
|---|---|---|---|
| Quadrant D | 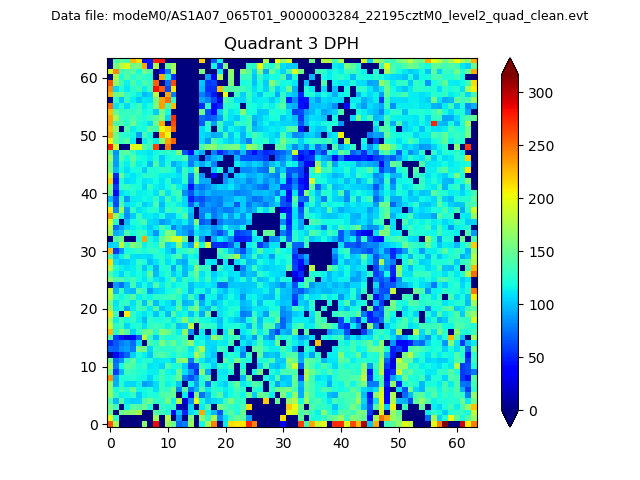 |
 |
Quadrant C |
| Plot type | Count rate plots | Images |
|---|---|---|
| Comparison with Poisson distribution Blue bars denote a histogram of data divided into 1 sec bins. Red curve is a Poisson curve with rate = median count rate of data. |
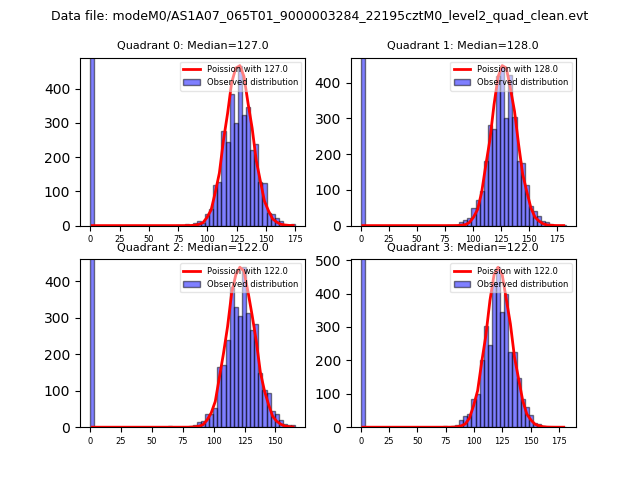 |
 |
| Quadrant-wise count rates Data is divided into 100 sec bins |
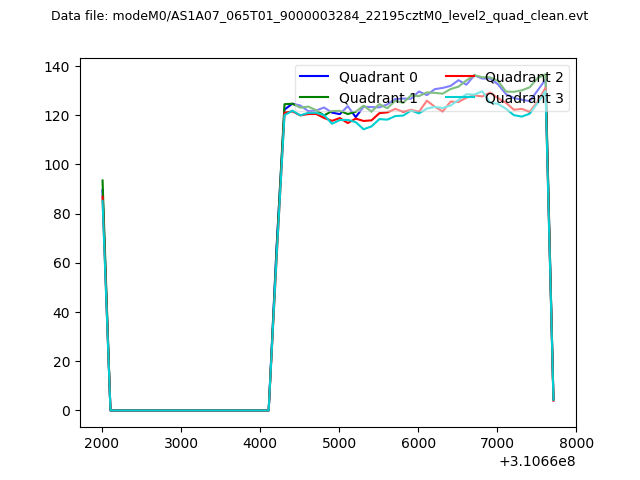 |
|
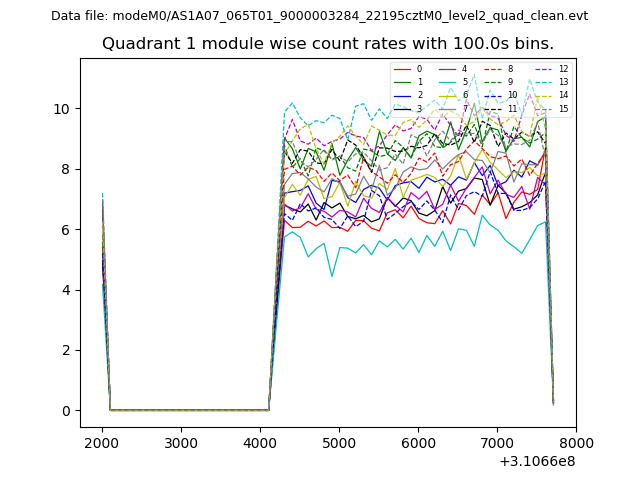
| Module-wise count rates for Quadrant A Data is divided into 100 sec bins |
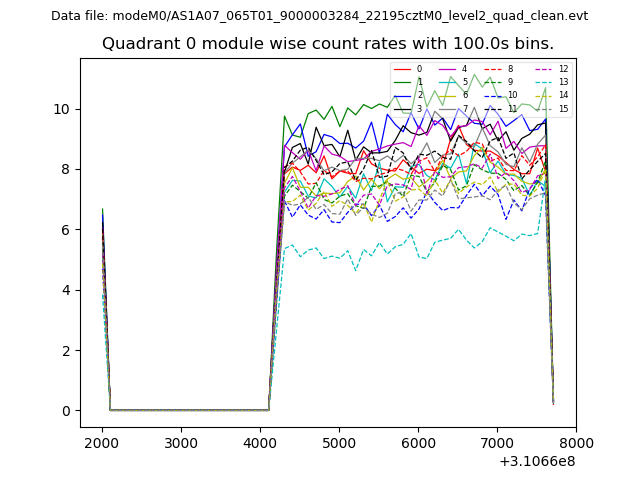 |
 |
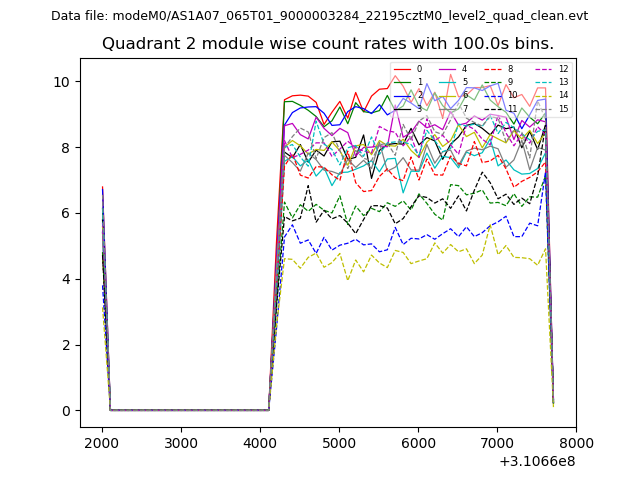
| Module-wise count rates for Quadrant B Data is divided into 100 sec bins |
 |
 |
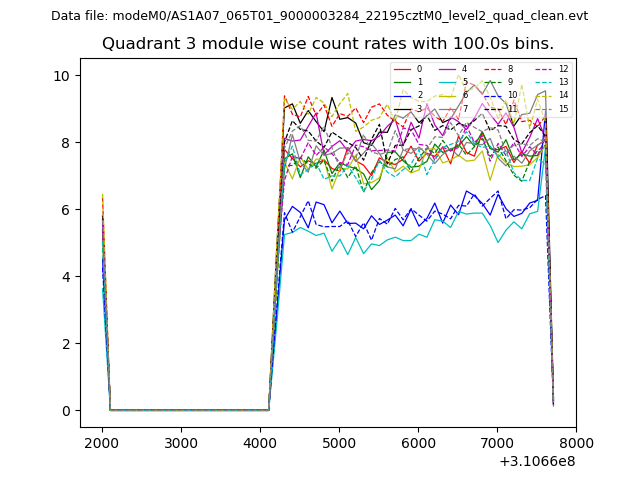
| Module-wise count rates for Quadrant C Data is divided into 100 sec bins |
 |
 |
| Module-wise count rates for Quadrant D Data is divided into 100 sec bins |
 |
 |
| Parameter | Plot |
|---|---|
| CZT HV Monitor | 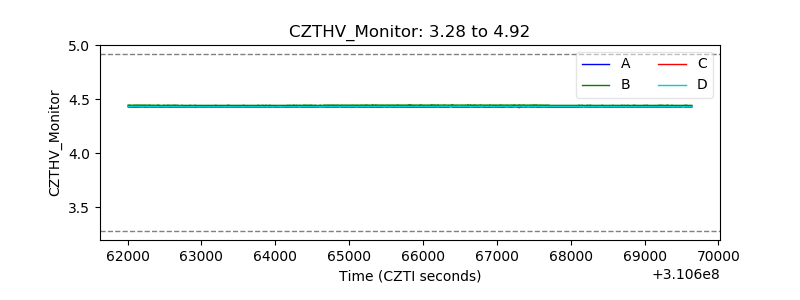 |
| D_VDD | 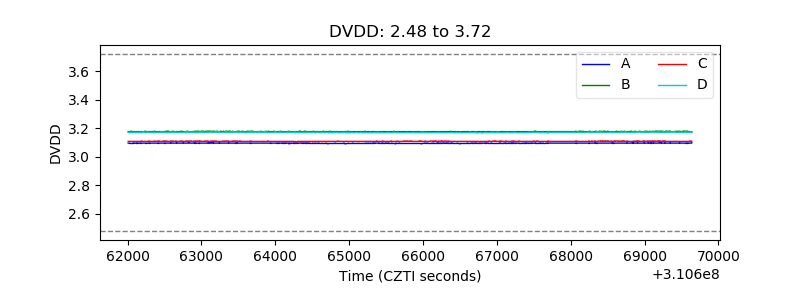 |
| Temperature 1 | 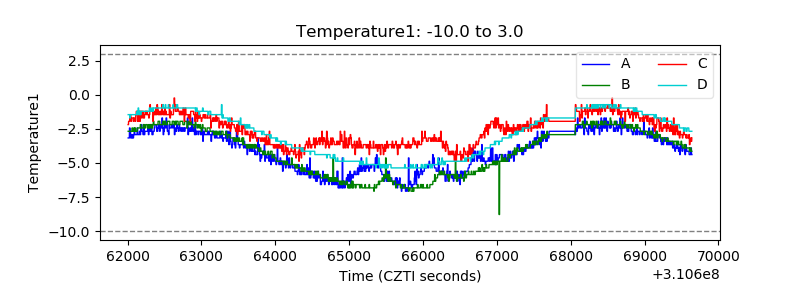 |
| Veto HV Monitor | 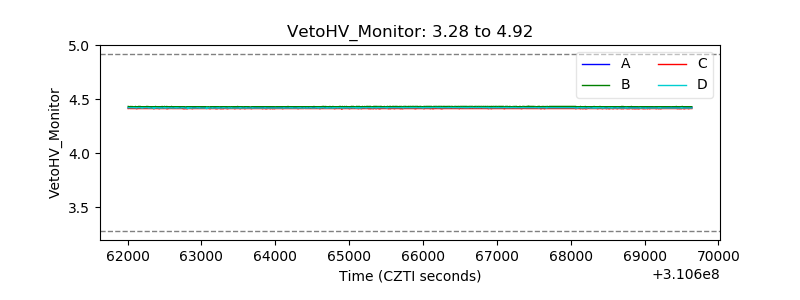 |
| Veto LLD | 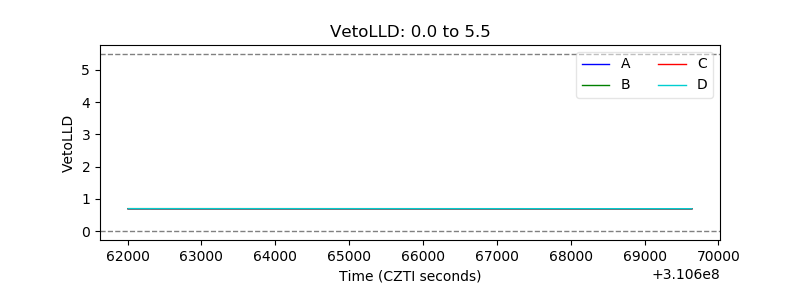 |
| Alpha Counter | 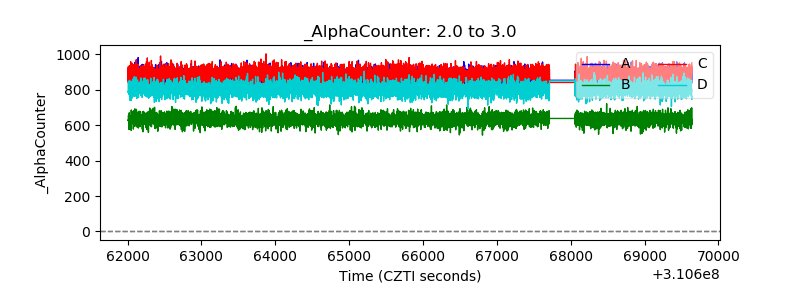 |
| _CPM_Rate | 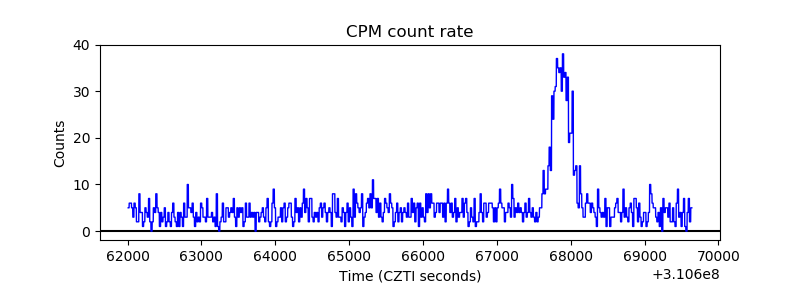 |
| CZT Counter | 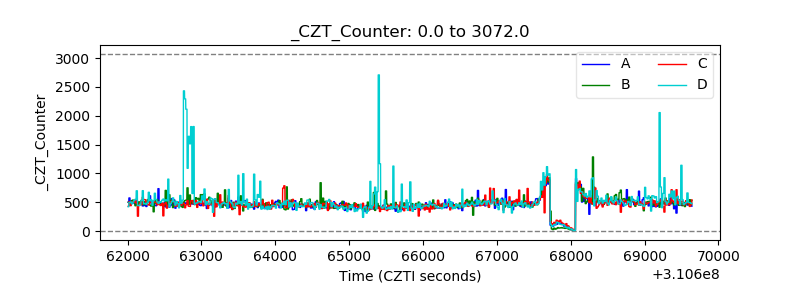 |
| +2.5 Volts monitor |  |
| +5 Volts monitor |  |
| _ROLL_ROT | 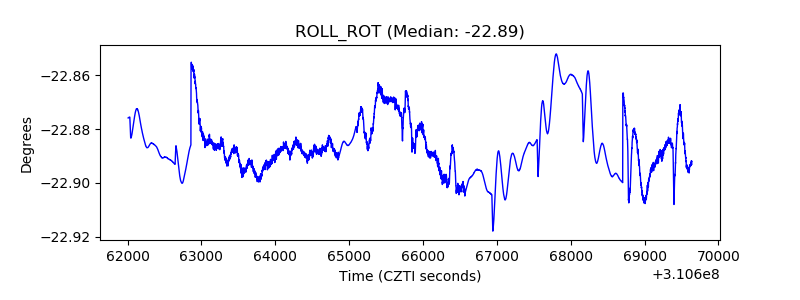 |
| _Roll_DEC | 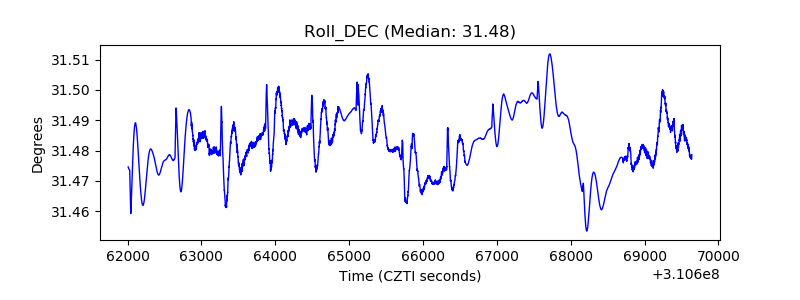 |
| _Roll_RA | 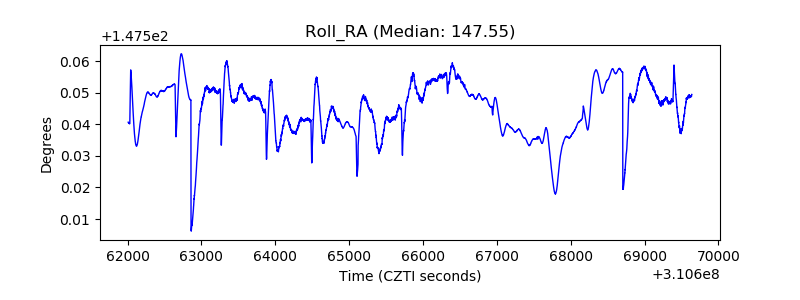 |
| Veto Counter | 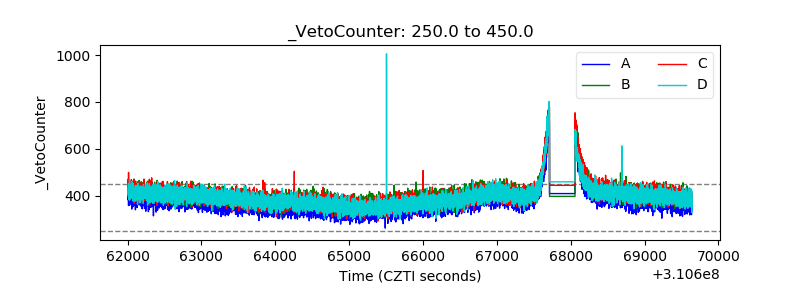 |