| Param | Original file | Final file |
|---|---|---|
| Filename | modeM0/AS1A07_065T01_9000003284_22203cztM0_level2.evt | modeM0/AS1A07_065T01_9000003284_22203cztM0_level2_quad_clean.evt |
| Size (bytes) | 401,304,960 | 92,266,560 |
| Size | 382.7 MB | 88.0 MB |
| Events in quadrant A | 2,940,865 | 608,149 |
| Events in quadrant B | 2,991,945 | 620,087 |
| Events in quadrant C | 2,951,640 | 583,010 |
| Events in quadrant D | 2,864,193 | 567,072 |
| Mode SS | |||
|---|---|---|---|
| Quadrant | BADHDUFLAG | Total packets | Discarded packets |
| A | 0 | 122 | 0 |
| B | 0 | 122 | 0 |
| C | 0 | 122 | 0 |
| D | 0 | 122 | 0 |
| Mode M9 | |||
|---|---|---|---|
| Quadrant | BADHDUFLAG | Total packets | Discarded packets |
| A | 0 | 13 | 0 |
| B | 0 | 13 | 0 |
| C | 0 | 13 | 0 |
| D | 0 | 13 | 0 |
| Mode M0 | |||
|---|---|---|---|
| Quadrant | BADHDUFLAG | Total packets | Discarded packets |
| A | 0 | 12272 | 1 |
| B | 0 | 12410 | 1 |
| C | 0 | 12362 | 1 |
| D | 0 | 12383 | 1 |
| Quadrant | Total seconds | Saturated seconds | Saturation percentage |
|---|---|---|---|
| A | 5949 | 16 | 0.268953% |
| B | 5950 | 31 | 0.521008% |
| C | 5950 | 51 | 0.857143% |
| D | 5950 | 26 | 0.436975% |
Noise dominated data is calculated using 1-second bins in cleaned event files. If a bin has >2000 counts, and if more than 50% of those come from <1% of pixels, then it is considered to be noise-dominated and hence unusable.
| Quadrant | # 1 sec bins | Bins with >0 counts | Bins with >2000 counts | High rate bins dominated by noise | Noise dominated (total time) | Noise dominated (detector-on time) | Marked lightcurve |
|---|---|---|---|---|---|---|---|
| A | 7259 | 5950 | 0 | 0 | 0.00% | 0.00% | 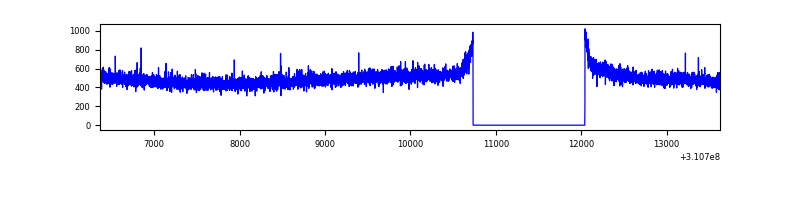 |
| B | 7260 | 5951 | 0 | 0 | 0.00% | 0.00% | 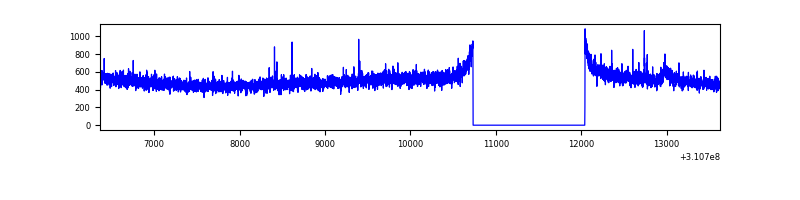 |
| C | 7260 | 5951 | 0 | 0 | 0.00% | 0.00% | 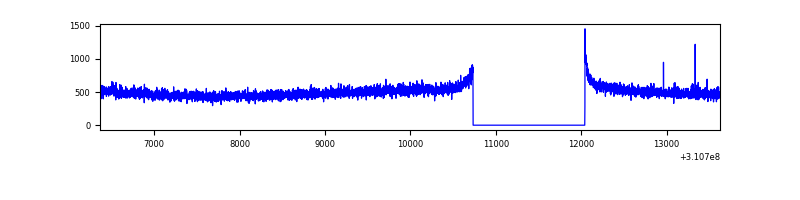 |
| D | 7260 | 5951 | 18 | 18 | 0.25% | 0.30% | 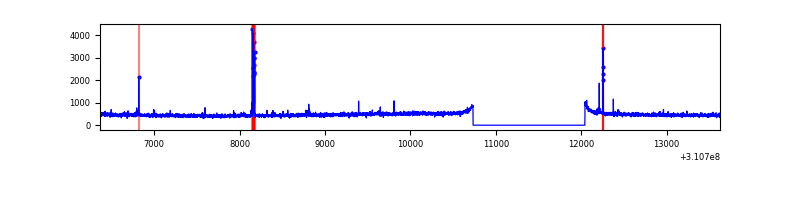 |
Top three noisy pixels from each quadrant. If the there are fewer than three noisy pixels in the level2.evt file, extra rows are filled as -1
| Pixel properties | Quadrant properties | ||||||
|---|---|---|---|---|---|---|---|
| Quadrant | DetID | PixID | Counts | Sigma | Mean | Median | Sigma |
| A | 13 | 254 | 10075 | 61.82 | 763 | 751 | 150.8 |
| A | 0 | 226 | 6673 | 39.26 | 763 | 751 | 150.8 |
| A | 3 | 137 | 6111 | 35.54 | 763 | 751 | 150.8 |
| B | 12 | 111 | 16891 | 113.76 | 759 | 742 | 142.0 |
| B | 11 | 111 | 14847 | 99.36 | 759 | 742 | 142.0 |
| B | 14 | 111 | 13741 | 91.57 | 759 | 742 | 142.0 |
| C | 14 | 238 | 117893 | 703.39 | 724 | 732 | 166.6 |
| C | 13 | 61 | 5096 | 26.2 | 724 | 732 | 166.6 |
| C | 0 | 10 | 4214 | 20.9 | 724 | 732 | 166.6 |
| D | 13 | 104 | 53333 | 301.97 | 728 | 706 | 174.3 |
| D | 2 | 234 | 24819 | 138.36 | 728 | 706 | 174.3 |
| D | 2 | 136 | 19290 | 106.63 | 728 | 706 | 174.3 |
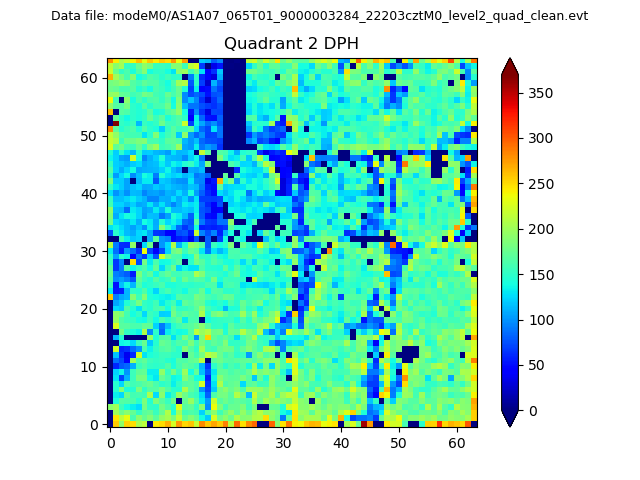
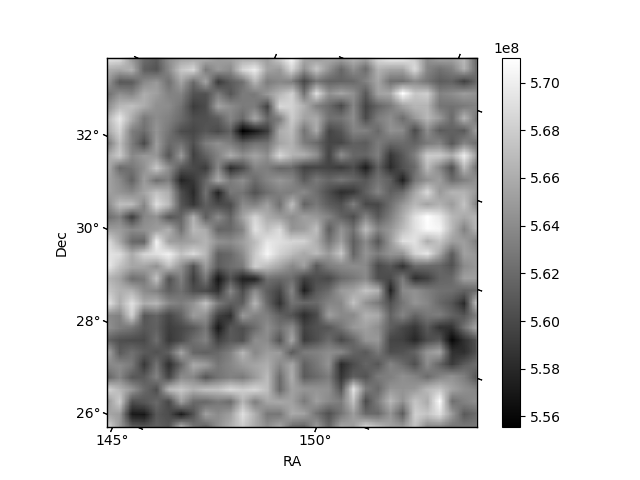
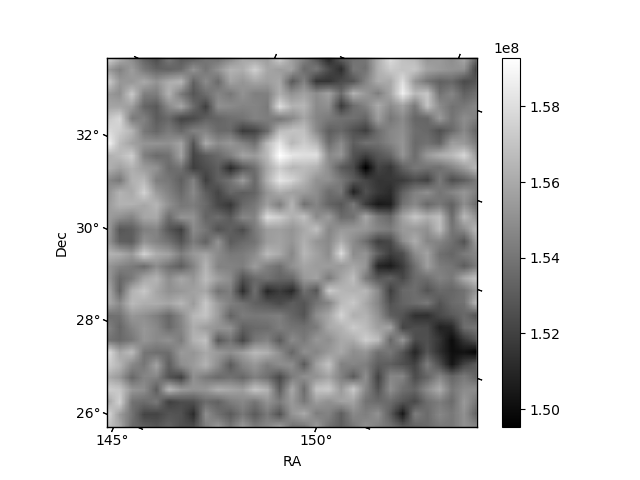
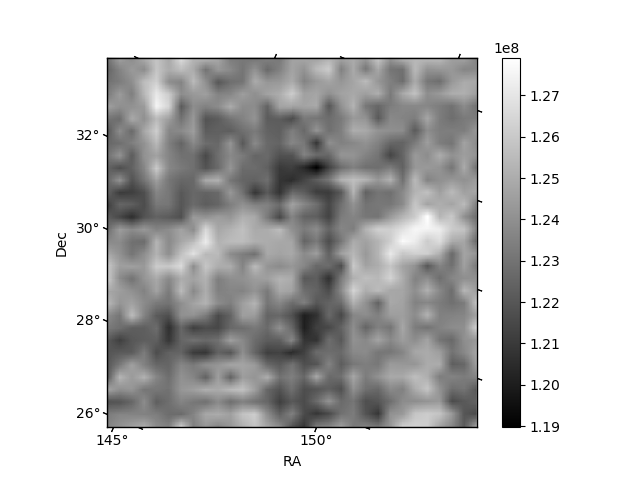
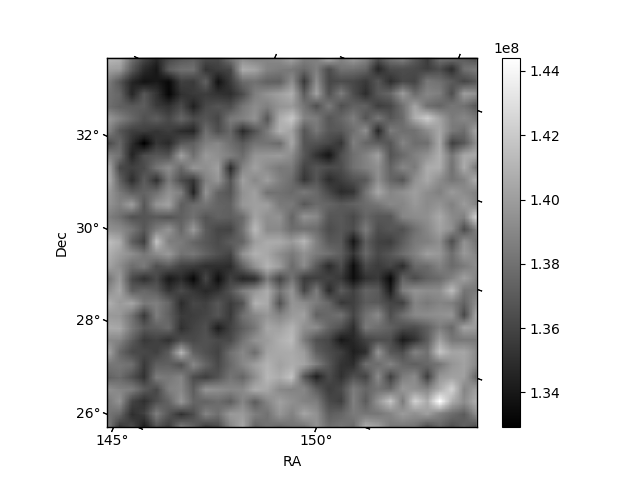
Histogram calculated using DETX and DETY for each event in the final _common_clean file
| Quadrant A | 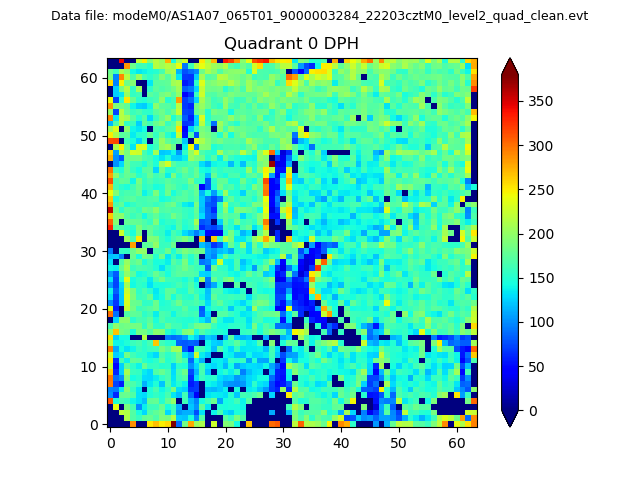 |
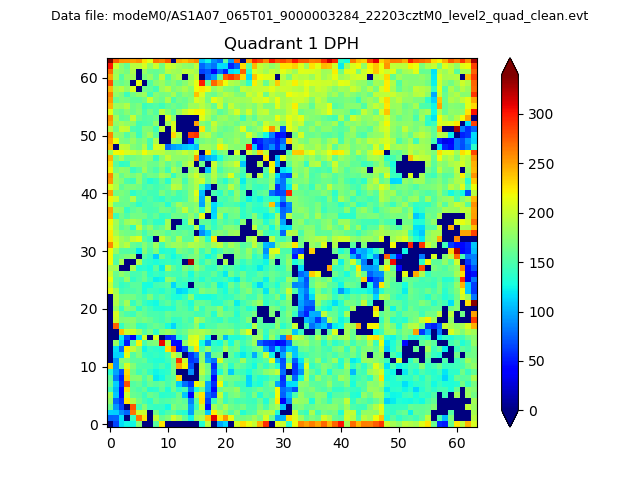 |
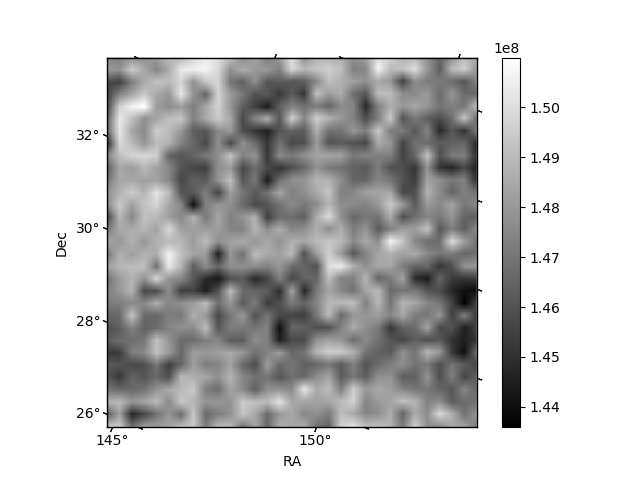
Quadrant B |
|---|---|---|---|
| Quadrant D | 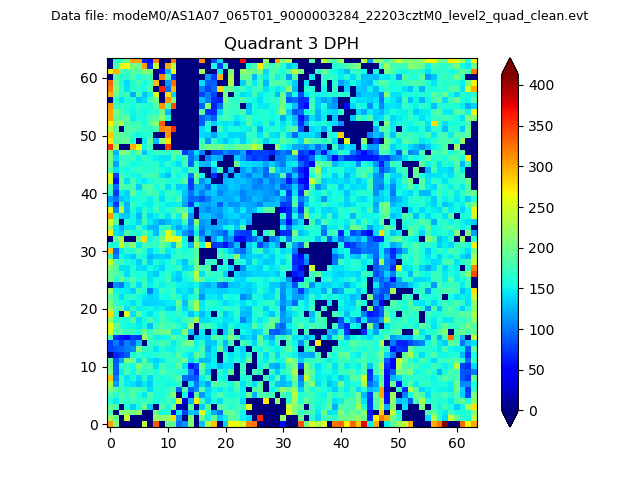 |
 |
Quadrant C |
| Plot type | Count rate plots | Images |
|---|---|---|
| Comparison with Poisson distribution Blue bars denote a histogram of data divided into 1 sec bins. Red curve is a Poisson curve with rate = median count rate of data. |
 |
 |
| Quadrant-wise count rates Data is divided into 100 sec bins |
 |
|
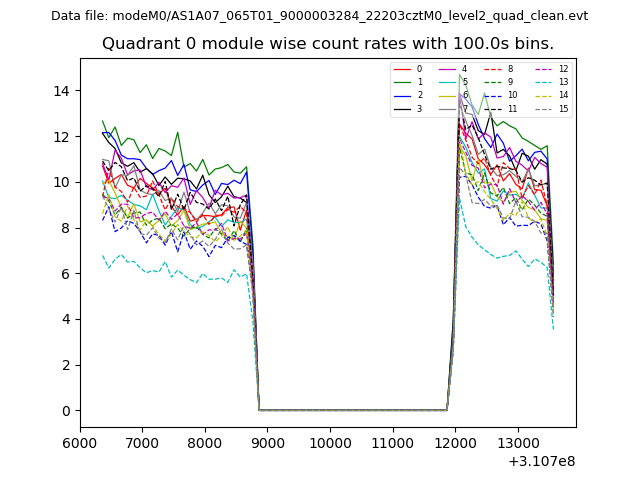
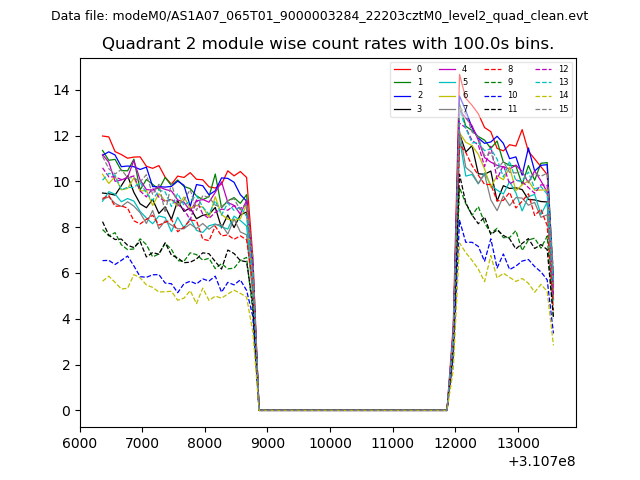
| Module-wise count rates for Quadrant A Data is divided into 100 sec bins |
 |
 |
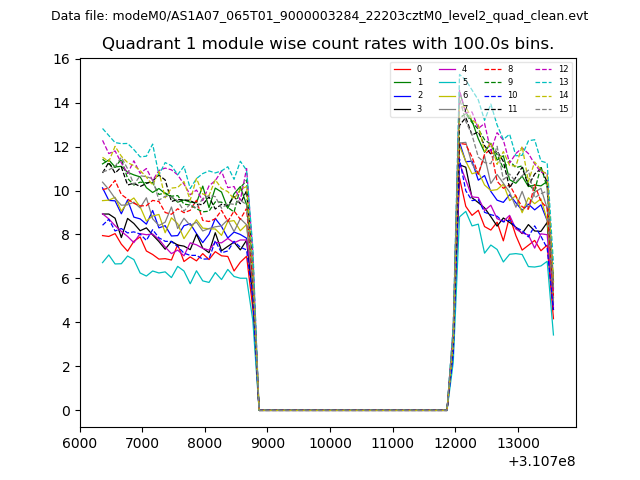
| Module-wise count rates for Quadrant B Data is divided into 100 sec bins |
 |
 |
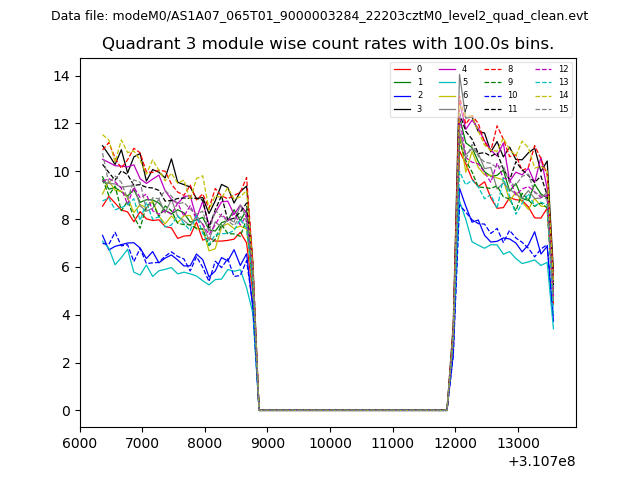
| Module-wise count rates for Quadrant C Data is divided into 100 sec bins |
 |
 |
| Module-wise count rates for Quadrant D Data is divided into 100 sec bins |
 |
 |
| Parameter | Plot |
|---|---|
| CZT HV Monitor | 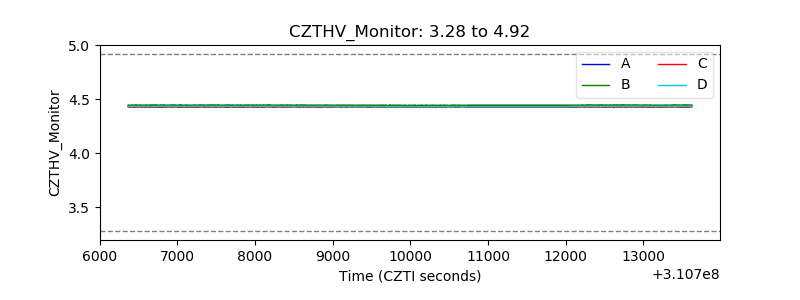 |
| D_VDD | 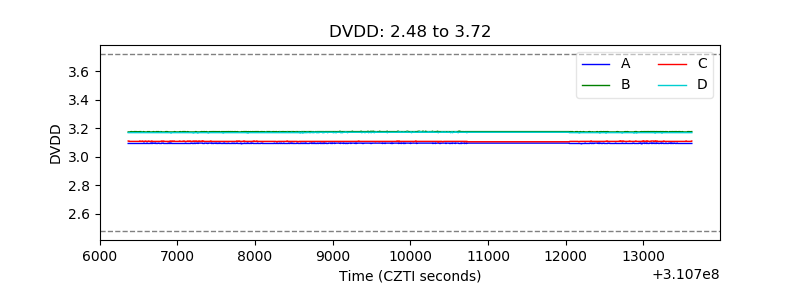 |
| Temperature 1 | 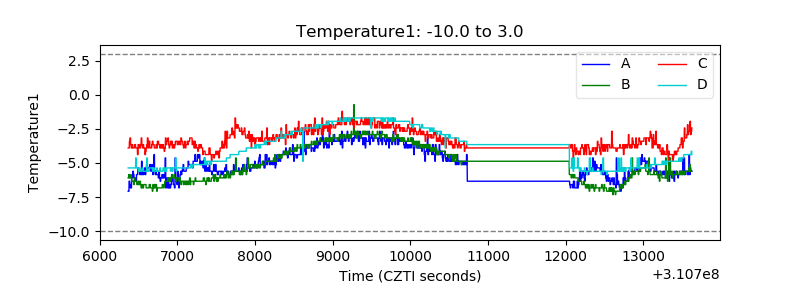 |
| Veto HV Monitor | 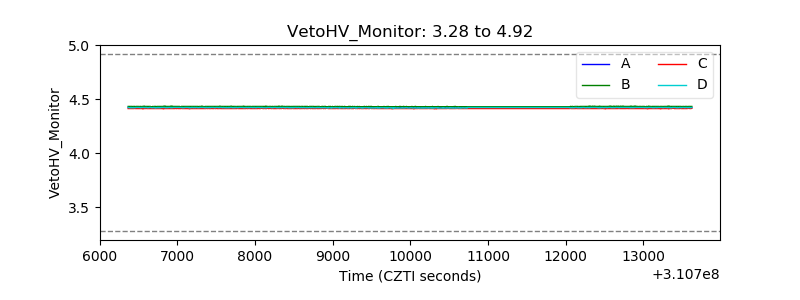 |
| Veto LLD | 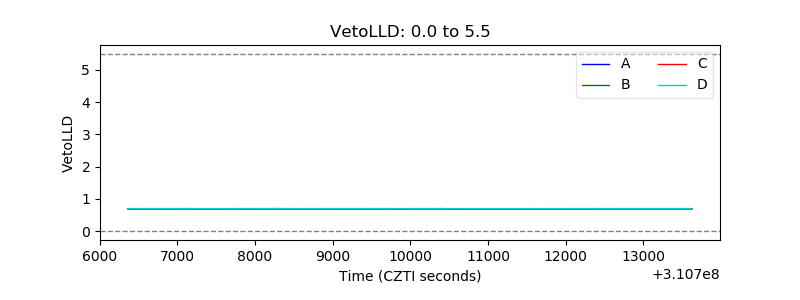 |
| Alpha Counter | 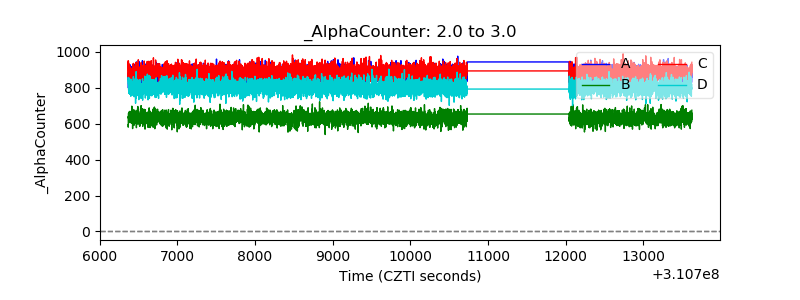 |
| _CPM_Rate |  |
| CZT Counter | 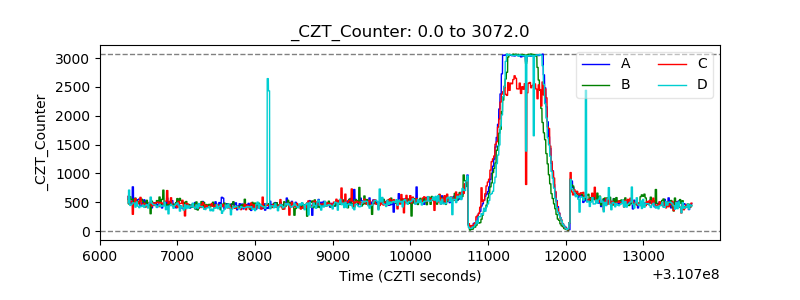 |
| +2.5 Volts monitor |  |
| +5 Volts monitor |  |
| _ROLL_ROT | 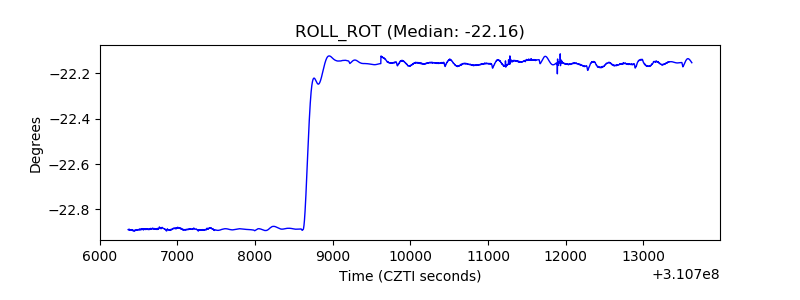 |
| _Roll_DEC | 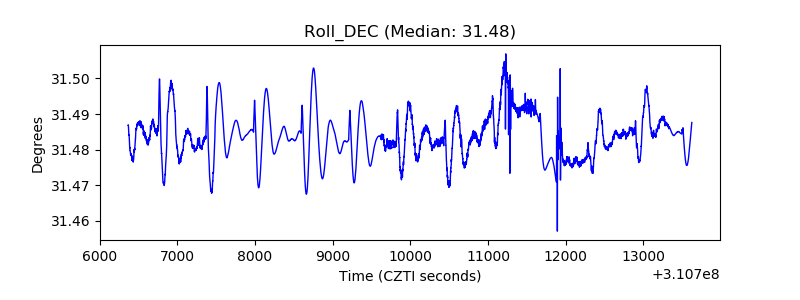 |
| _Roll_RA | 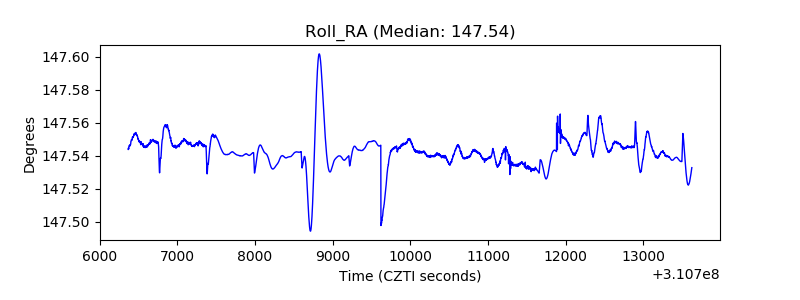 |
| Veto Counter | 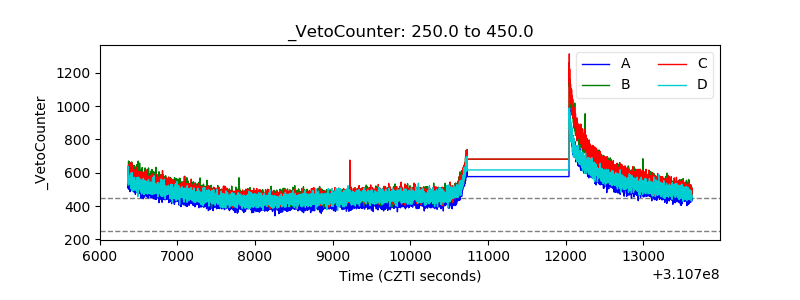 |