| Param | Original file | Final file |
|---|---|---|
| Filename | modeM0/AS1A07_065T01_9000003284_22206cztM0_level2.evt | modeM0/AS1A07_065T01_9000003284_22206cztM0_level2_quad_clean.evt |
| Size (bytes) | 437,636,160 | 92,589,120 |
| Size | 417.4 MB | 88.3 MB |
| Events in quadrant A | 3,158,112 | 598,160 |
| Events in quadrant B | 3,303,940 | 605,259 |
| Events in quadrant C | 3,181,953 | 578,059 |
| Events in quadrant D | 3,169,227 | 570,481 |
| Mode SS | |||
|---|---|---|---|
| Quadrant | BADHDUFLAG | Total packets | Discarded packets |
| A | 0 | 132 | 0 |
| B | 0 | 132 | 0 |
| C | 0 | 132 | 0 |
| D | 0 | 132 | 0 |
| Mode M9 | |||
|---|---|---|---|
| Quadrant | BADHDUFLAG | Total packets | Discarded packets |
| A | 0 | 10 | 0 |
| B | 0 | 10 | 0 |
| C | 0 | 10 | 0 |
| D | 0 | 10 | 0 |
| Mode M0 | |||
|---|---|---|---|
| Quadrant | BADHDUFLAG | Total packets | Discarded packets |
| A | 0 | 13258 | 1 |
| B | 0 | 13691 | 1 |
| C | 0 | 13338 | 1 |
| D | 0 | 13514 | 1 |
| Quadrant | Total seconds | Saturated seconds | Saturation percentage |
|---|---|---|---|
| A | 6479 | 91 | 1.404538% |
| B | 6480 | 100 | 1.543210% |
| C | 6480 | 82 | 1.265432% |
| D | 6480 | 70 | 1.080247% |
Noise dominated data is calculated using 1-second bins in cleaned event files. If a bin has >2000 counts, and if more than 50% of those come from <1% of pixels, then it is considered to be noise-dominated and hence unusable.
| Quadrant | # 1 sec bins | Bins with >0 counts | Bins with >2000 counts | High rate bins dominated by noise | Noise dominated (total time) | Noise dominated (detector-on time) | Marked lightcurve |
|---|---|---|---|---|---|---|---|
| A | 7464 | 6480 | 0 | 0 | 0.00% | 0.00% | 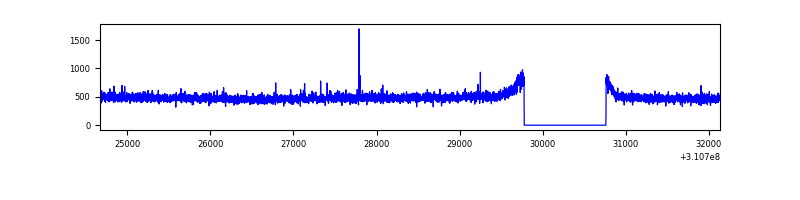 |
| B | 7465 | 6481 | 8 | 8 | 0.11% | 0.12% | 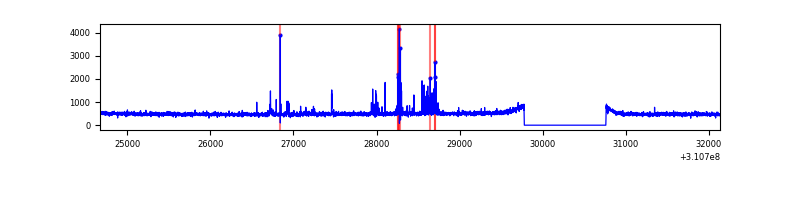 |
| C | 7465 | 6481 | 2 | 2 | 0.03% | 0.03% | 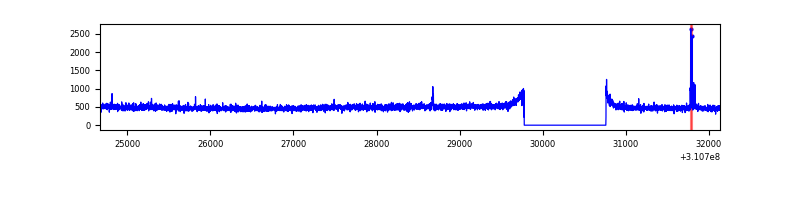 |
| D | 7465 | 6481 | 11 | 11 | 0.15% | 0.17% | 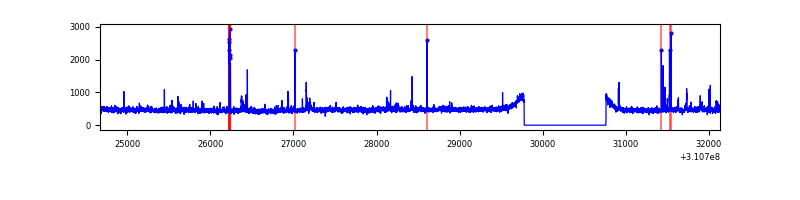 |
Top three noisy pixels from each quadrant. If the there are fewer than three noisy pixels in the level2.evt file, extra rows are filled as -1
| Pixel properties | Quadrant properties | ||||||
|---|---|---|---|---|---|---|---|
| Quadrant | DetID | PixID | Counts | Sigma | Mean | Median | Sigma |
| A | 13 | 254 | 10616 | 59.89 | 818 | 802 | 163.9 |
| A | 0 | 226 | 7123 | 38.58 | 818 | 802 | 163.9 |
| A | 3 | 137 | 6888 | 37.14 | 818 | 802 | 163.9 |
| B | 4 | 173 | 115436 | 747.05 | 806 | 785 | 153.5 |
| B | 0 | 190 | 27321 | 172.9 | 806 | 785 | 153.5 |
| B | 12 | 111 | 18502 | 115.44 | 806 | 785 | 153.5 |
| C | 14 | 238 | 123293 | 677.79 | 776 | 781 | 180.8 |
| C | 10 | 22 | 24659 | 132.1 | 776 | 781 | 180.8 |
| C | 15 | 127 | 7355 | 36.37 | 776 | 781 | 180.8 |
| D | 1 | 52 | 90203 | 462.31 | 795 | 771 | 193.4 |
| D | 2 | 234 | 29862 | 150.38 | 795 | 771 | 193.4 |
| D | 15 | 145 | 28142 | 141.49 | 795 | 771 | 193.4 |
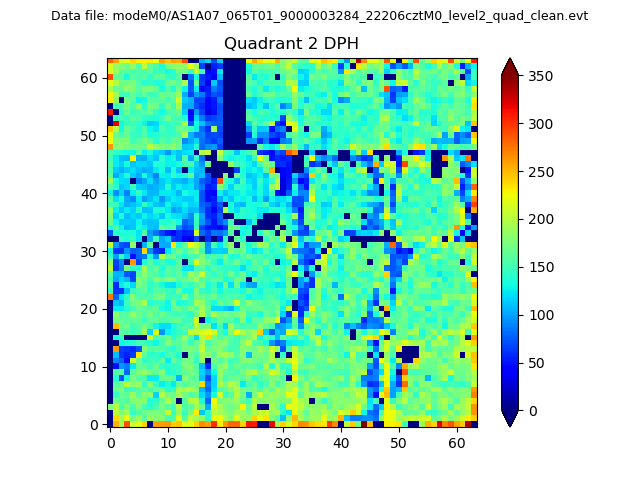
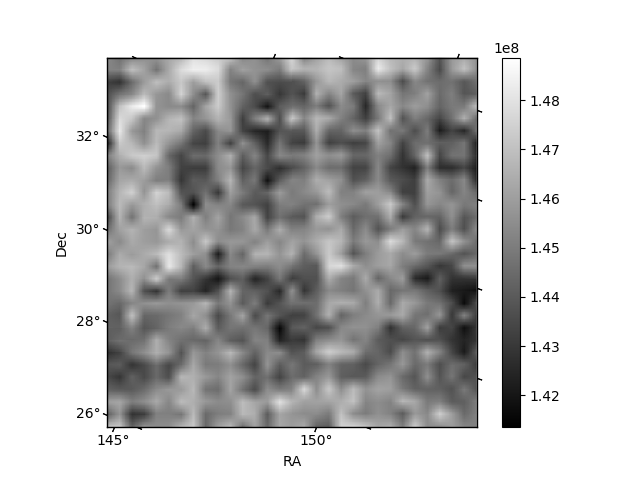
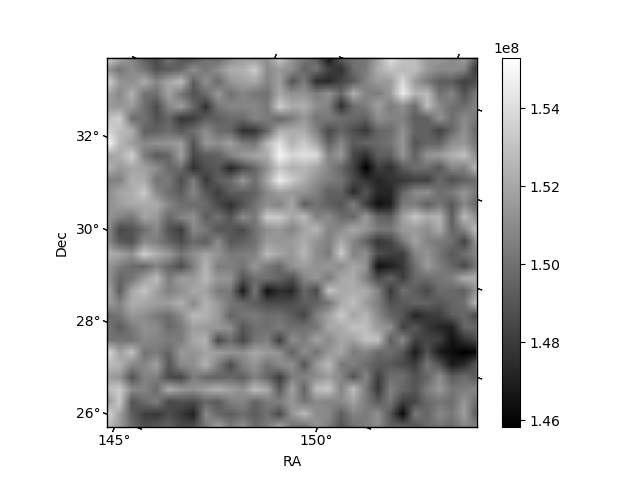
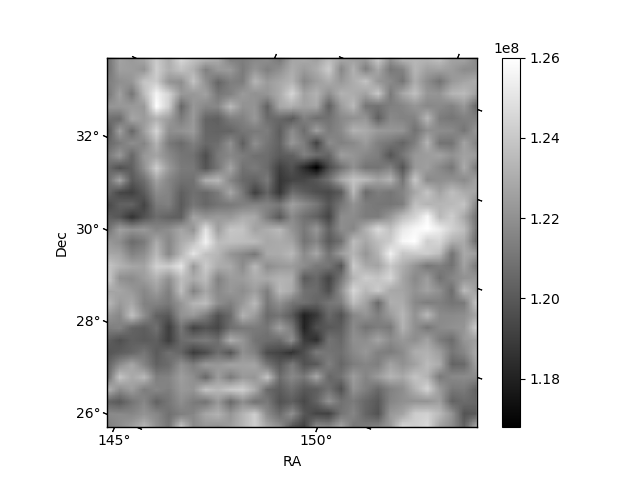
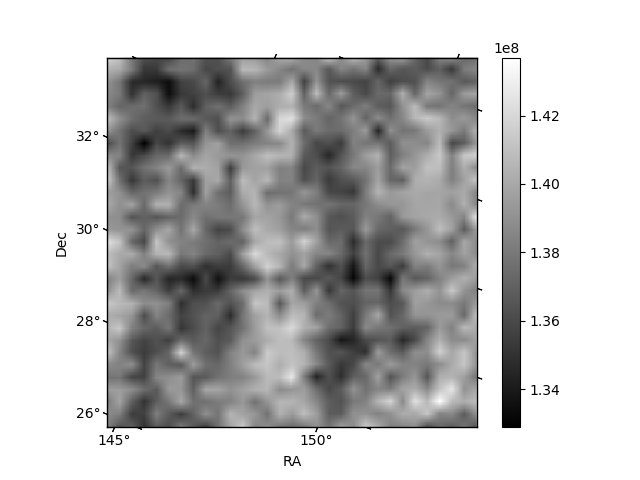
Histogram calculated using DETX and DETY for each event in the final _common_clean file
| Quadrant A | 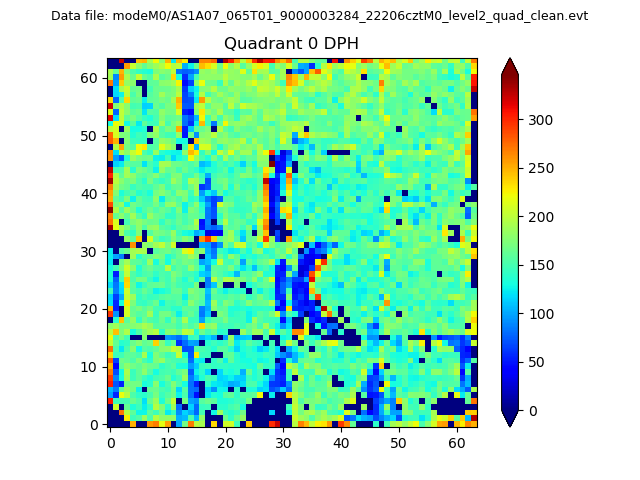 |
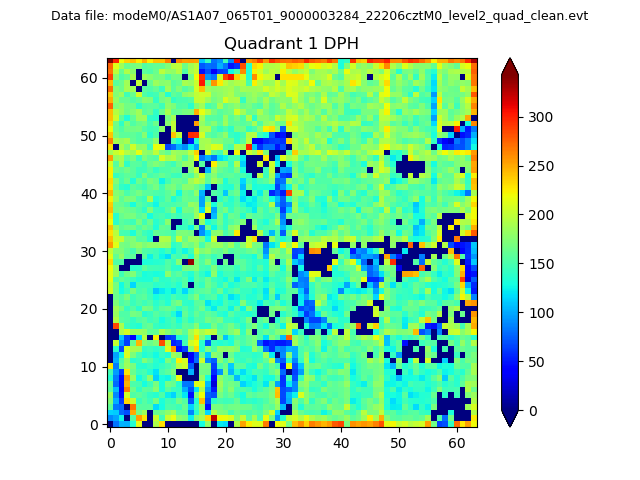 |
Quadrant B |
|---|---|---|---|
| Quadrant D | 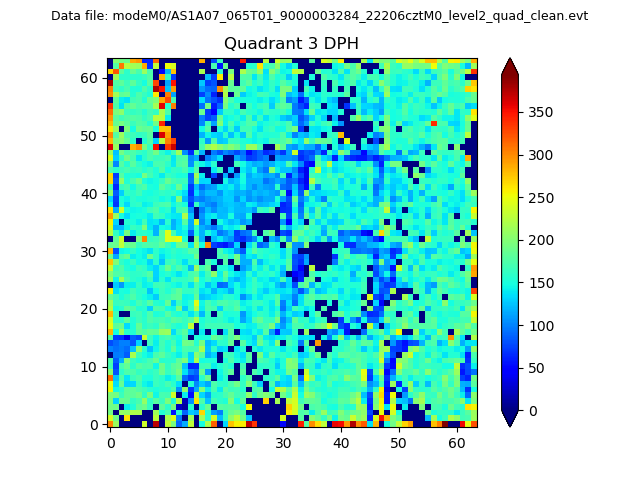 |
 |
Quadrant C |
| Plot type | Count rate plots | Images |
|---|---|---|
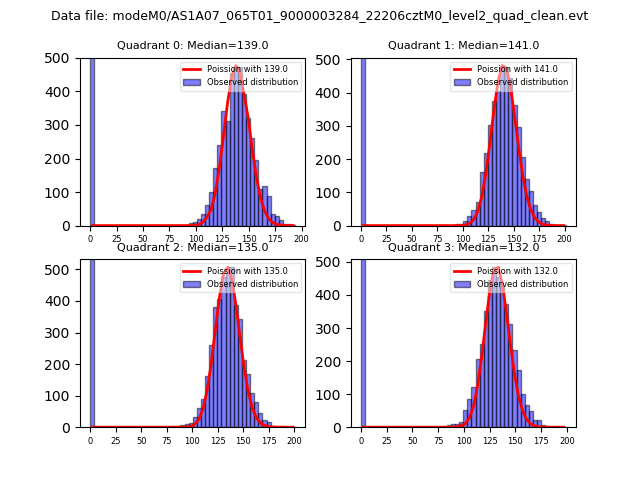
| Comparison with Poisson distribution Blue bars denote a histogram of data divided into 1 sec bins. Red curve is a Poisson curve with rate = median count rate of data. |
 |
 |
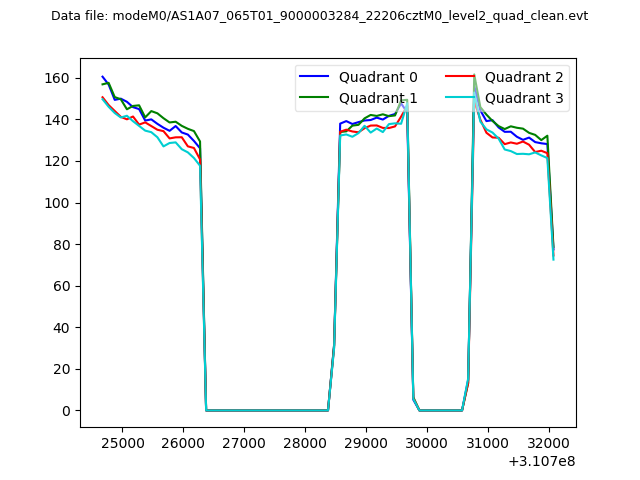
| Quadrant-wise count rates Data is divided into 100 sec bins |
 |
|
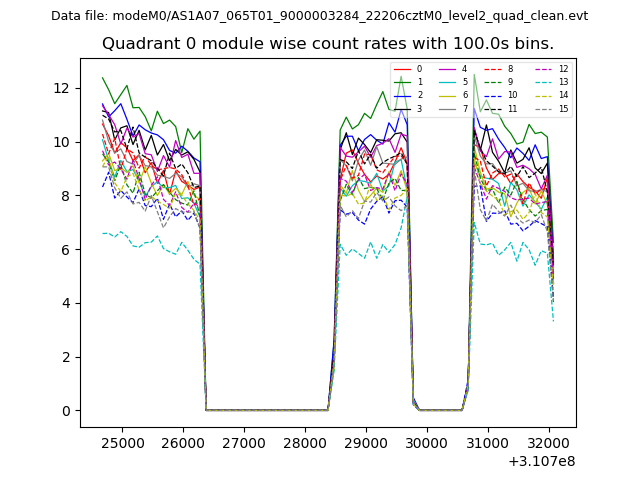
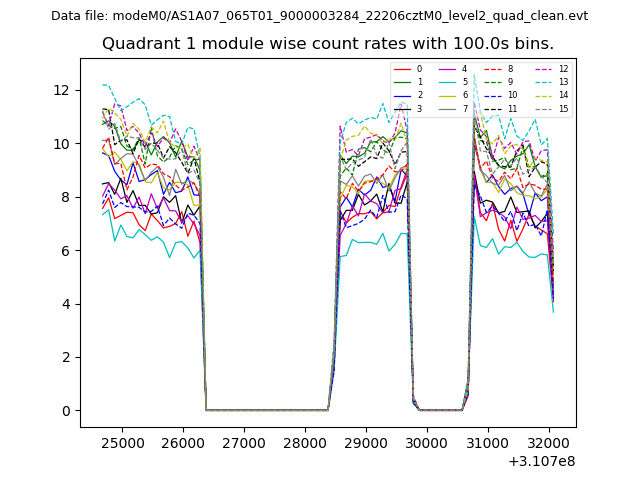
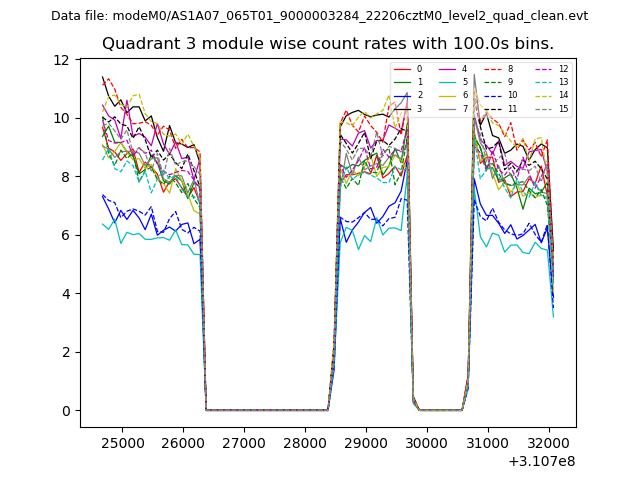
| Module-wise count rates for Quadrant A Data is divided into 100 sec bins |
 |
 |
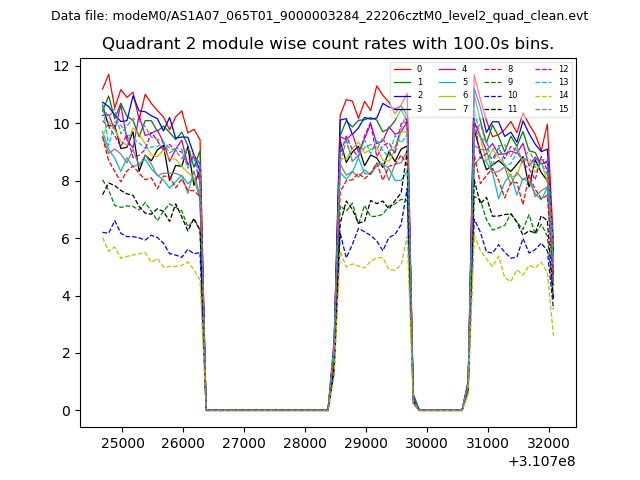
| Module-wise count rates for Quadrant B Data is divided into 100 sec bins |
 |
 |
| Module-wise count rates for Quadrant C Data is divided into 100 sec bins |
 |
 |
| Module-wise count rates for Quadrant D Data is divided into 100 sec bins |
 |
 |
| Parameter | Plot |
|---|---|
| CZT HV Monitor | 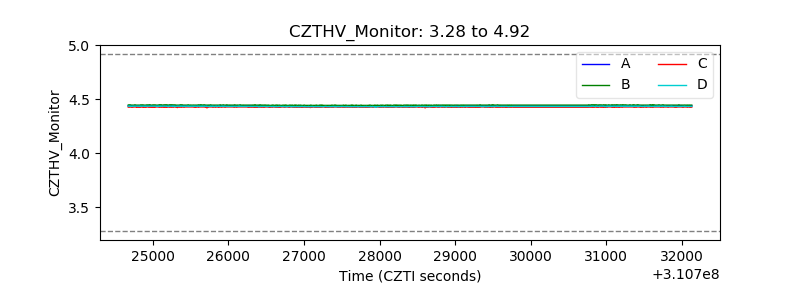 |
| D_VDD | 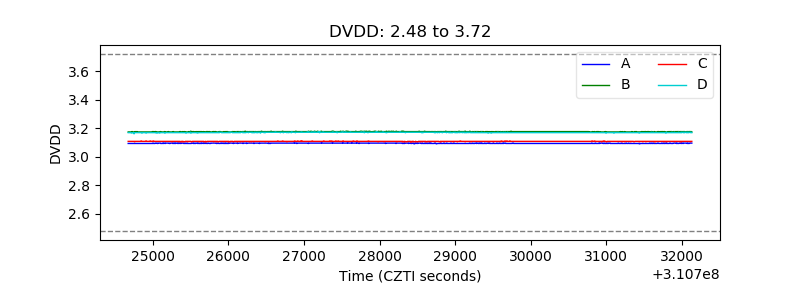 |
| Temperature 1 | 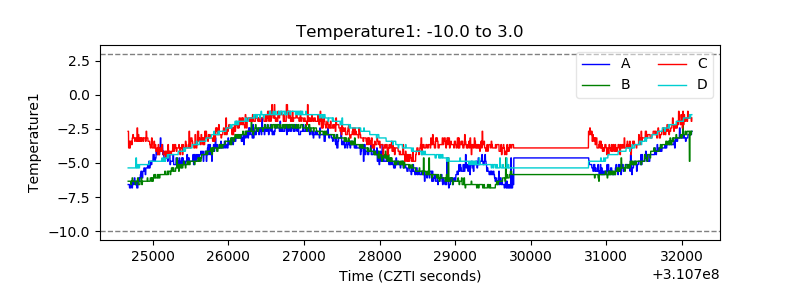 |
| Veto HV Monitor | 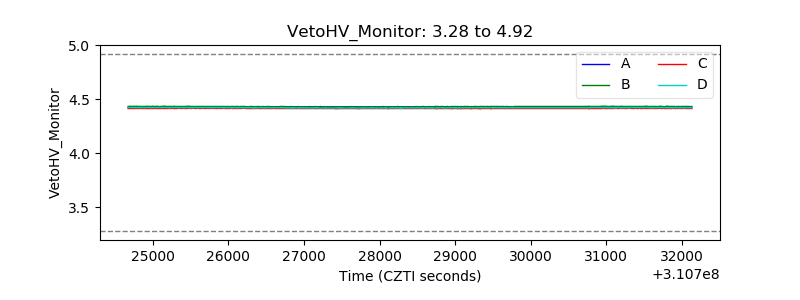 |
| Veto LLD | 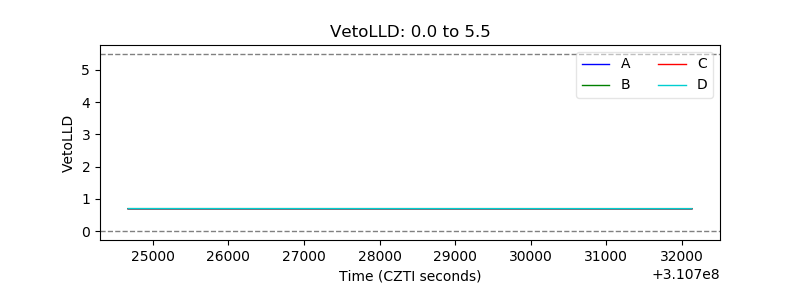 |
| Alpha Counter | 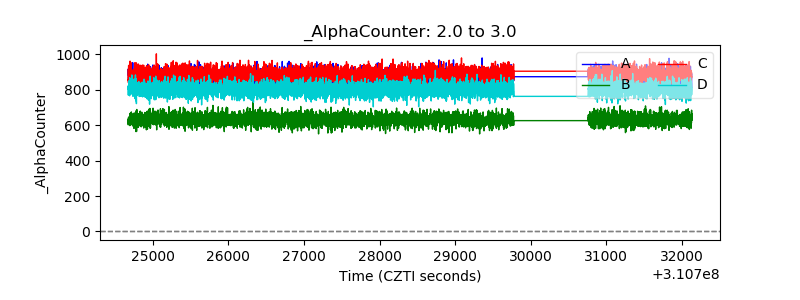 |
| _CPM_Rate | 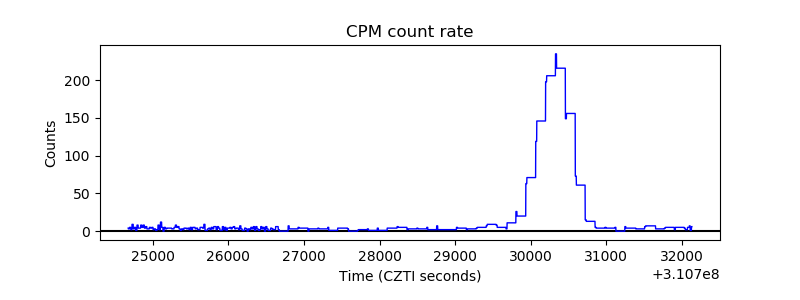 |
| CZT Counter | 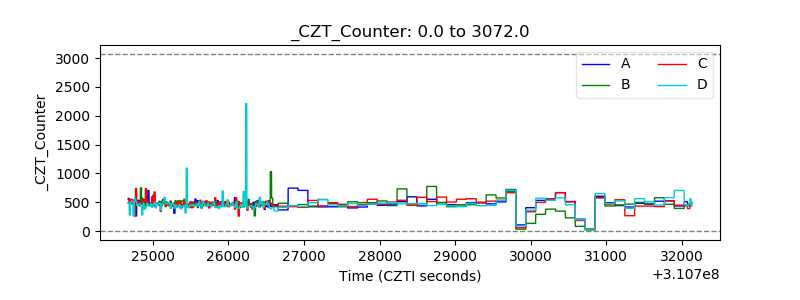 |
| +2.5 Volts monitor |  |
| +5 Volts monitor |  |
| _ROLL_ROT | 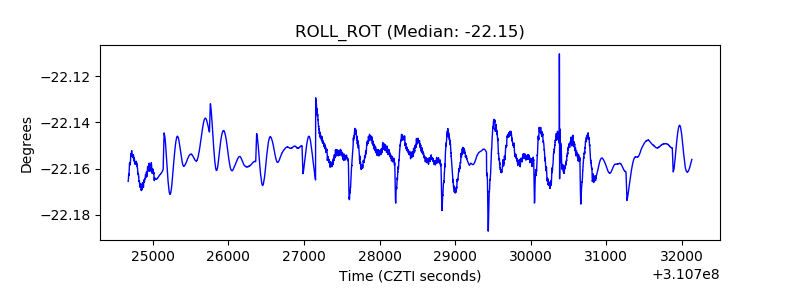 |
| _Roll_DEC |  |
| _Roll_RA | 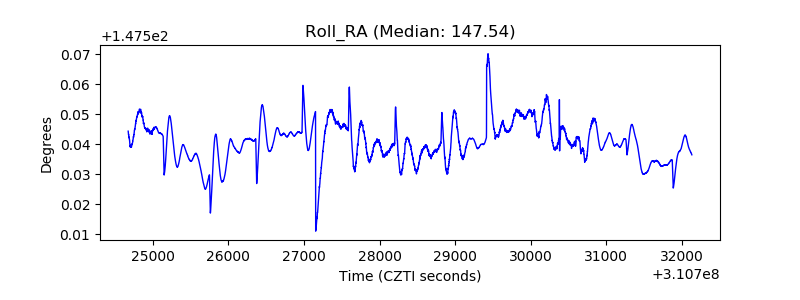 |
| Veto Counter | 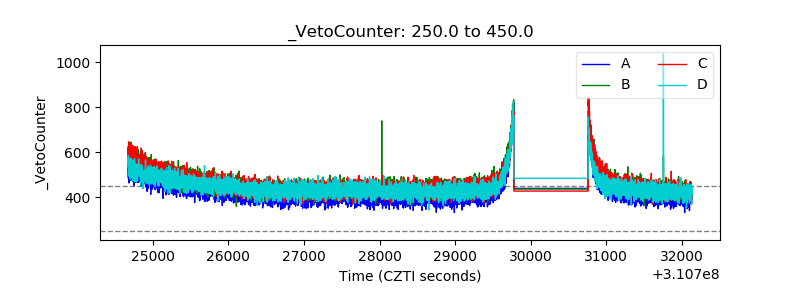 |