| Param | Original file | Final file |
|---|---|---|
| Filename | modeM0/AS1A07_065T01_9000003284_22207cztM0_level2.evt | modeM0/AS1A07_065T01_9000003284_22207cztM0_level2_quad_clean.evt |
| Size (bytes) | 434,465,280 | 86,037,120 |
| Size | 414.3 MB | 82.1 MB |
| Events in quadrant A | 3,117,915 | 545,327 |
| Events in quadrant B | 3,181,057 | 552,720 |
| Events in quadrant C | 3,144,763 | 526,339 |
| Events in quadrant D | 3,264,809 | 520,339 |
| Mode SS | |||
|---|---|---|---|
| Quadrant | BADHDUFLAG | Total packets | Discarded packets |
| A | 0 | 134 | 0 |
| B | 0 | 134 | 0 |
| C | 0 | 134 | 0 |
| D | 0 | 134 | 0 |
| Mode M9 | |||
|---|---|---|---|
| Quadrant | BADHDUFLAG | Total packets | Discarded packets |
| A | 0 | 7 | 0 |
| B | 0 | 7 | 0 |
| C | 0 | 7 | 0 |
| D | 0 | 7 | 0 |
| Mode M0 | |||
|---|---|---|---|
| Quadrant | BADHDUFLAG | Total packets | Discarded packets |
| A | 0 | 13419 | 2 |
| B | 0 | 13477 | 1 |
| C | 0 | 13477 | 1 |
| D | 0 | 14027 | 1 |
| Quadrant | Total seconds | Saturated seconds | Saturation percentage |
|---|---|---|---|
| A | 6606 | 42 | 0.635786% |
| B | 6607 | 40 | 0.605418% |
| C | 6607 | 51 | 0.771909% |
| D | 6607 | 43 | 0.650825% |
Noise dominated data is calculated using 1-second bins in cleaned event files. If a bin has >2000 counts, and if more than 50% of those come from <1% of pixels, then it is considered to be noise-dominated and hence unusable.
| Quadrant | # 1 sec bins | Bins with >0 counts | Bins with >2000 counts | High rate bins dominated by noise | Noise dominated (total time) | Noise dominated (detector-on time) | Marked lightcurve |
|---|---|---|---|---|---|---|---|
| A | 7286 | 6607 | 0 | 0 | 0.00% | 0.00% | 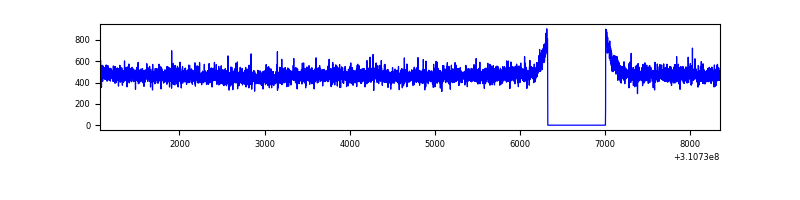 |
| B | 7287 | 6608 | 1 | 1 | 0.01% | 0.02% | 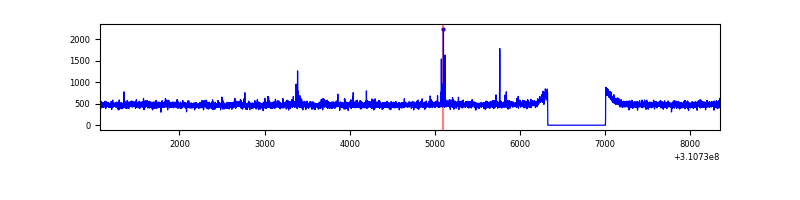 |
| C | 7287 | 6608 | 2 | 2 | 0.03% | 0.03% | 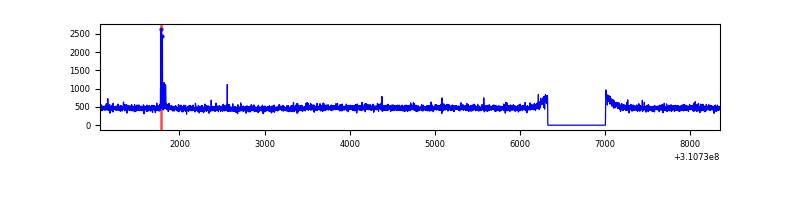 |
| D | 7287 | 6608 | 7 | 7 | 0.10% | 0.11% | 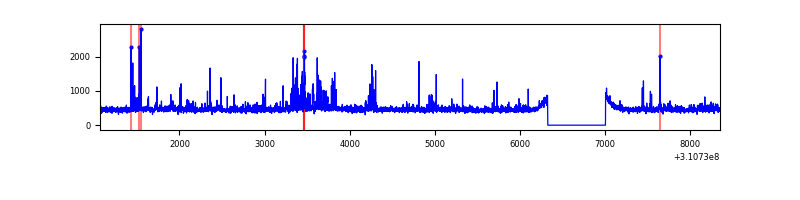 |
Top three noisy pixels from each quadrant. If the there are fewer than three noisy pixels in the level2.evt file, extra rows are filled as -1
| Pixel properties | Quadrant properties | ||||||
|---|---|---|---|---|---|---|---|
| Quadrant | DetID | PixID | Counts | Sigma | Mean | Median | Sigma |
| A | 13 | 254 | 11684 | 66.55 | 808 | 792 | 163.7 |
| A | 0 | 226 | 6984 | 37.83 | 808 | 792 | 163.7 |
| A | 3 | 137 | 6918 | 37.43 | 808 | 792 | 163.7 |
| B | 12 | 111 | 18825 | 117.85 | 799 | 779 | 153.1 |
| B | 4 | 173 | 18008 | 112.51 | 799 | 779 | 153.1 |
| B | 11 | 111 | 16589 | 103.24 | 799 | 779 | 153.1 |
| C | 14 | 238 | 121285 | 667.97 | 769 | 774 | 180.4 |
| C | 10 | 22 | 23060 | 123.53 | 769 | 774 | 180.4 |
| C | 13 | 61 | 5411 | 25.7 | 769 | 774 | 180.4 |
| D | 1 | 52 | 148513 | 781.78 | 783 | 760 | 189.0 |
| D | 2 | 136 | 57982 | 302.77 | 783 | 760 | 189.0 |
| D | 15 | 145 | 51944 | 270.82 | 783 | 760 | 189.0 |
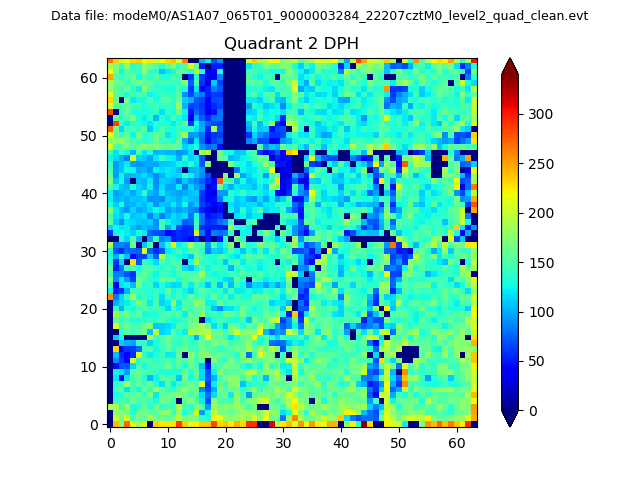
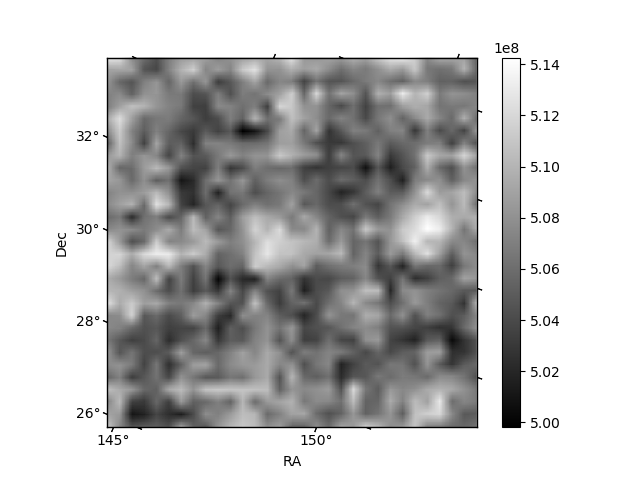
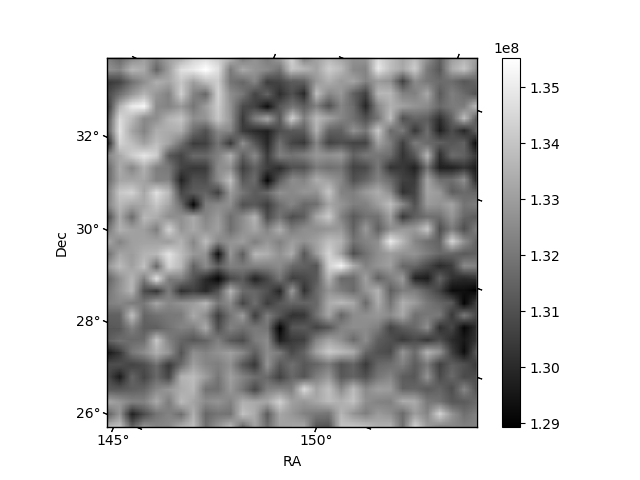
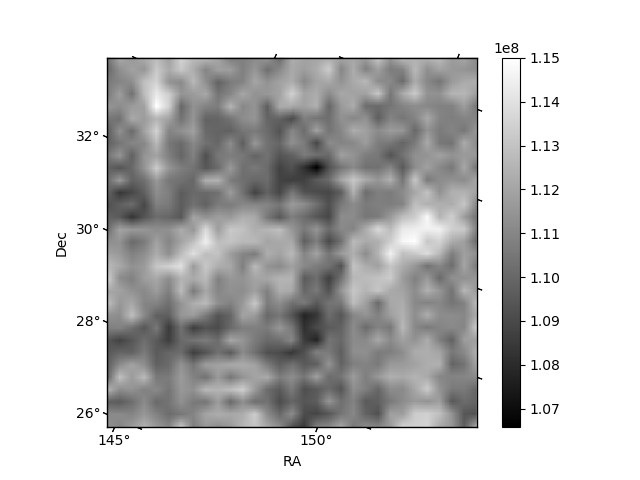
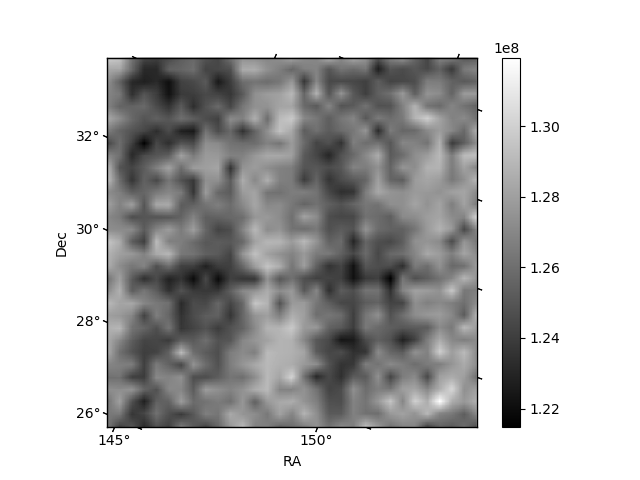
Histogram calculated using DETX and DETY for each event in the final _common_clean file
| Quadrant A | 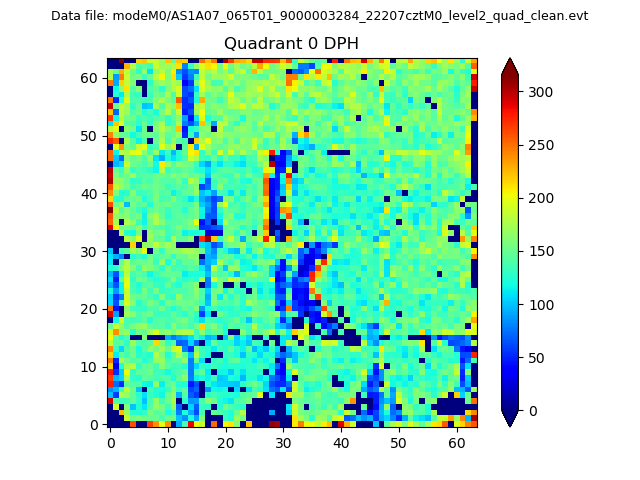 |
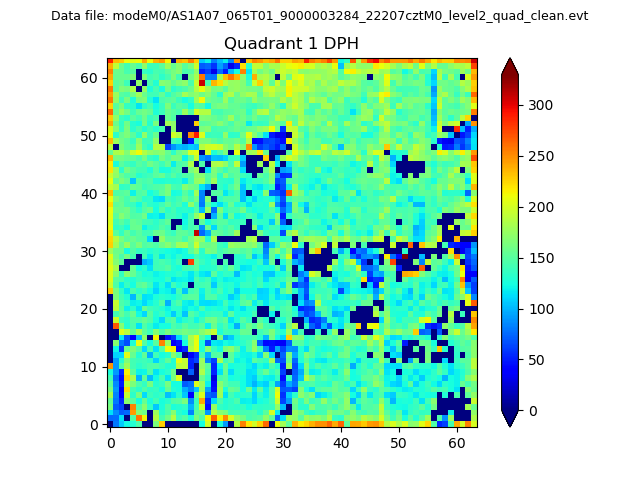 |
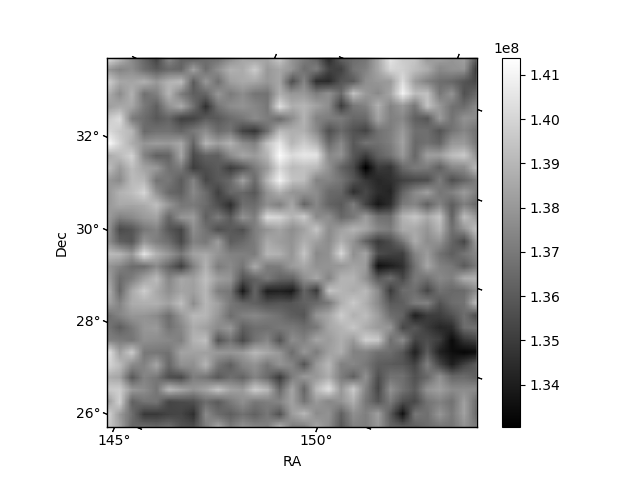
Quadrant B |
|---|---|---|---|
| Quadrant D | 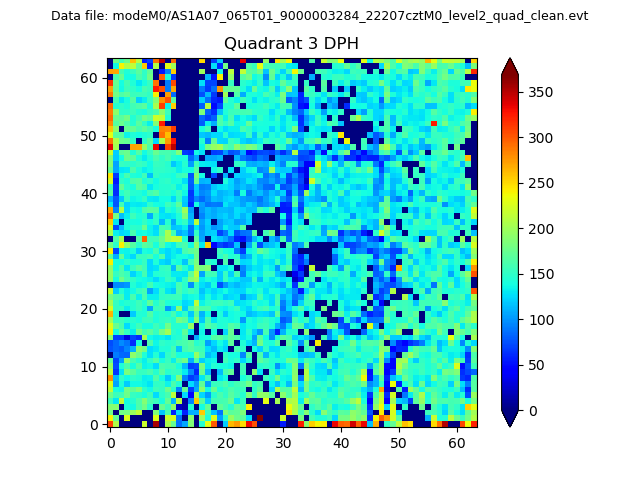 |
 |
Quadrant C |
| Plot type | Count rate plots | Images |
|---|---|---|
| Comparison with Poisson distribution Blue bars denote a histogram of data divided into 1 sec bins. Red curve is a Poisson curve with rate = median count rate of data. |
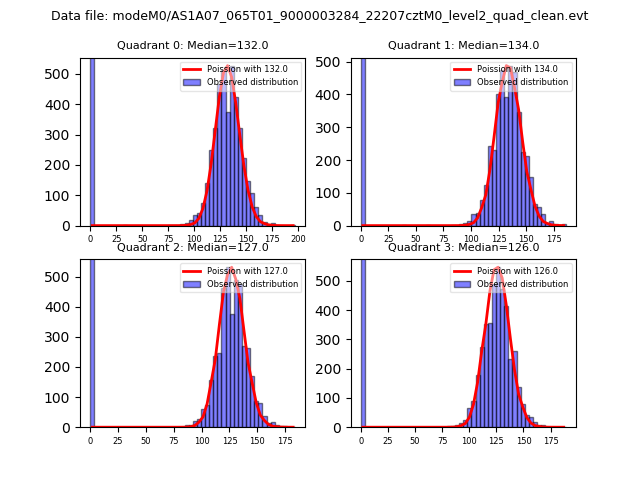 |
 |
| Quadrant-wise count rates Data is divided into 100 sec bins |
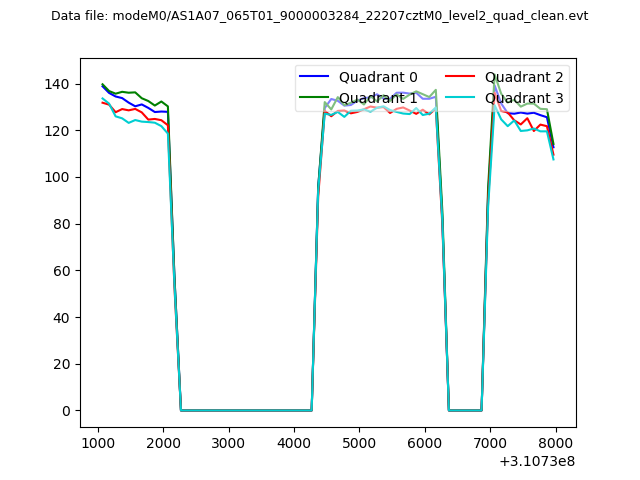 |
|
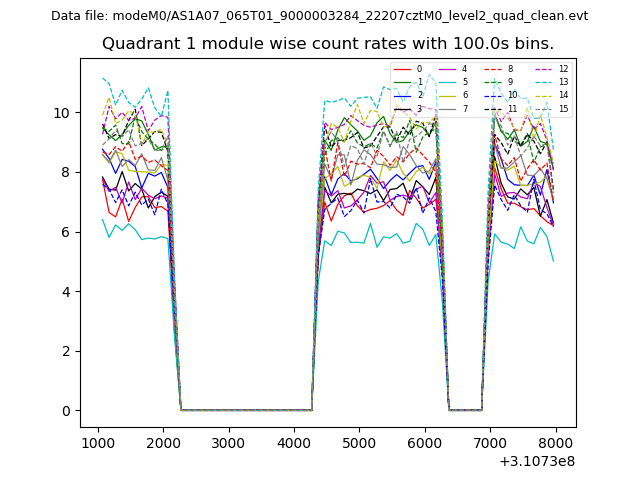
| Module-wise count rates for Quadrant A Data is divided into 100 sec bins |
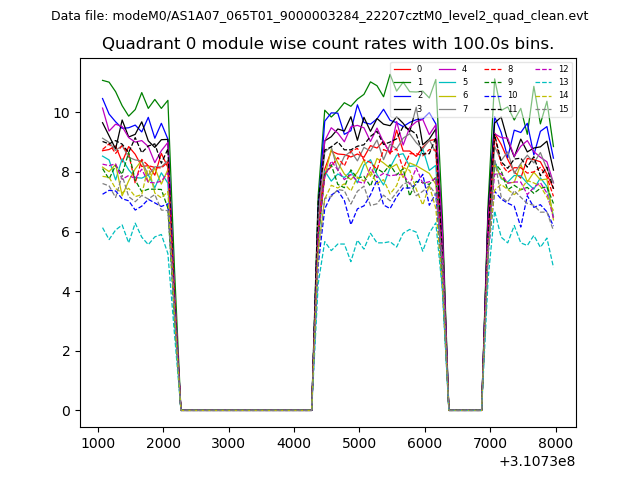 |
 |
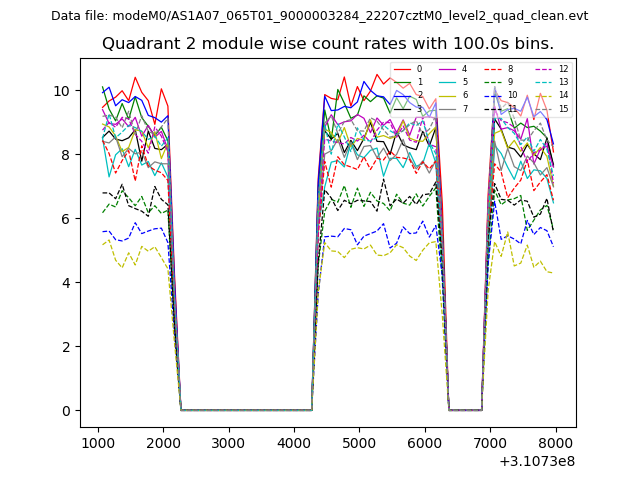
| Module-wise count rates for Quadrant B Data is divided into 100 sec bins |
 |
 |
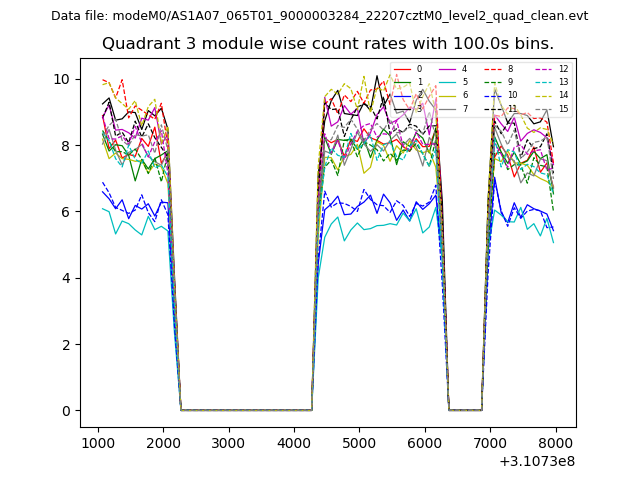
| Module-wise count rates for Quadrant C Data is divided into 100 sec bins |
 |
 |
| Module-wise count rates for Quadrant D Data is divided into 100 sec bins |
 |
 |
| Parameter | Plot |
|---|---|
| CZT HV Monitor | 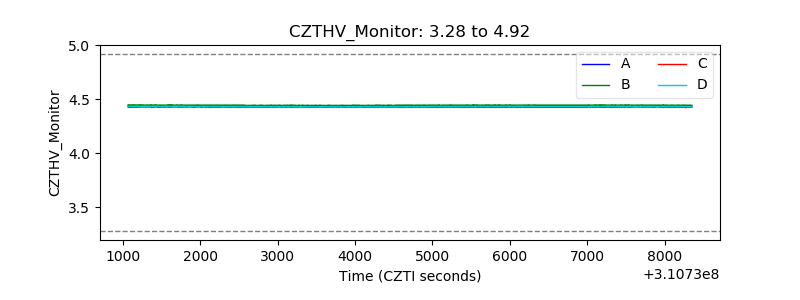 |
| D_VDD | 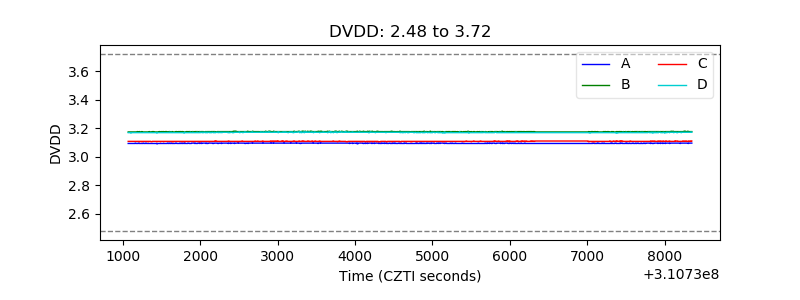 |
| Temperature 1 | 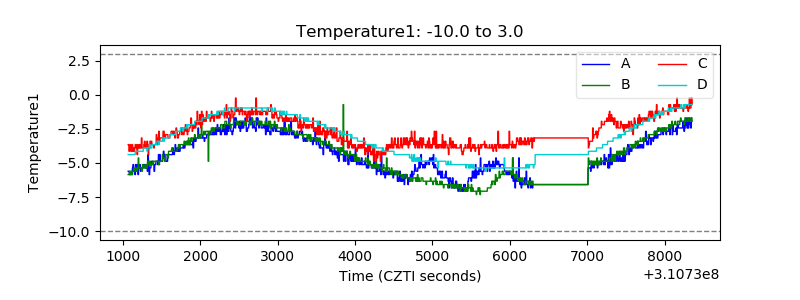 |
| Veto HV Monitor | 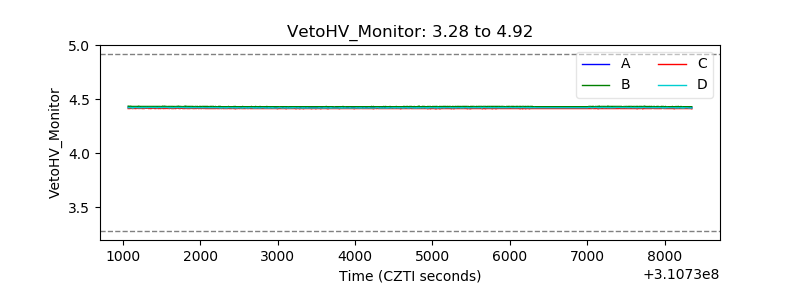 |
| Veto LLD | 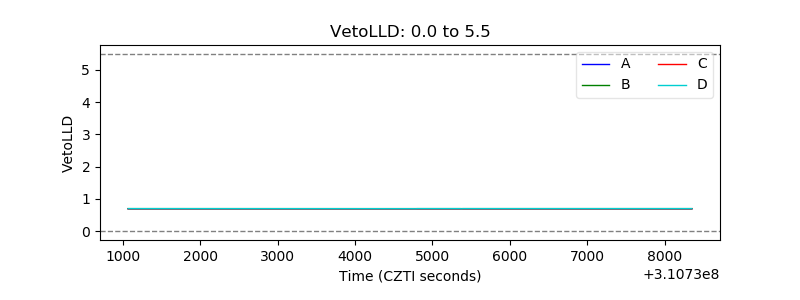 |
| Alpha Counter | 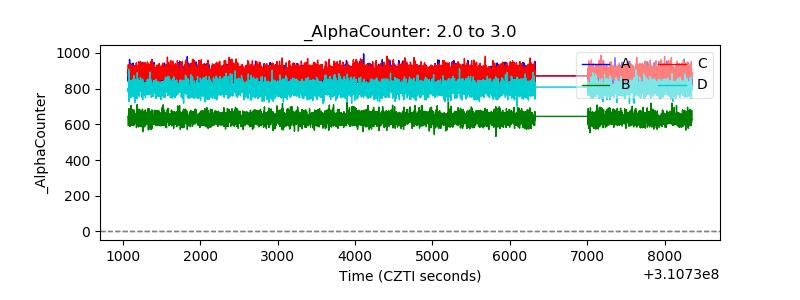 |
| _CPM_Rate | 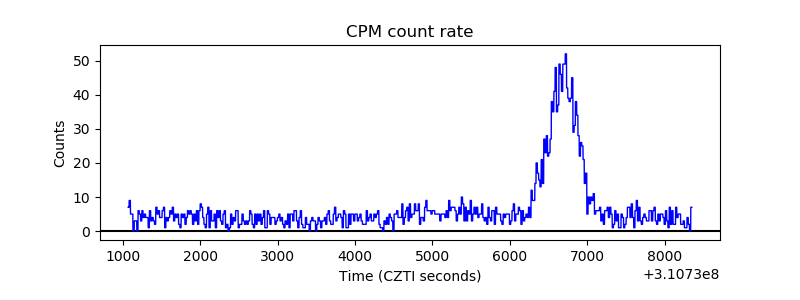 |
| CZT Counter | 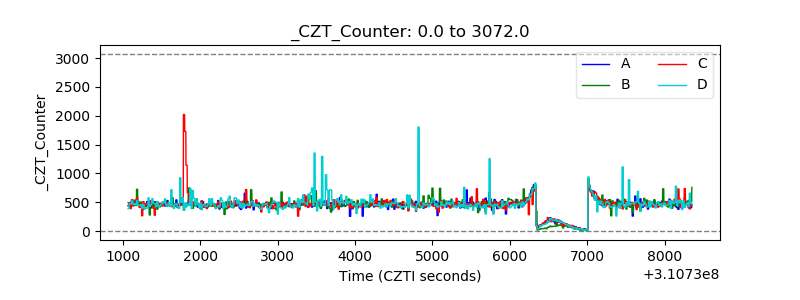 |
| +2.5 Volts monitor |  |
| +5 Volts monitor |  |
| _ROLL_ROT | 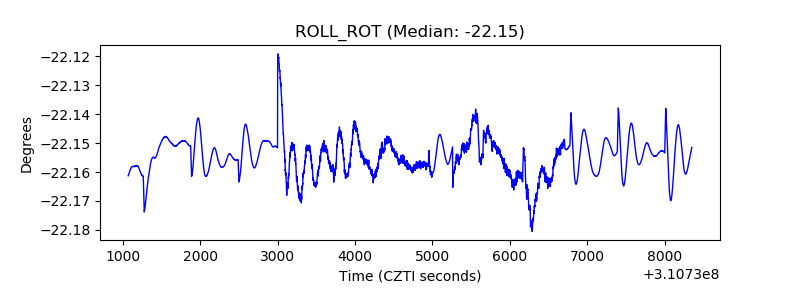 |
| _Roll_DEC | 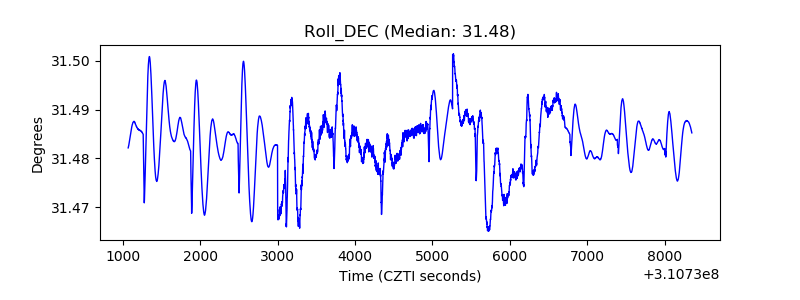 |
| _Roll_RA | 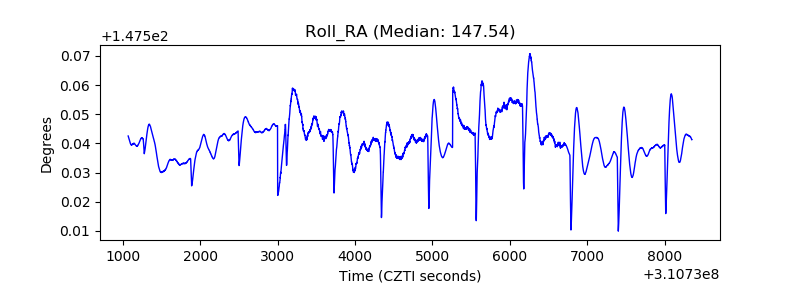 |
| Veto Counter |  |