| Param | Original file | Final file |
|---|---|---|
| Filename | modeM0/AS1A07_134T02_9000003282cztM0_level2.fits | modeM0/AS1A07_134T02_9000003282cztM0_level2_quad_clean.evt |
| Size (bytes) | 162,368,640 | 127,215,360 |
| Size | 154.8 MB | 121.3 MB |
| Events in quadrant A | 1,003,544 | 712,155 |
| Events in quadrant B | 950,994 | 703,534 |
| Events in quadrant C | 970,432 | 665,493 |
| Events in quadrant D | 842,406 | 620,790 |
| Mode SS | |||
|---|---|---|---|
| Quadrant | BADHDUFLAG | Total packets | Discarded packets |
| A | 0 | 342 | 0 |
| B | 0 | 342 | 0 |
| C | 0 | 342 | 0 |
| D | 0 | 342 | 0 |
| Mode M0 | |||
|---|---|---|---|
| Quadrant | BADHDUFLAG | Total packets | Discarded packets |
| A | 0 | 34860 | 0 |
| B | 0 | 35430 | 0 |
| C | 0 | 34782 | 0 |
| D | 0 | 43693 | 0 |
| Mode M9 | |||
|---|---|---|---|
| Quadrant | BADHDUFLAG | Total packets | Discarded packets |
| A | 0 | 18 | 0 |
| B | 0 | 18 | 0 |
| C | 0 | 18 | 0 |
| D | 0 | 18 | 0 |
| Quadrant | Total seconds | Saturated seconds | Saturation percentage |
|---|---|---|---|
| A | 16672 | 349 | 2.093330% |
| B | 16672 | 422 | 2.531190% |
| C | 16671 | 493 | 2.957231% |
| D | 16671 | 782 | 4.690780% |
Noise dominated data is calculated using 1-second bins in cleaned event files. If a bin has >2000 counts, and if more than 50% of those come from <1% of pixels, then it is considered to be noise-dominated and hence unusable.
| Quadrant | # 1 sec bins | Bins with >0 counts | Bins with >2000 counts | High rate bins dominated by noise | Noise dominated (total time) | Noise dominated (detector-on time) | Marked lightcurve |
|---|---|---|---|---|---|---|---|
| A | 22224 | 16673 | 0 | 0 | 0.00% | 0.00% |  |
| B | 22224 | 16672 | 0 | 0 | 0.00% | 0.00% | 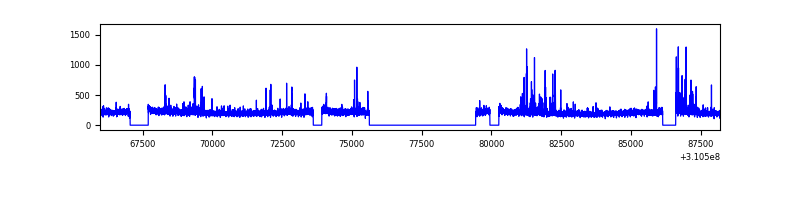 |
| C | 22223 | 16672 | 0 | 0 | 0.00% | 0.00% |  |
| D | 22223 | 16666 | 0 | 0 | 0.00% | 0.00% |  |
Top three noisy pixels from each quadrant. If the there are fewer than three noisy pixels in the level2.evt file, extra rows are filled as -1
| Pixel properties | Quadrant properties | ||||||
|---|---|---|---|---|---|---|---|
| Quadrant | DetID | PixID | Counts | Sigma | Mean | Median | Sigma |
| A | 0 | 29 | 923 | 10.09 | 260 | 243 | 67.4 |
| A | 7 | 110 | 850 | 9.01 | 260 | 243 | 67.4 |
| A | 0 | 30 | 792 | 8.15 | 260 | 243 | 67.4 |
| B | 2 | 9 | 744 | 9.67 | 251 | 239 | 52.2 |
| B | 5 | 232 | 656 | 7.99 | 251 | 239 | 52.2 |
| B | 5 | 225 | 647 | 7.81 | 251 | 239 | 52.2 |
| C | 12 | 241 | 688 | 6.75 | 255 | 237 | 66.8 |
| C | 3 | 234 | 681 | 6.64 | 255 | 237 | 66.8 |
| C | 3 | 126 | 666 | 6.42 | 255 | 237 | 66.8 |
| D | 6 | 231 | 654 | 6.64 | 240 | 218 | 65.6 |
| D | 13 | 238 | 640 | 6.43 | 240 | 218 | 65.6 |
| D | 3 | 14 | 622 | 6.16 | 240 | 218 | 65.6 |
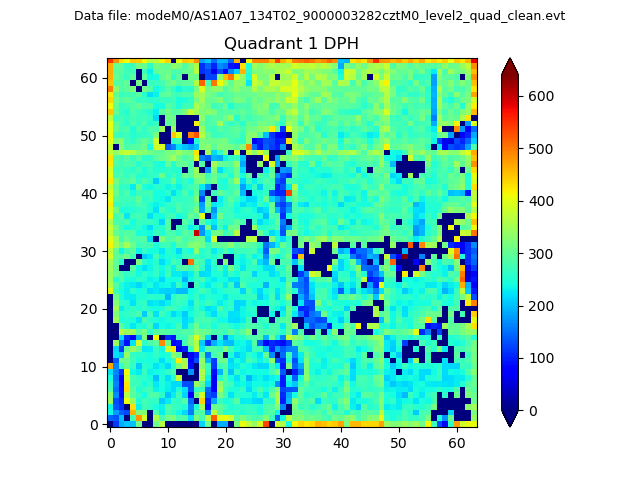
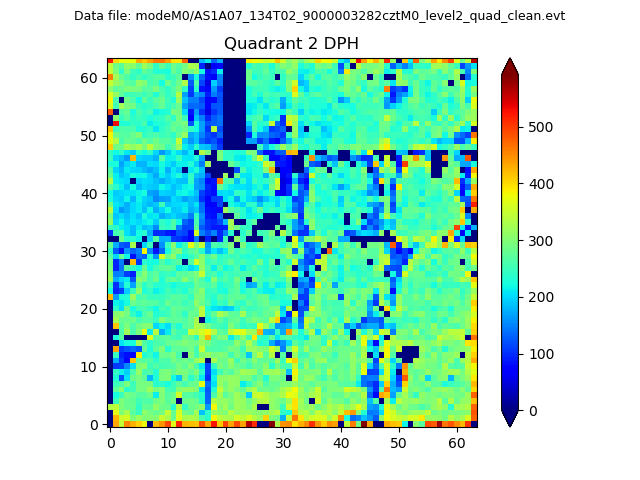
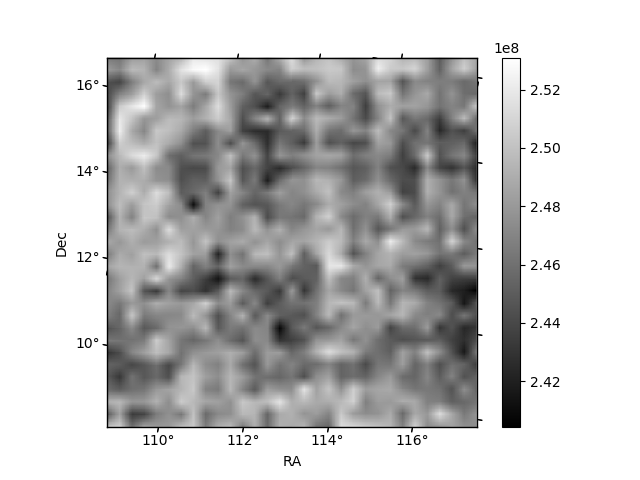
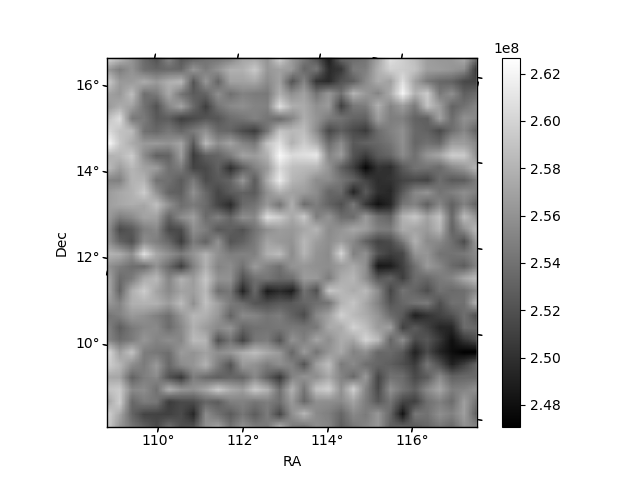
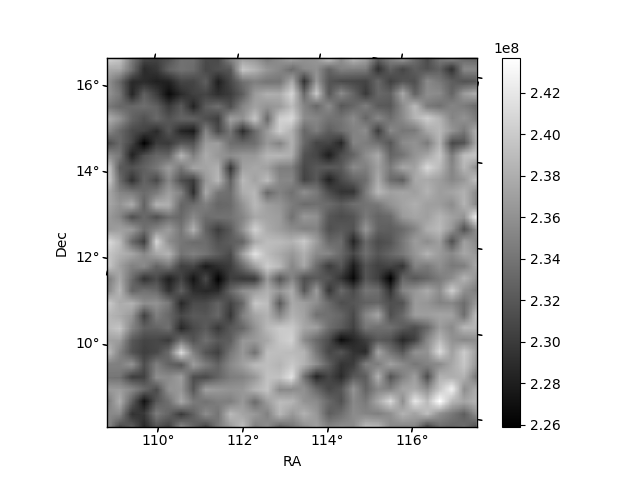
Histogram calculated using DETX and DETY for each event in the final _common_clean file
| Quadrant A |  |
 |
Quadrant B |
|---|---|---|---|
| Quadrant D | 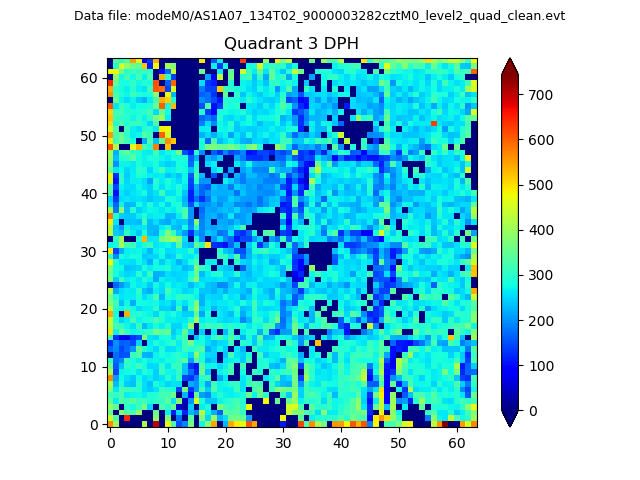 |
 |
Quadrant C |
| Plot type | Count rate plots | Images |
|---|---|---|
| Comparison with Poisson distribution Blue bars denote a histogram of data divided into 1 sec bins. Red curve is a Poisson curve with rate = median count rate of data. |
 |
 |
| Quadrant-wise count rates Data is divided into 100 sec bins |
 |
|
| Module-wise count rates for Quadrant A Data is divided into 100 sec bins |
 |
 |
| Module-wise count rates for Quadrant B Data is divided into 100 sec bins |
 |
 |
| Module-wise count rates for Quadrant C Data is divided into 100 sec bins |
 |
 |
| Module-wise count rates for Quadrant D Data is divided into 100 sec bins |
 |
 |
| Parameter | Plot |
|---|---|
| CZT HV Monitor |  |
| D_VDD | 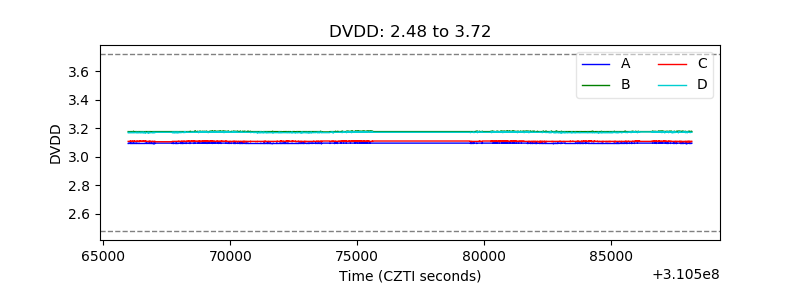 |
| Temperature 1 |  |
| Veto HV Monitor |  |
| Veto LLD |  |
| Alpha Counter |  |
| _CPM_Rate | 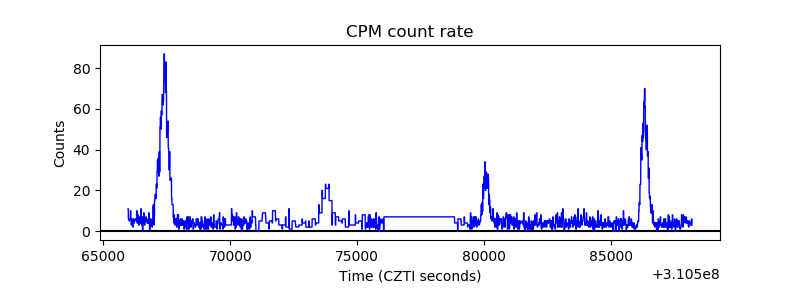 |
| CZT Counter |  |
| +2.5 Volts monitor |  |
| +5 Volts monitor |  |
| _ROLL_ROT |  |
| _Roll_DEC | 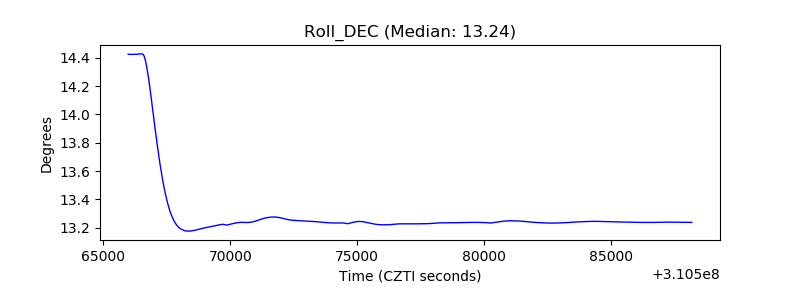 |
| _Roll_RA |  |
| Veto Counter | 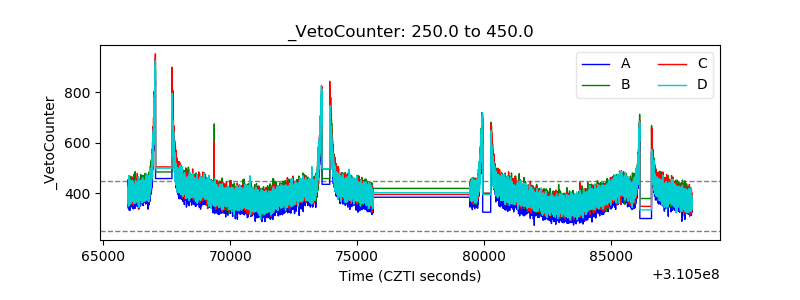 |