| Param | Original file | Final file |
|---|---|---|
| Filename | modeM0/AS1A07_134T02_9000003282_22179cztM0_level2.evt | modeM0/AS1A07_134T02_9000003282_22179cztM0_level2_quad_clean.evt |
| Size (bytes) | 543,507,840 | 80,064,000 |
| Size | 518.3 MB | 76.4 MB |
| Events in quadrant A | 3,767,528 | 484,357 |
| Events in quadrant B | 3,885,446 | 485,917 |
| Events in quadrant C | 3,757,388 | 462,793 |
| Events in quadrant D | 4,532,429 | 461,357 |
| Mode SS | |||
|---|---|---|---|
| Quadrant | BADHDUFLAG | Total packets | Discarded packets |
| A | 0 | 154 | 0 |
| B | 0 | 154 | 0 |
| C | 0 | 154 | 0 |
| D | 0 | 154 | 0 |
| Mode M0 | |||
|---|---|---|---|
| Quadrant | BADHDUFLAG | Total packets | Discarded packets |
| A | 0 | 15958 | 2 |
| B | 0 | 16157 | 2 |
| C | 0 | 15899 | 2 |
| D | 0 | 18527 | 2 |
| Mode M9 | |||
|---|---|---|---|
| Quadrant | BADHDUFLAG | Total packets | Discarded packets |
| A | 0 | 4 | 0 |
| B | 0 | 5 | 0 |
| C | 0 | 5 | 0 |
| D | 0 | 5 | 0 |
| Quadrant | Total seconds | Saturated seconds | Saturation percentage |
|---|---|---|---|
| A | 7620 | 157 | 2.060367% |
| B | 7619 | 185 | 2.428140% |
| C | 7619 | 227 | 2.979394% |
| D | 7619 | 350 | 4.593779% |
Noise dominated data is calculated using 1-second bins in cleaned event files. If a bin has >2000 counts, and if more than 50% of those come from <1% of pixels, then it is considered to be noise-dominated and hence unusable.
| Quadrant | # 1 sec bins | Bins with >0 counts | Bins with >2000 counts | High rate bins dominated by noise | Noise dominated (total time) | Noise dominated (detector-on time) | Marked lightcurve |
|---|---|---|---|---|---|---|---|
| A | 7925 | 7621 | 0 | 0 | 0.00% | 0.00% | 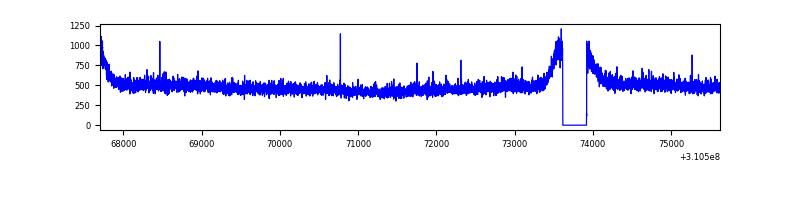 |
| B | 7924 | 7620 | 0 | 0 | 0.00% | 0.00% | 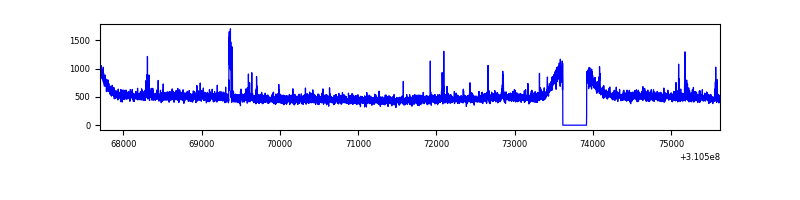 |
| C | 7924 | 7620 | 0 | 0 | 0.00% | 0.00% | 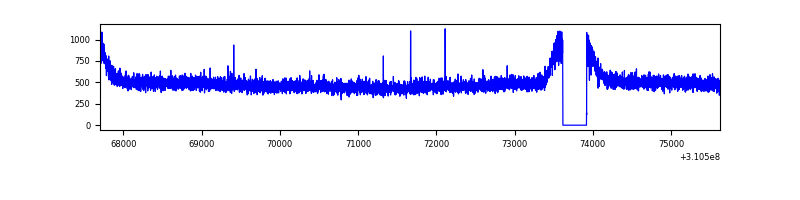 |
| D | 7924 | 7620 | 192 | 192 | 2.42% | 2.52% | 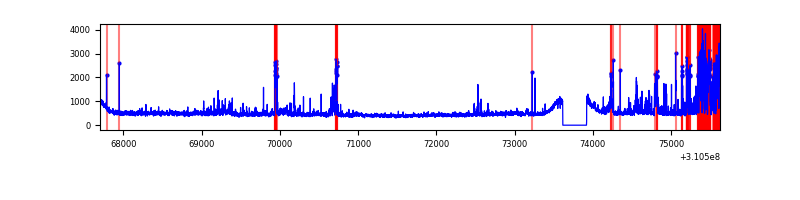 |
Top three noisy pixels from each quadrant. If the there are fewer than three noisy pixels in the level2.evt file, extra rows are filled as -1
| Pixel properties | Quadrant properties | ||||||
|---|---|---|---|---|---|---|---|
| Quadrant | DetID | PixID | Counts | Sigma | Mean | Median | Sigma |
| A | 13 | 254 | 13925 | 65.59 | 976 | 955 | 197.7 |
| A | 3 | 137 | 8480 | 38.05 | 976 | 955 | 197.7 |
| A | 0 | 226 | 8297 | 37.13 | 976 | 955 | 197.7 |
| B | 0 | 190 | 52697 | 276.46 | 963 | 939 | 187.2 |
| B | 0 | 219 | 28253 | 145.9 | 963 | 939 | 187.2 |
| B | 12 | 111 | 22674 | 116.1 | 963 | 939 | 187.2 |
| C | 14 | 238 | 145419 | 658.34 | 926 | 931 | 219.5 |
| C | 13 | 61 | 6384 | 24.84 | 926 | 931 | 219.5 |
| C | 15 | 78 | 2284 | 6.16 | 926 | 931 | 219.5 |
| D | 1 | 52 | 714387 | 3077.01 | 943 | 916 | 231.9 |
| D | 13 | 172 | 117337 | 502.09 | 943 | 916 | 231.9 |
| D | 12 | 217 | 41512 | 175.08 | 943 | 916 | 231.9 |
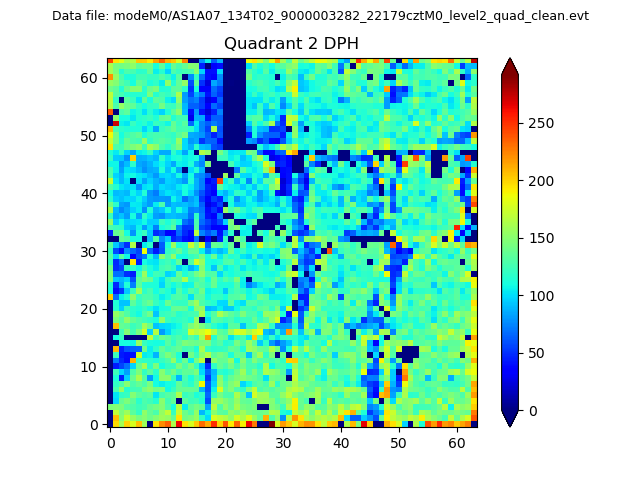
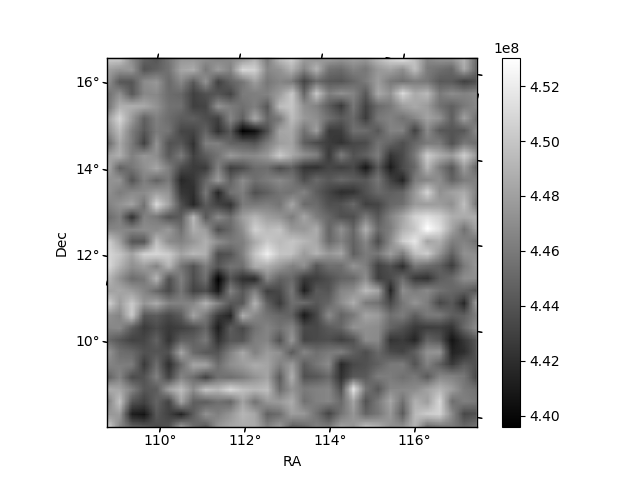
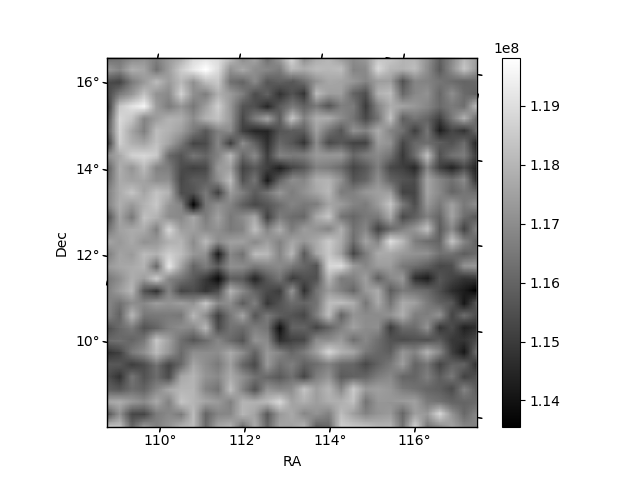
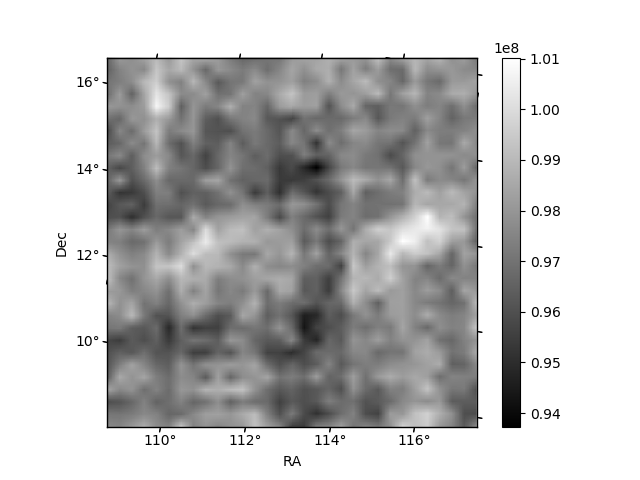
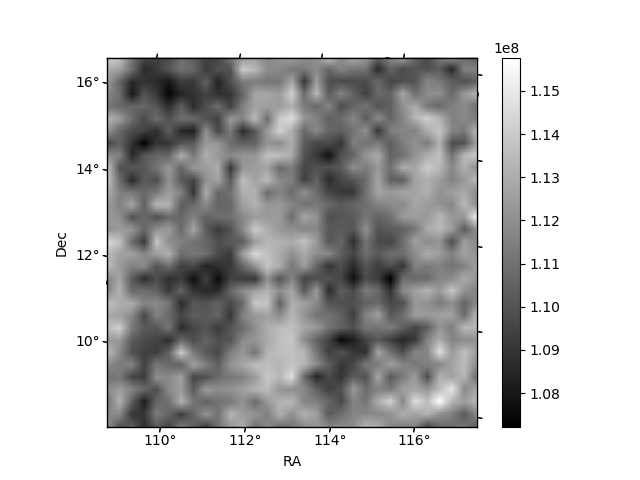
Histogram calculated using DETX and DETY for each event in the final _common_clean file
| Quadrant A | 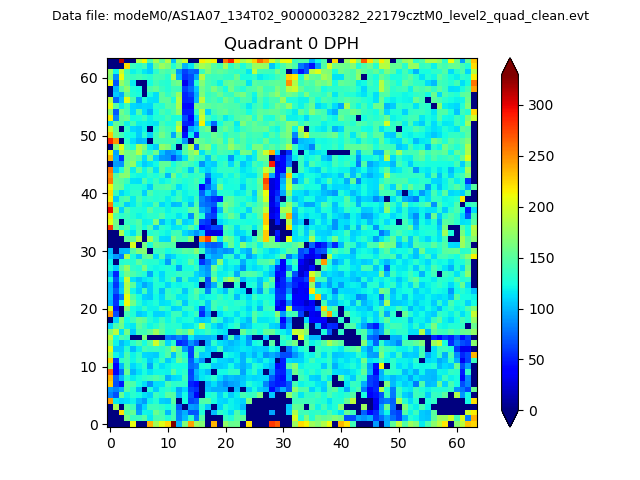 |
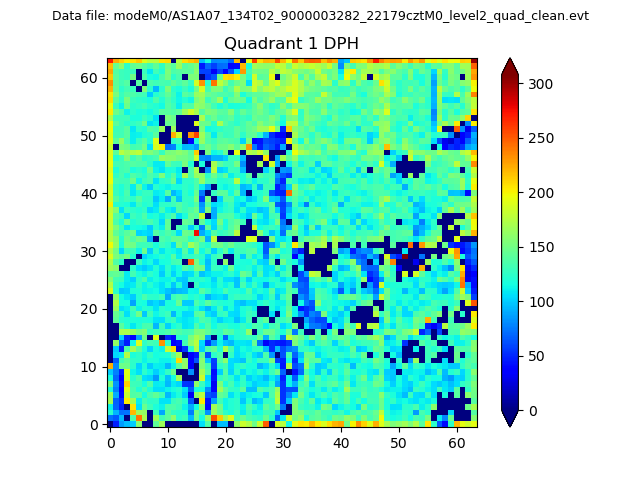 |
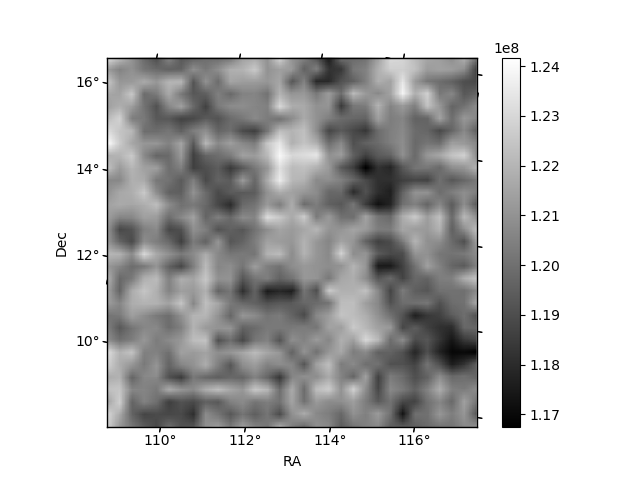
Quadrant B |
|---|---|---|---|
| Quadrant D | 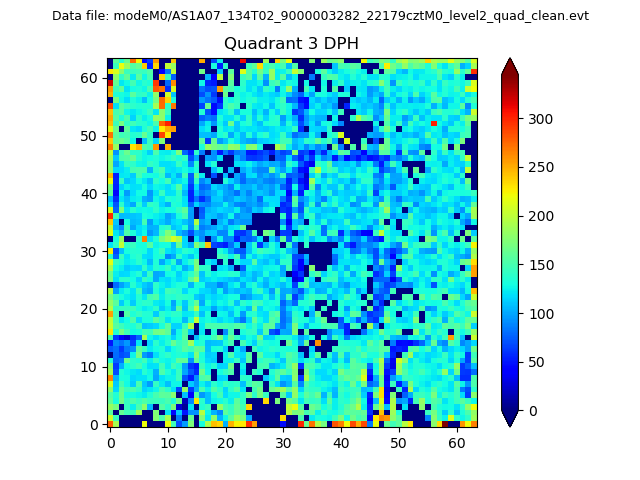 |
 |
Quadrant C |
| Plot type | Count rate plots | Images |
|---|---|---|
| Comparison with Poisson distribution Blue bars denote a histogram of data divided into 1 sec bins. Red curve is a Poisson curve with rate = median count rate of data. |
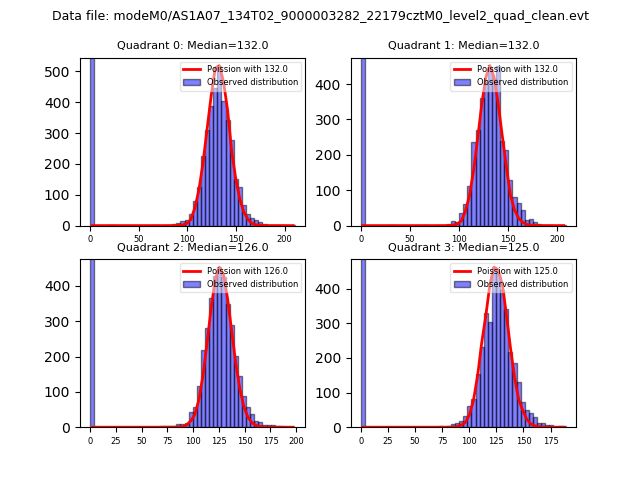 |
 |
| Quadrant-wise count rates Data is divided into 100 sec bins |
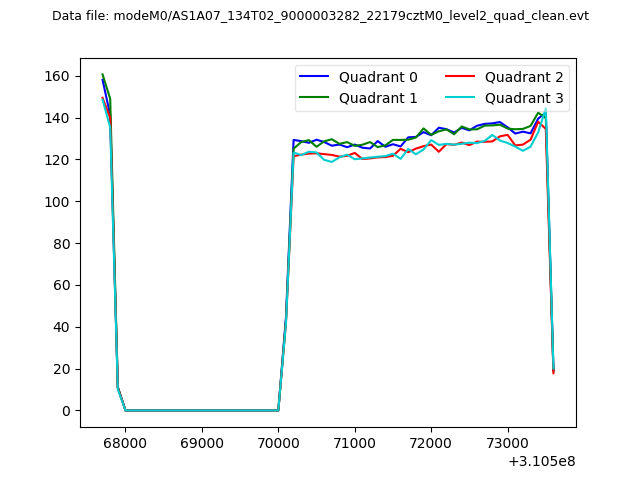 |
|
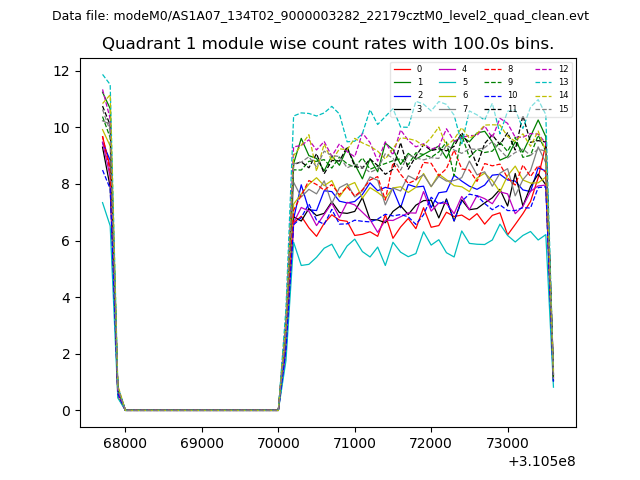
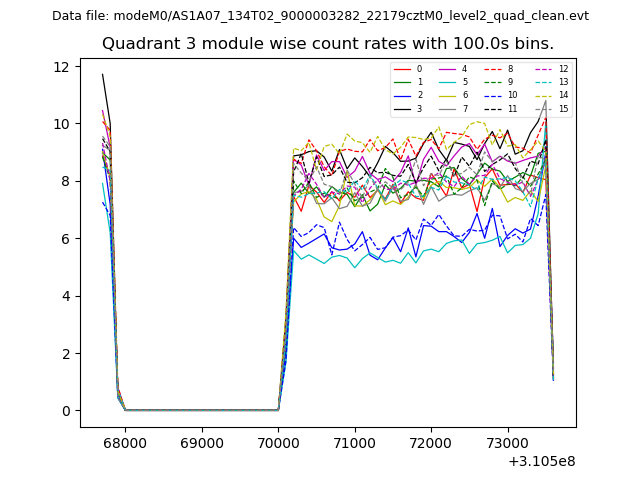
| Module-wise count rates for Quadrant A Data is divided into 100 sec bins |
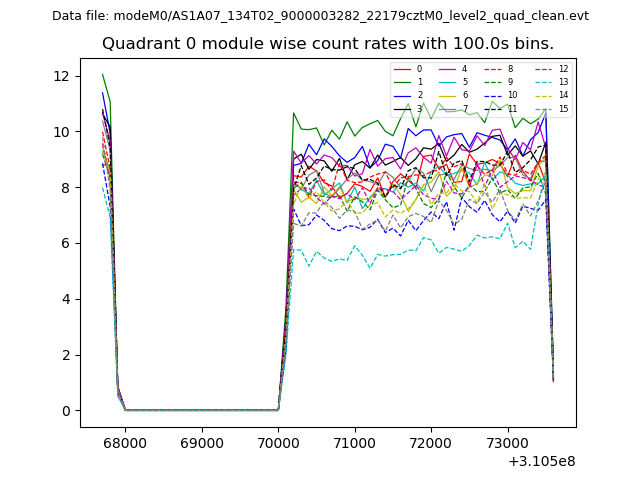 |
 |
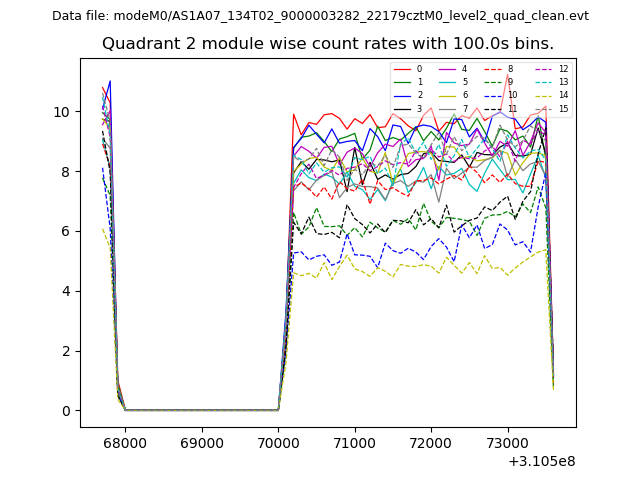
| Module-wise count rates for Quadrant B Data is divided into 100 sec bins |
 |
 |
| Module-wise count rates for Quadrant C Data is divided into 100 sec bins |
 |
 |
| Module-wise count rates for Quadrant D Data is divided into 100 sec bins |
 |
 |
| Parameter | Plot |
|---|---|
| CZT HV Monitor | 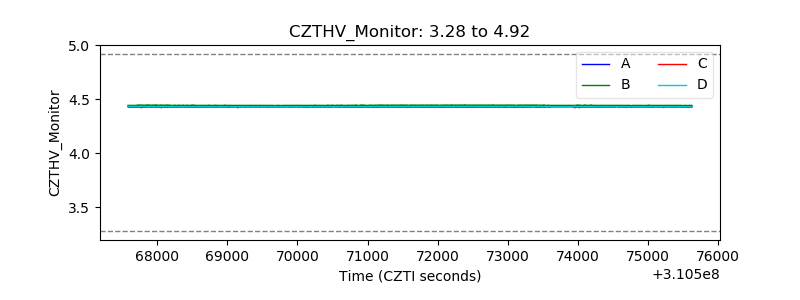 |
| D_VDD | 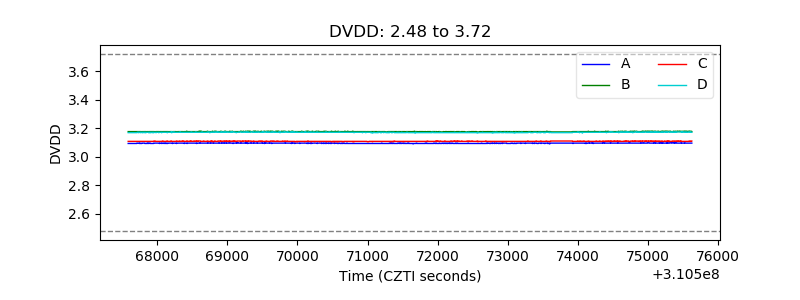 |
| Temperature 1 | 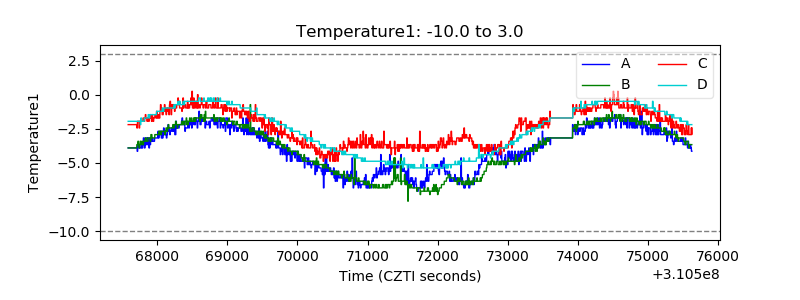 |
| Veto HV Monitor | 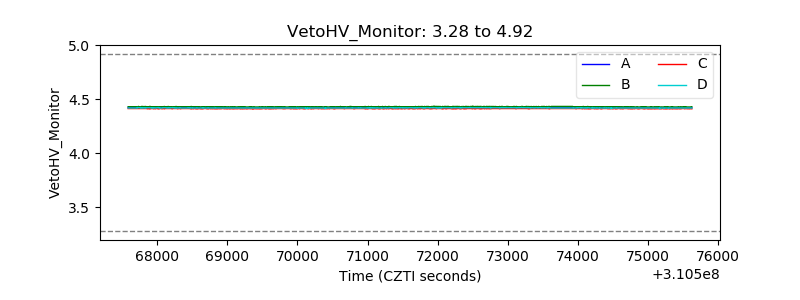 |
| Veto LLD | 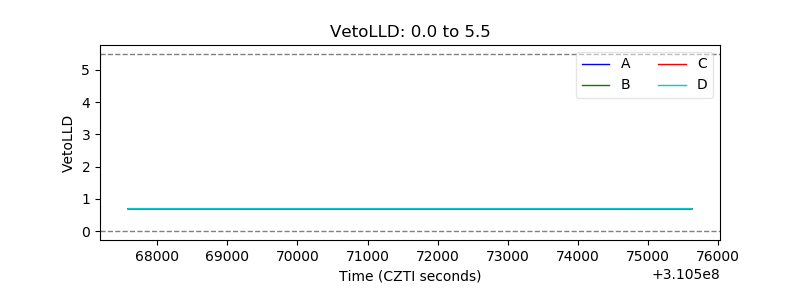 |
| Alpha Counter | 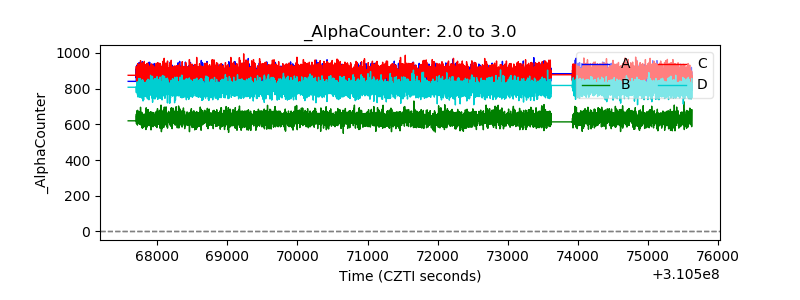 |
| _CPM_Rate | 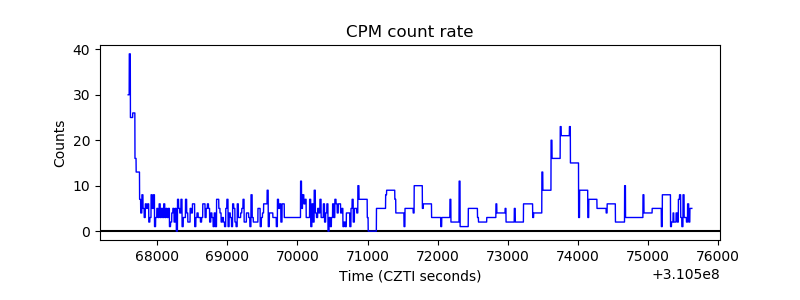 |
| CZT Counter | 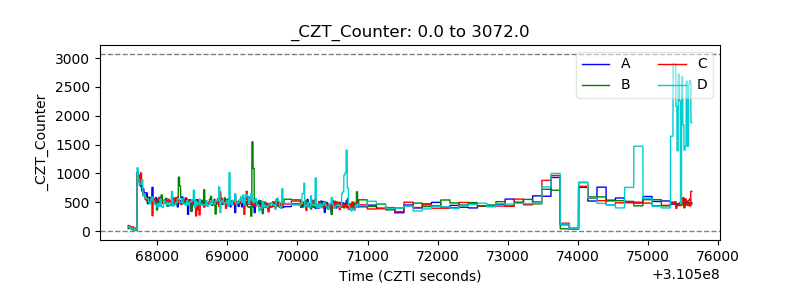 |
| +2.5 Volts monitor | 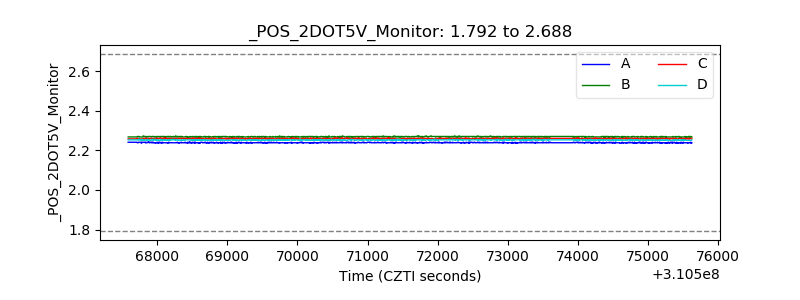 |
| +5 Volts monitor | 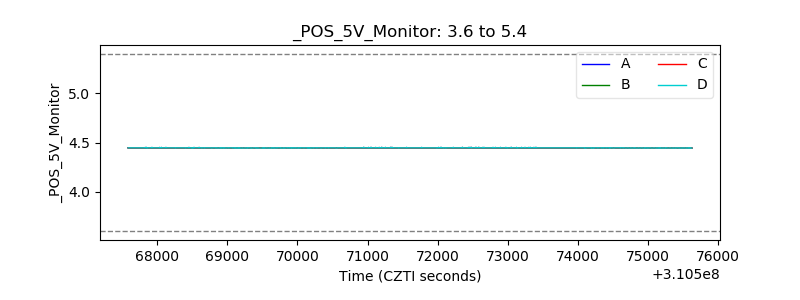 |
| _ROLL_ROT | 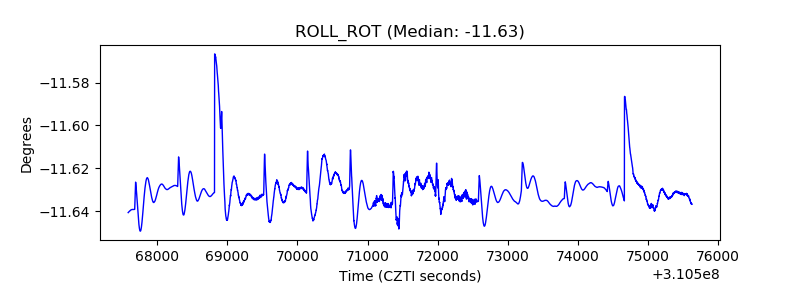 |
| _Roll_DEC |  |
| _Roll_RA | 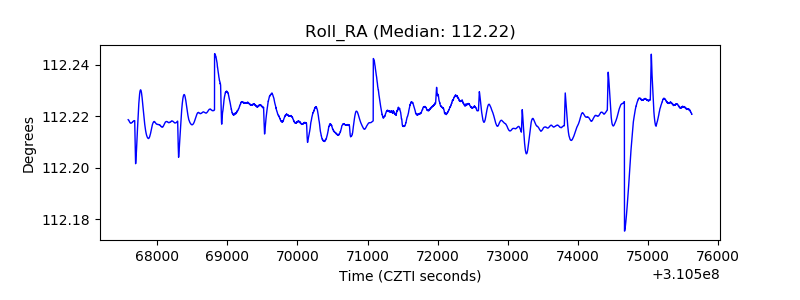 |
| Veto Counter | 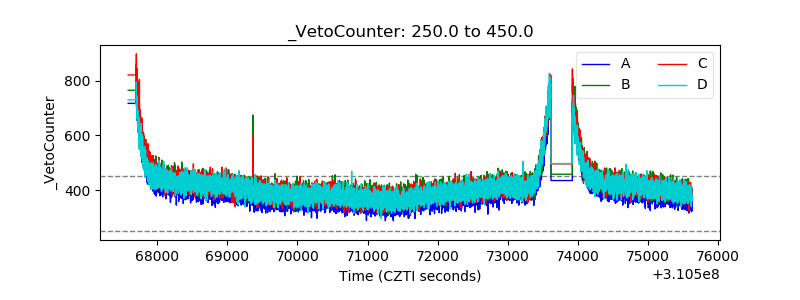 |