| Param | Original file | Final file |
|---|---|---|
| Filename | modeM0/AS1A07_134T02_9000003282_22181cztM0_level2.evt | modeM0/AS1A07_134T02_9000003282_22181cztM0_level2_quad_clean.evt |
| Size (bytes) | 597,337,920 | 87,312,960 |
| Size | 569.7 MB | 83.3 MB |
| Events in quadrant A | 3,859,262 | 535,447 |
| Events in quadrant B | 4,005,597 | 536,387 |
| Events in quadrant C | 3,869,762 | 513,197 |
| Events in quadrant D | 5,814,934 | 504,501 |
| Mode SS | |||
|---|---|---|---|
| Quadrant | BADHDUFLAG | Total packets | Discarded packets |
| A | 0 | 164 | 0 |
| B | 0 | 164 | 0 |
| C | 0 | 164 | 0 |
| D | 0 | 164 | 0 |
| Mode M0 | |||
|---|---|---|---|
| Quadrant | BADHDUFLAG | Total packets | Discarded packets |
| A | 0 | 16531 | 2 |
| B | 0 | 16923 | 2 |
| C | 0 | 16507 | 3 |
| D | 0 | 22778 | 2 |
| Mode M9 | |||
|---|---|---|---|
| Quadrant | BADHDUFLAG | Total packets | Discarded packets |
| A | 0 | 8 | 0 |
| B | 0 | 8 | 0 |
| C | 0 | 8 | 0 |
| D | 0 | 8 | 0 |
| Quadrant | Total seconds | Saturated seconds | Saturation percentage |
|---|---|---|---|
| A | 7973 | 107 | 1.342029% |
| B | 7974 | 147 | 1.843491% |
| C | 7973 | 172 | 2.157281% |
| D | 7973 | 354 | 4.439985% |
Noise dominated data is calculated using 1-second bins in cleaned event files. If a bin has >2000 counts, and if more than 50% of those come from <1% of pixels, then it is considered to be noise-dominated and hence unusable.
| Quadrant | # 1 sec bins | Bins with >0 counts | Bins with >2000 counts | High rate bins dominated by noise | Noise dominated (total time) | Noise dominated (detector-on time) | Marked lightcurve |
|---|---|---|---|---|---|---|---|
| A | 8758 | 7975 | 0 | 0 | 0.00% | 0.00% | 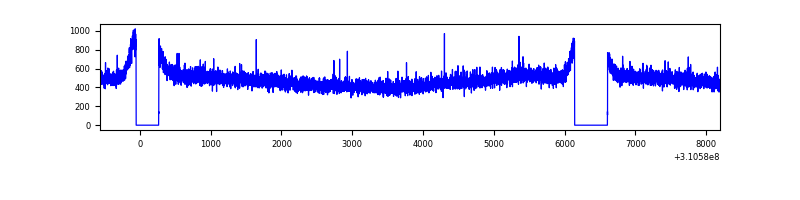 |
| B | 8759 | 7976 | 2 | 2 | 0.02% | 0.03% | 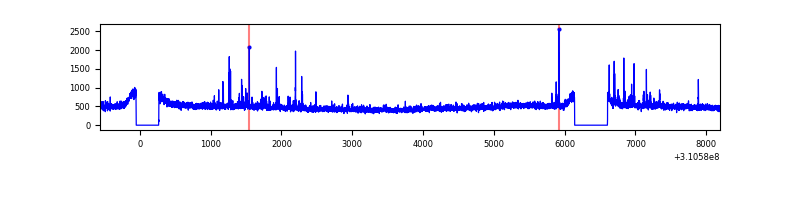 |
| C | 8758 | 7975 | 0 | 0 | 0.00% | 0.00% | 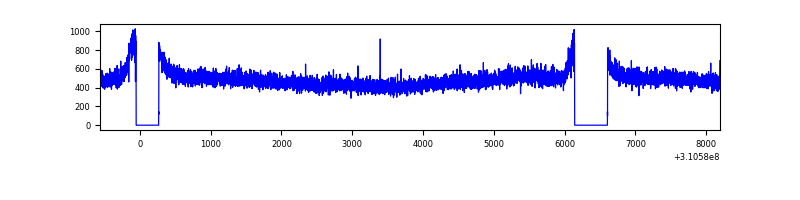 |
| D | 8758 | 7975 | 221 | 221 | 2.52% | 2.77% | 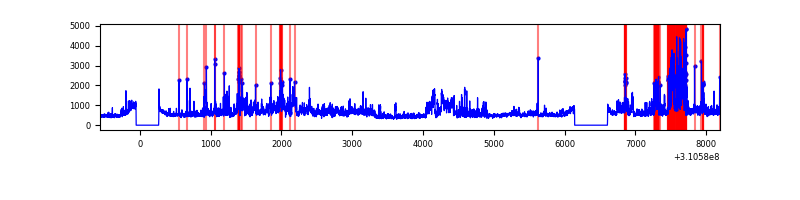 |
Top three noisy pixels from each quadrant. If the there are fewer than three noisy pixels in the level2.evt file, extra rows are filled as -1
| Pixel properties | Quadrant properties | ||||||
|---|---|---|---|---|---|---|---|
| Quadrant | DetID | PixID | Counts | Sigma | Mean | Median | Sigma |
| A | 13 | 254 | 15444 | 71.73 | 999 | 978 | 201.7 |
| A | 3 | 137 | 9007 | 39.81 | 999 | 978 | 201.7 |
| A | 0 | 226 | 8631 | 37.95 | 999 | 978 | 201.7 |
| B | 0 | 245 | 59701 | 305.4 | 990 | 965 | 192.3 |
| B | 5 | 235 | 34468 | 174.2 | 990 | 965 | 192.3 |
| B | 0 | 190 | 24503 | 122.39 | 990 | 965 | 192.3 |
| C | 14 | 238 | 149695 | 663.32 | 953 | 961 | 224.2 |
| C | 13 | 61 | 6517 | 24.78 | 953 | 961 | 224.2 |
| C | 4 | 175 | 2836 | 8.36 | 953 | 961 | 224.2 |
| D | 1 | 52 | 2011847 | 8657.11 | 956 | 928 | 232.3 |
| D | 13 | 172 | 46182 | 194.82 | 956 | 928 | 232.3 |
| D | 7 | 38 | 45380 | 191.37 | 956 | 928 | 232.3 |
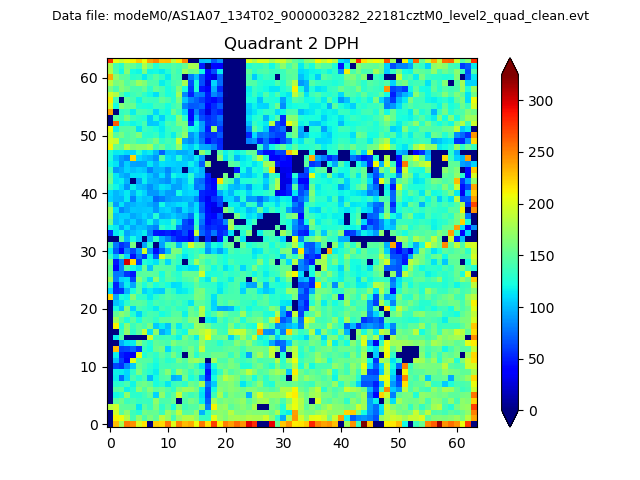
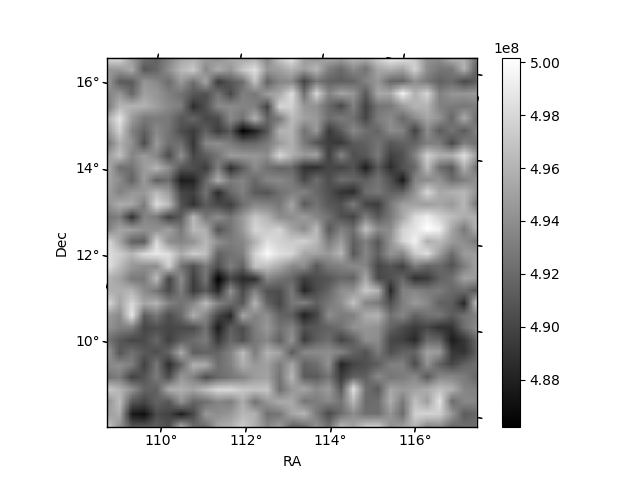
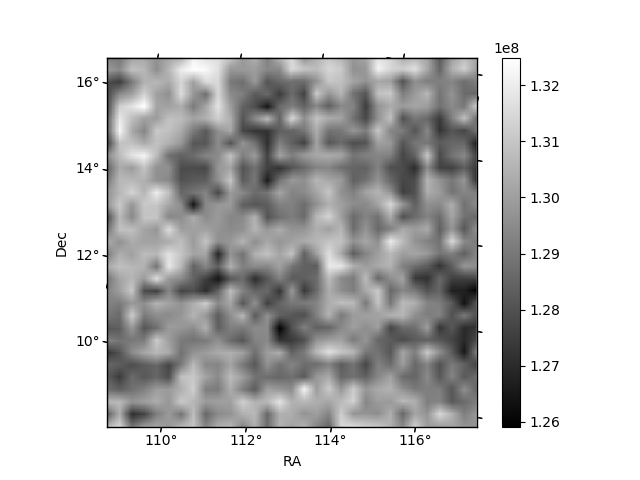
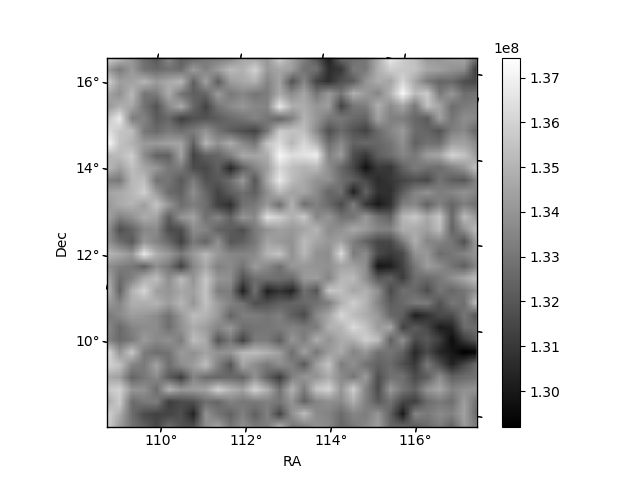
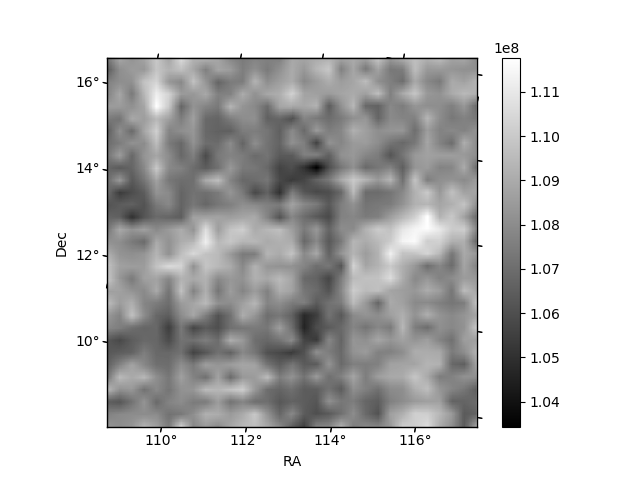
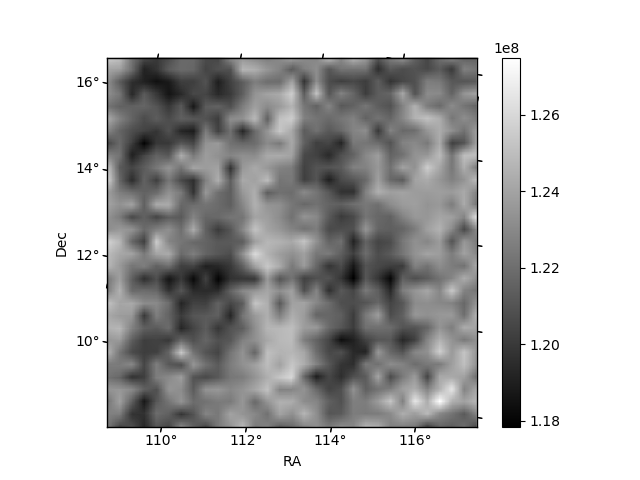
Histogram calculated using DETX and DETY for each event in the final _common_clean file
| Quadrant A | 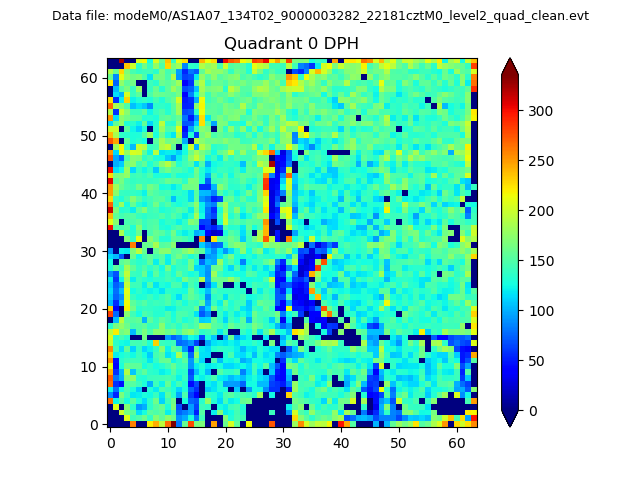 |
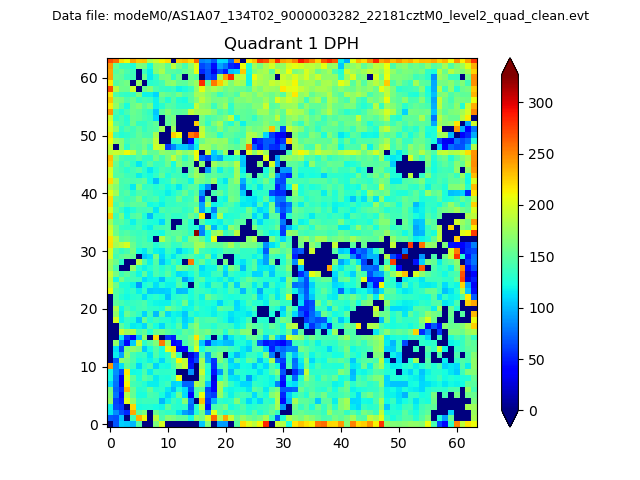 |
Quadrant B |
|---|---|---|---|
| Quadrant D | 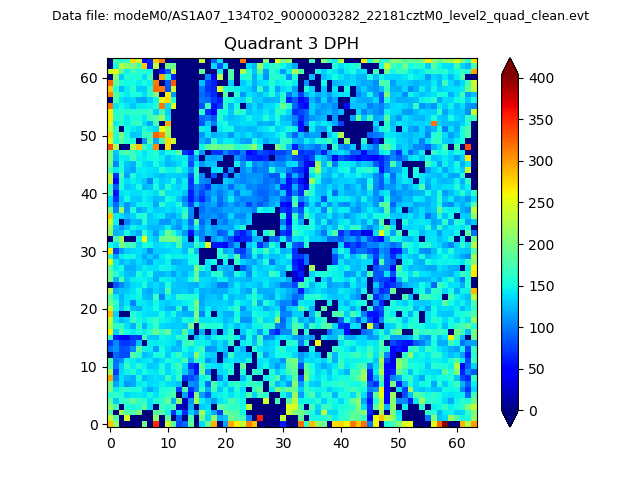 |
 |
Quadrant C |
| Plot type | Count rate plots | Images |
|---|---|---|
| Comparison with Poisson distribution Blue bars denote a histogram of data divided into 1 sec bins. Red curve is a Poisson curve with rate = median count rate of data. |
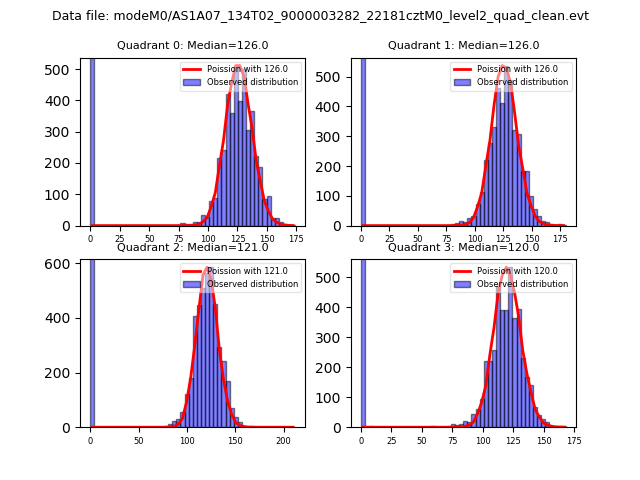 |
 |
| Quadrant-wise count rates Data is divided into 100 sec bins |
 |
|
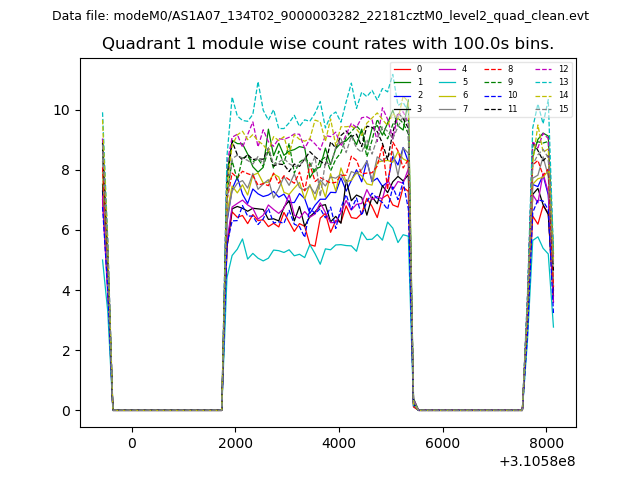
| Module-wise count rates for Quadrant A Data is divided into 100 sec bins |
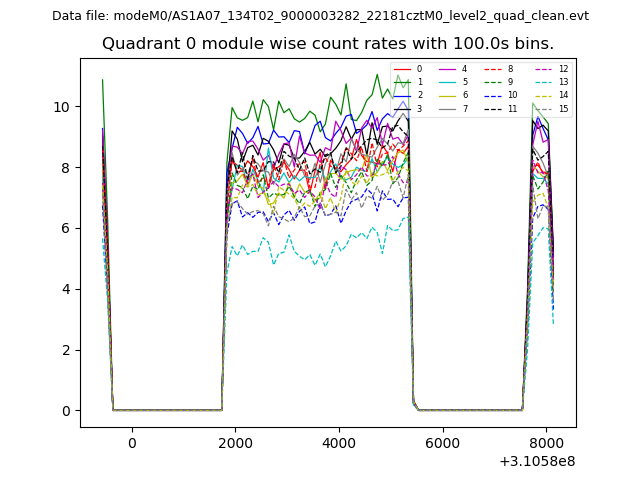 |
 |
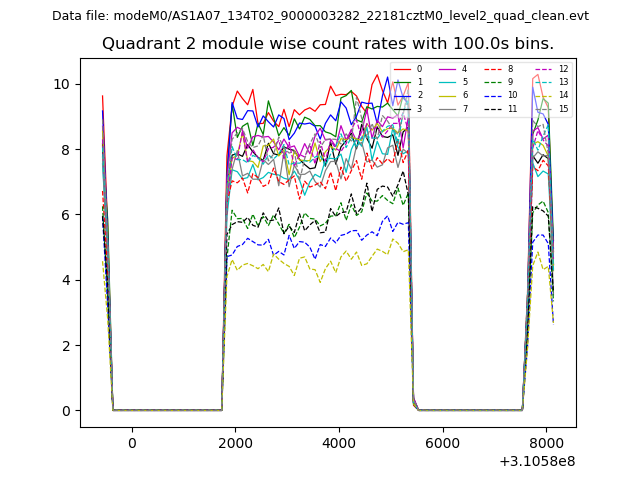
| Module-wise count rates for Quadrant B Data is divided into 100 sec bins |
 |
 |
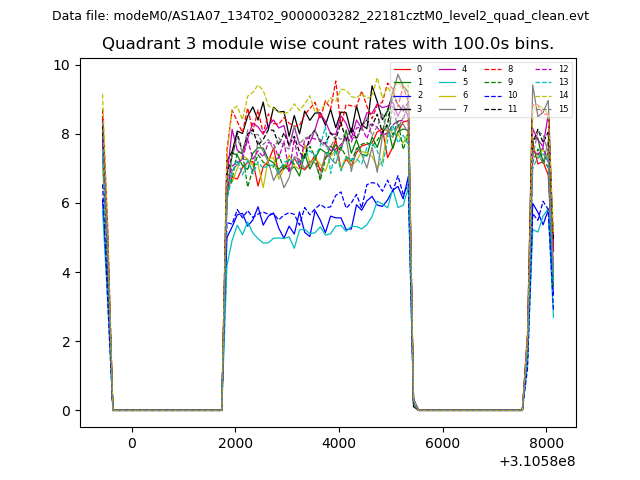
| Module-wise count rates for Quadrant C Data is divided into 100 sec bins |
 |
 |
| Module-wise count rates for Quadrant D Data is divided into 100 sec bins |
 |
 |
| Parameter | Plot |
|---|---|
| CZT HV Monitor | 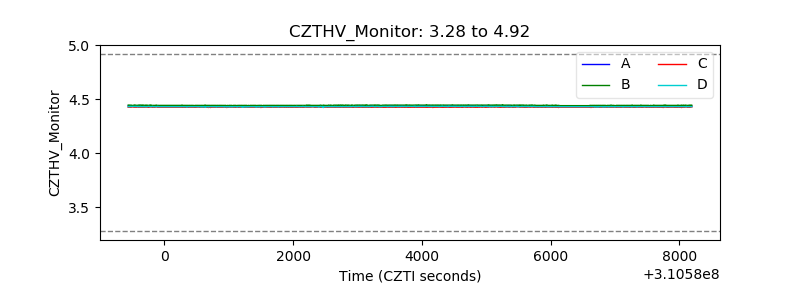 |
| D_VDD | 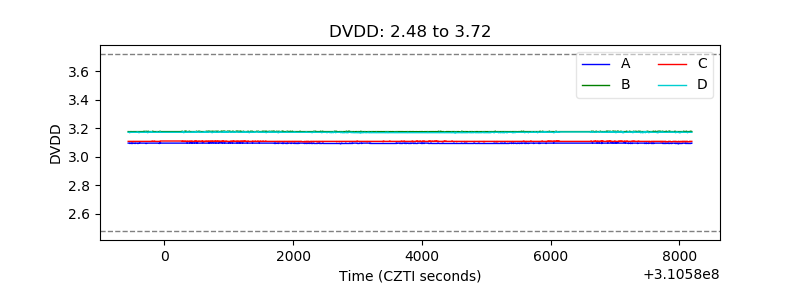 |
| Temperature 1 | 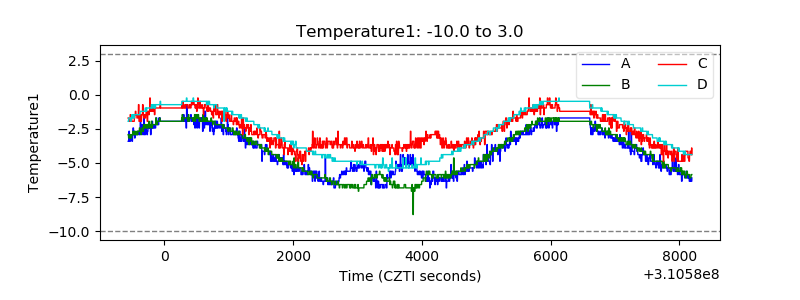 |
| Veto HV Monitor | 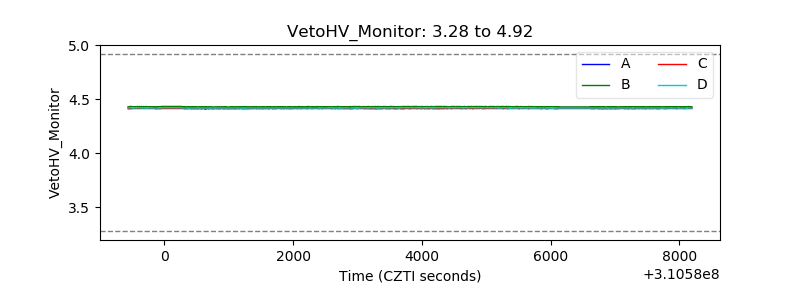 |
| Veto LLD | 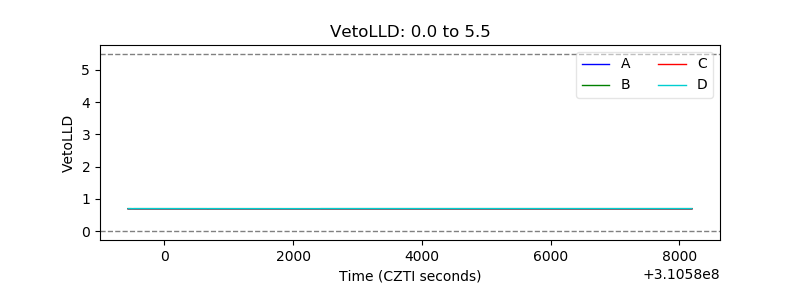 |
| Alpha Counter |  |
| _CPM_Rate |  |
| CZT Counter | 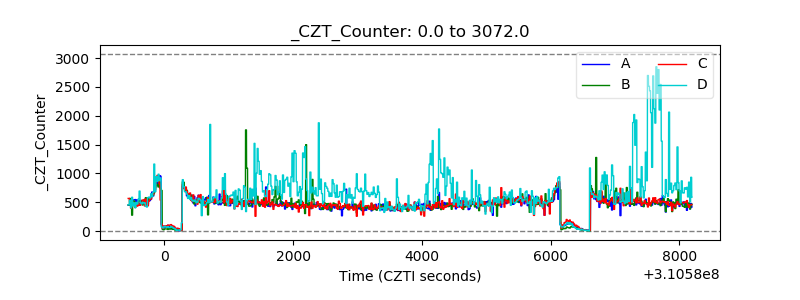 |
| +2.5 Volts monitor |  |
| +5 Volts monitor |  |
| _ROLL_ROT | 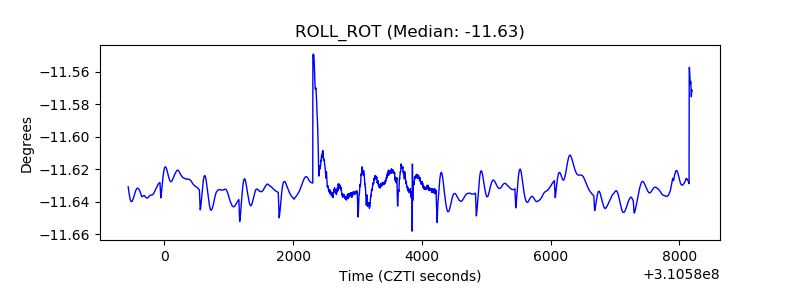 |
| _Roll_DEC | 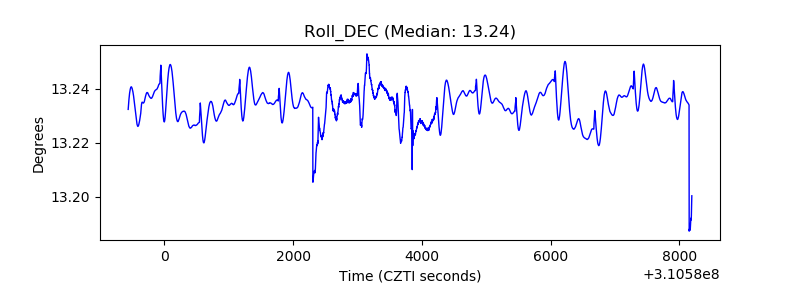 |
| _Roll_RA | 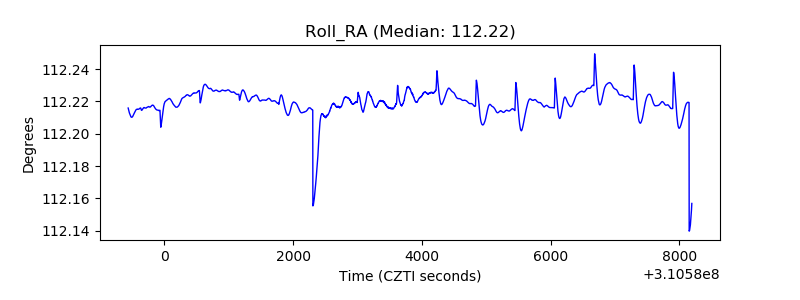 |
| Veto Counter | 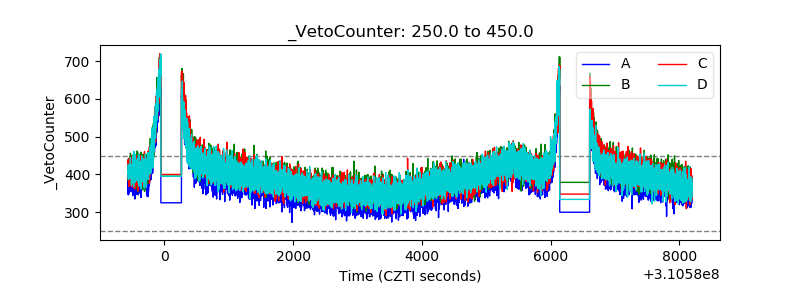 |