| Param | Original file | Final file |
|---|---|---|
| Filename | modeM0/AS1A07_054T01_9000003286_22209cztM0_level2.evt | modeM0/AS1A07_054T01_9000003286_22209cztM0_level2_quad_clean.evt |
| Size (bytes) | 460,932,480 | 131,869,440 |
| Size | 439.6 MB | 125.8 MB |
| Events in quadrant A | 3,240,223 | 893,179 |
| Events in quadrant B | 3,385,171 | 901,788 |
| Events in quadrant C | 3,288,192 | 858,150 |
| Events in quadrant D | 3,562,553 | 846,116 |
| Mode M0 | |||
|---|---|---|---|
| Quadrant | BADHDUFLAG | Total packets | Discarded packets |
| A | 0 | 14407 | 1 |
| B | 0 | 14603 | 1 |
| C | 0 | 14480 | 1 |
| D | 0 | 15605 | 1 |
| Mode M9 | |||
|---|---|---|---|
| Quadrant | BADHDUFLAG | Total packets | Discarded packets |
| A | 0 | 3 | 0 |
| B | 0 | 3 | 0 |
| C | 0 | 3 | 0 |
| D | 0 | 3 | 0 |
| Mode SS | |||
|---|---|---|---|
| Quadrant | BADHDUFLAG | Total packets | Discarded packets |
| A | 0 | 144 | 0 |
| B | 0 | 144 | 0 |
| C | 0 | 144 | 0 |
| D | 0 | 144 | 0 |
| Quadrant | Total seconds | Saturated seconds | Saturation percentage |
|---|---|---|---|
| A | 7109 | 37 | 0.520467% |
| B | 7110 | 44 | 0.618847% |
| C | 7110 | 74 | 1.040788% |
| D | 7110 | 88 | 1.237693% |
Noise dominated data is calculated using 1-second bins in cleaned event files. If a bin has >2000 counts, and if more than 50% of those come from <1% of pixels, then it is considered to be noise-dominated and hence unusable.
| Quadrant | # 1 sec bins | Bins with >0 counts | Bins with >2000 counts | High rate bins dominated by noise | Noise dominated (total time) | Noise dominated (detector-on time) | Marked lightcurve |
|---|---|---|---|---|---|---|---|
| A | 7419 | 7110 | 0 | 0 | 0.00% | 0.00% | 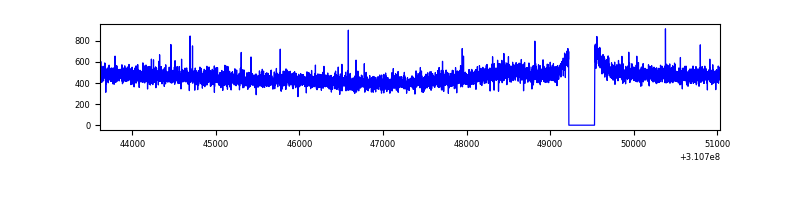 |
| B | 7420 | 7111 | 2 | 2 | 0.03% | 0.03% | 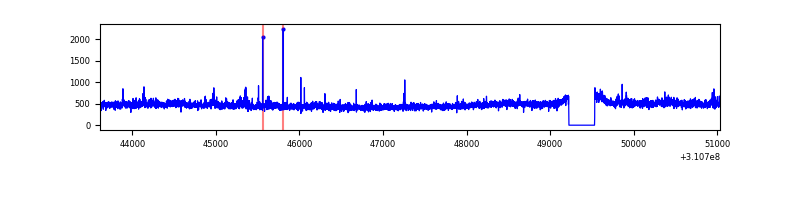 |
| C | 7420 | 7111 | 0 | 0 | 0.00% | 0.00% | 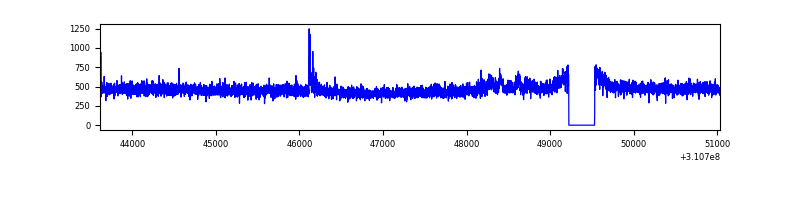 |
| D | 7420 | 7111 | 58 | 58 | 0.78% | 0.82% | 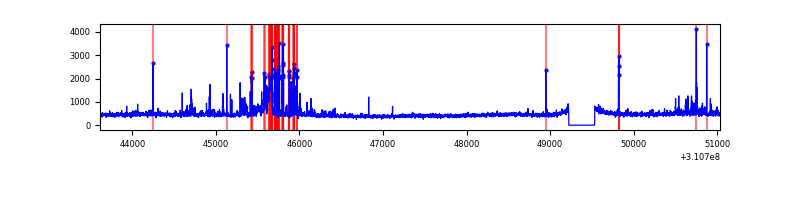 |
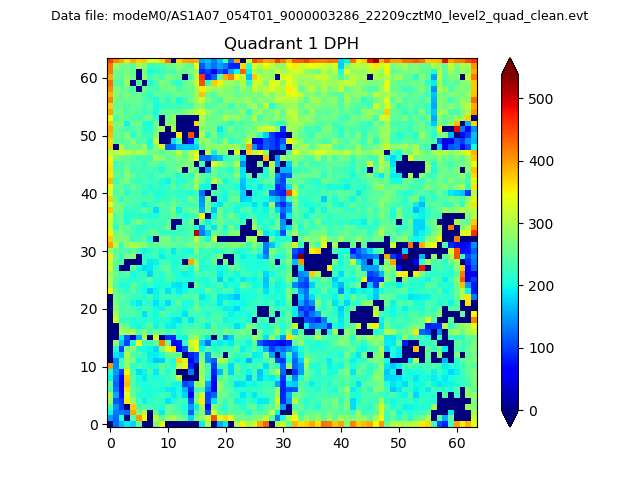
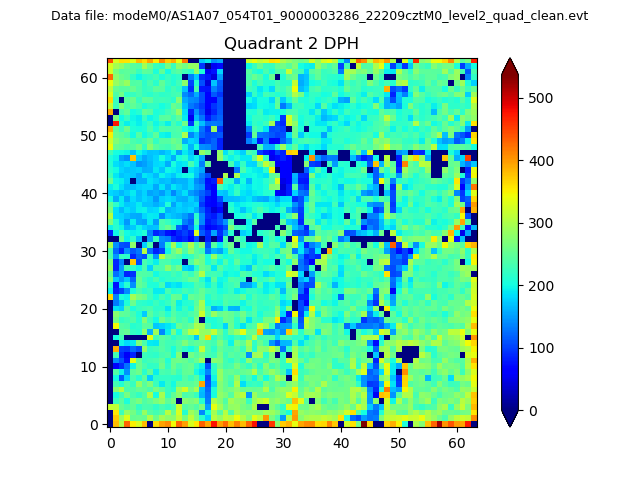
Top three noisy pixels from each quadrant. If the there are fewer than three noisy pixels in the level2.evt file, extra rows are filled as -1
| Pixel properties | Quadrant properties | ||||||
|---|---|---|---|---|---|---|---|
| Quadrant | DetID | PixID | Counts | Sigma | Mean | Median | Sigma |
| A | 13 | 254 | 12453 | 69.23 | 839 | 821 | 168.0 |
| A | 3 | 137 | 7216 | 38.06 | 839 | 821 | 168.0 |
| A | 0 | 226 | 7143 | 37.63 | 839 | 821 | 168.0 |
| B | 0 | 245 | 47393 | 291.81 | 833 | 811 | 159.6 |
| B | 0 | 190 | 27420 | 166.69 | 833 | 811 | 159.6 |
| B | 0 | 219 | 26752 | 162.51 | 833 | 811 | 159.6 |
| C | 14 | 238 | 125383 | 665.5 | 799 | 802 | 187.2 |
| C | 10 | 91 | 31430 | 163.61 | 799 | 802 | 187.2 |
| C | 10 | 22 | 15793 | 80.08 | 799 | 802 | 187.2 |
| D | 7 | 38 | 188137 | 943.84 | 814 | 789 | 198.5 |
| D | 2 | 136 | 107451 | 537.35 | 814 | 789 | 198.5 |
| D | 1 | 52 | 77082 | 384.35 | 814 | 789 | 198.5 |
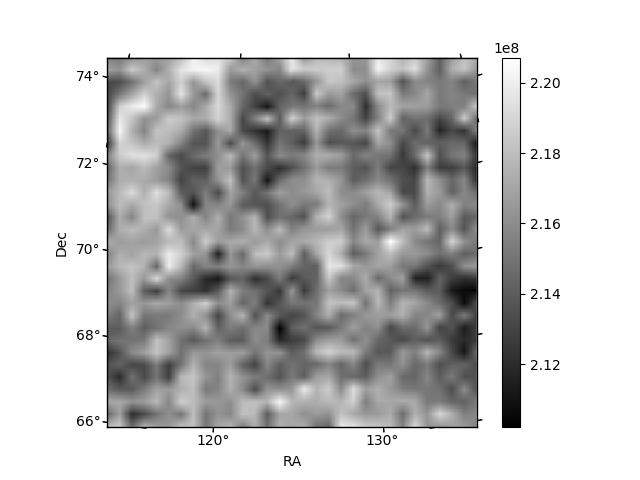
Histogram calculated using DETX and DETY for each event in the final _common_clean file
| Quadrant A | 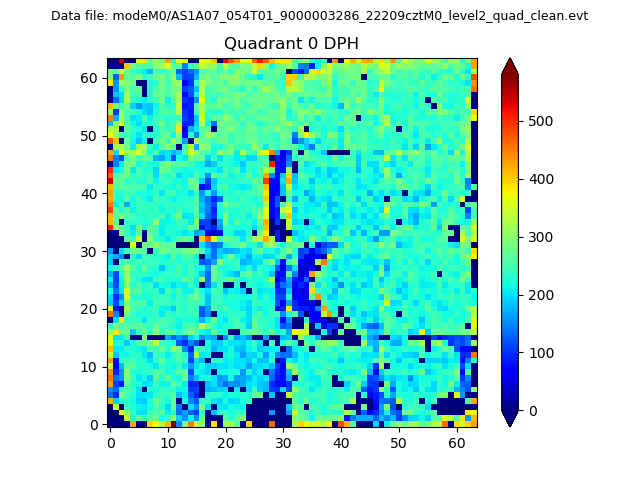 |
 |
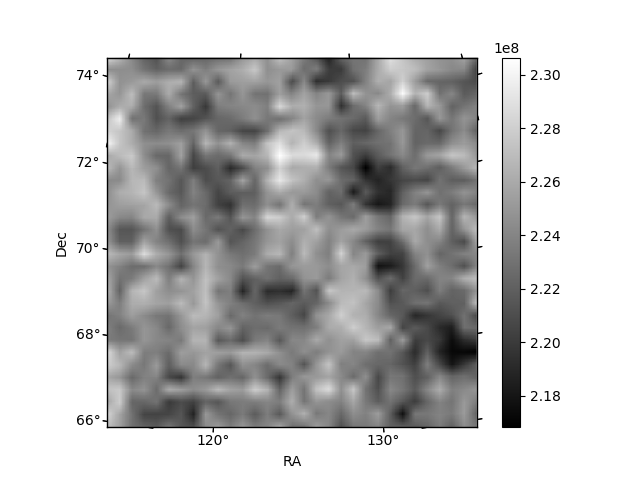
Quadrant B |
|---|---|---|---|
| Quadrant D | 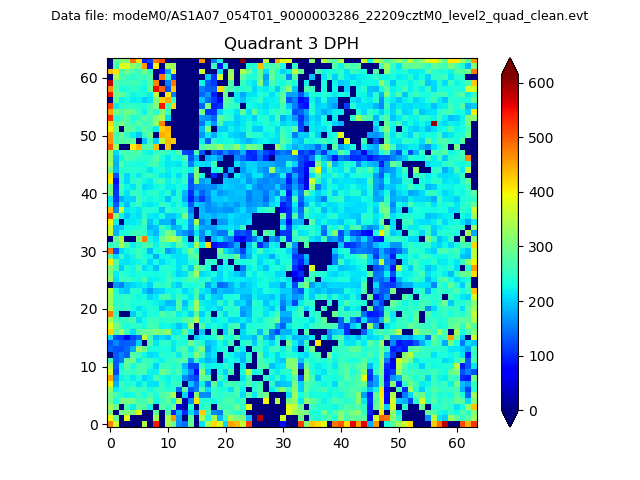 |
 |
Quadrant C |
| Plot type | Count rate plots | Images |
|---|---|---|
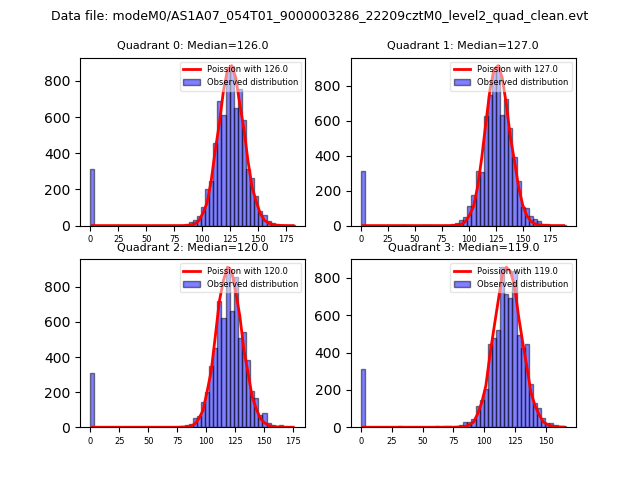
| Comparison with Poisson distribution Blue bars denote a histogram of data divided into 1 sec bins. Red curve is a Poisson curve with rate = median count rate of data. |
 |
 |
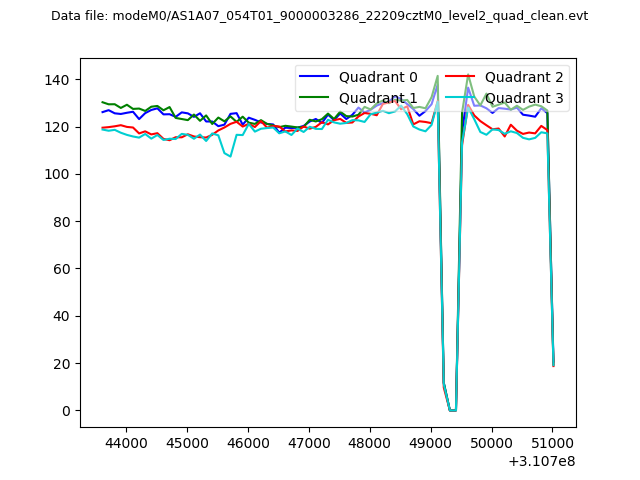
| Quadrant-wise count rates Data is divided into 100 sec bins |
 |
|
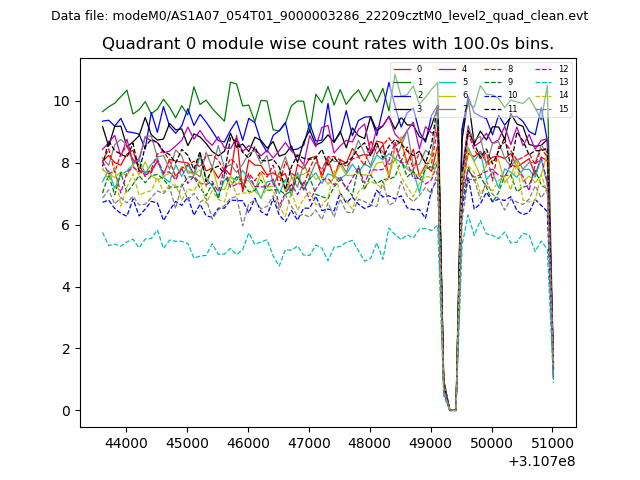
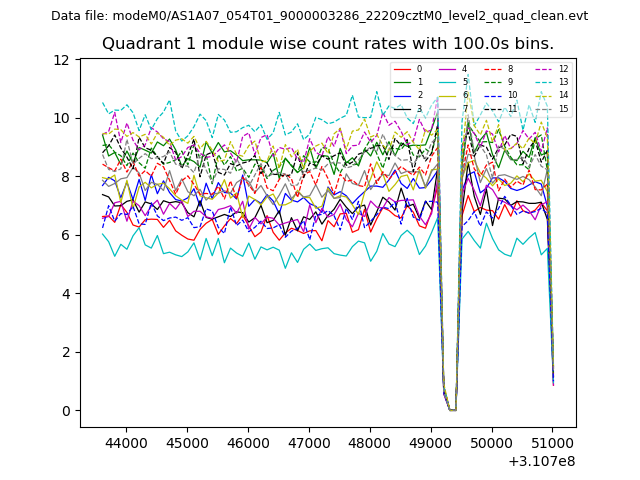
| Module-wise count rates for Quadrant A Data is divided into 100 sec bins |
 |
 |
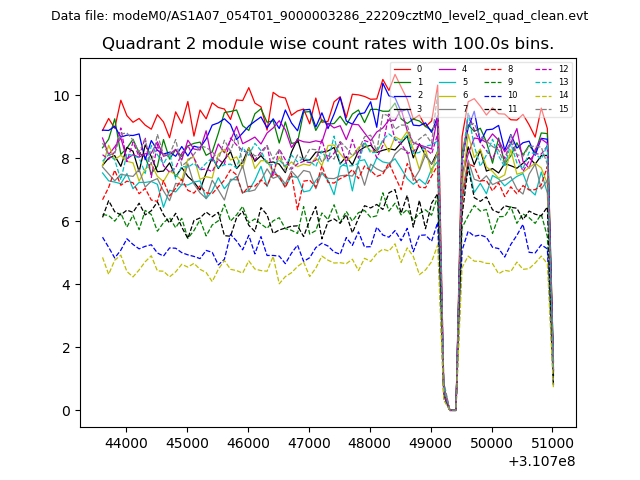
| Module-wise count rates for Quadrant B Data is divided into 100 sec bins |
 |
 |
| Module-wise count rates for Quadrant C Data is divided into 100 sec bins |
 |
 |
| Module-wise count rates for Quadrant D Data is divided into 100 sec bins |
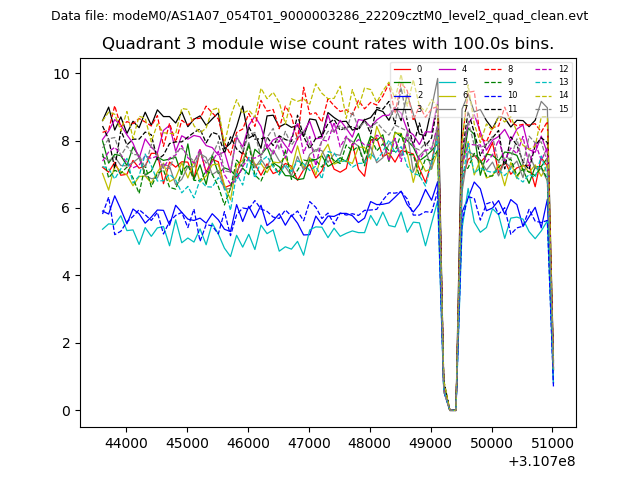 |
 |
| Parameter | Plot |
|---|---|
| CZT HV Monitor | 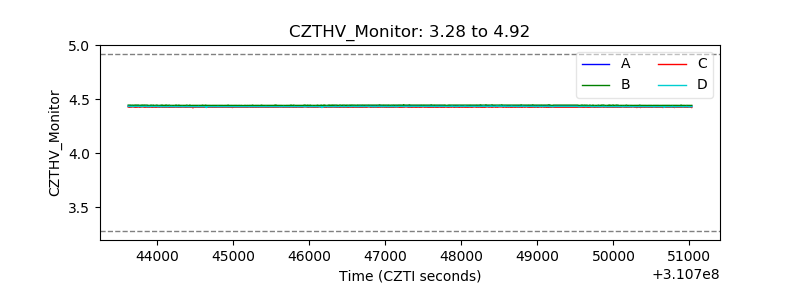 |
| D_VDD | 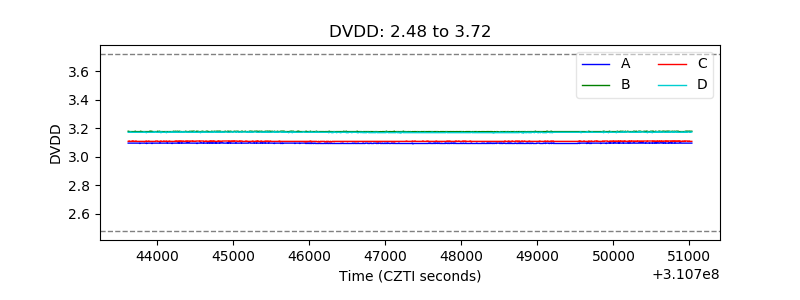 |
| Temperature 1 | 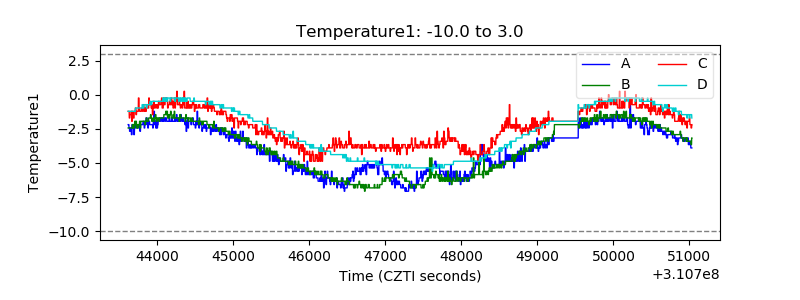 |
| Veto HV Monitor | 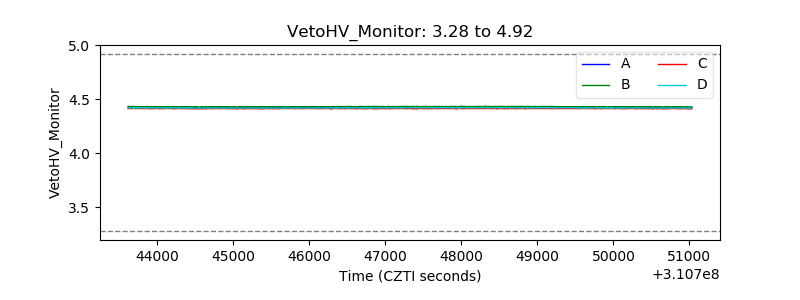 |
| Veto LLD | 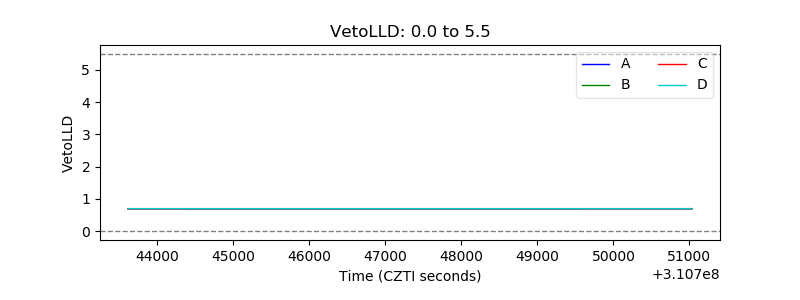 |
| Alpha Counter | 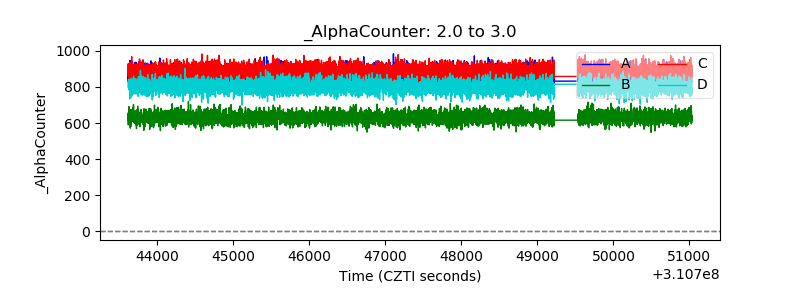 |
| _CPM_Rate | 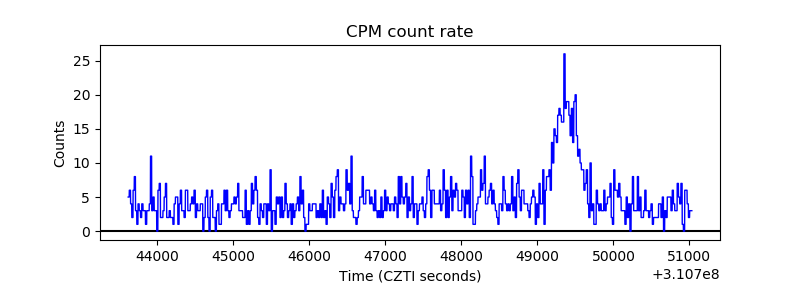 |
| CZT Counter | 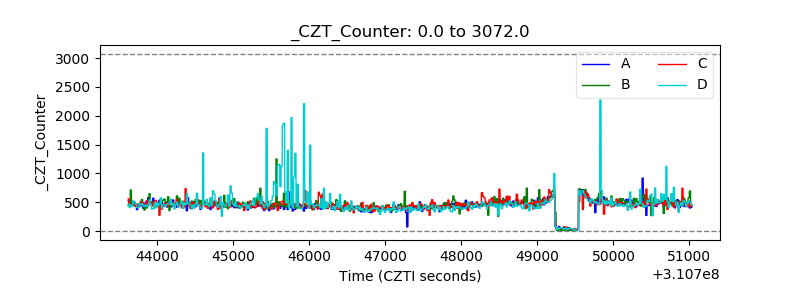 |
| +2.5 Volts monitor |  |
| +5 Volts monitor | 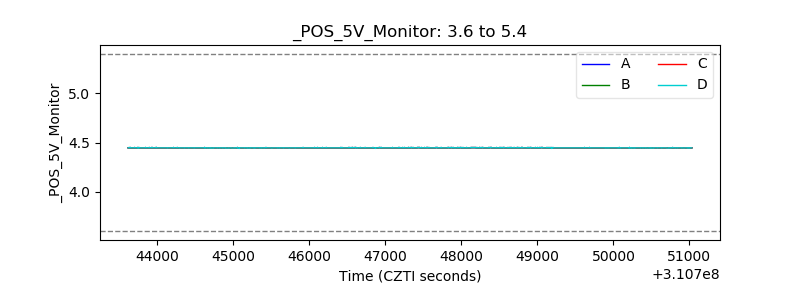 |
| _ROLL_ROT | 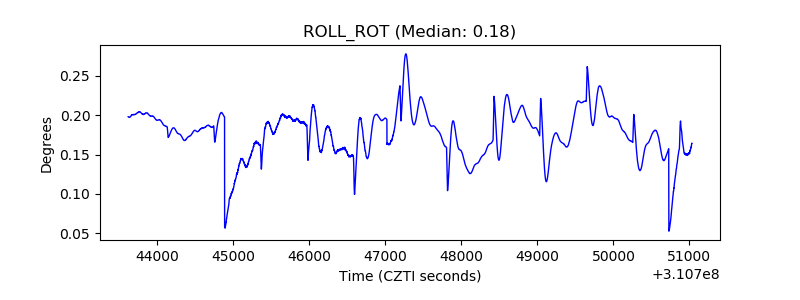 |
| _Roll_DEC | 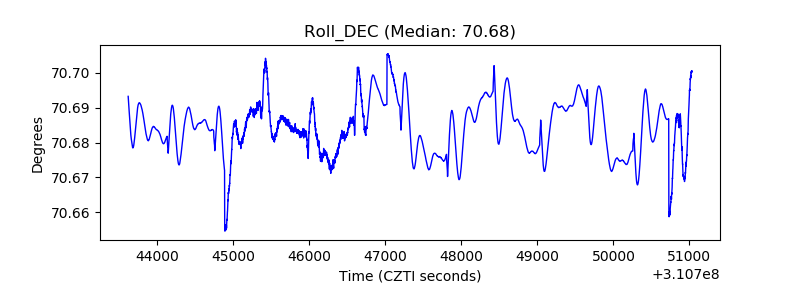 |
| _Roll_RA | 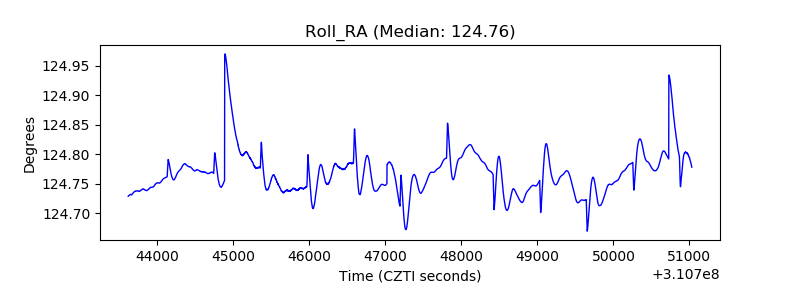 |
| Veto Counter | 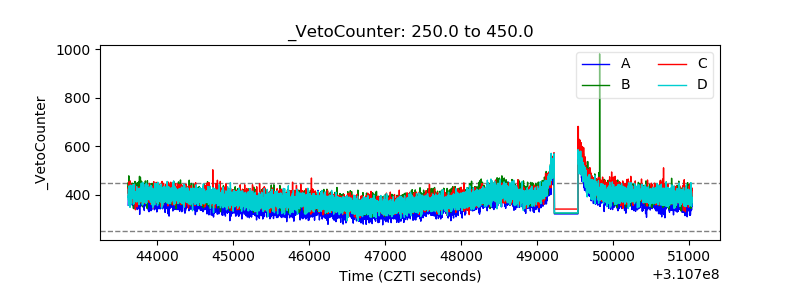 |