| Param | Original file | Final file |
|---|---|---|
| Filename | modeM0/AS1A07_054T01_9000003286_22216cztM0_level2.evt | modeM0/AS1A07_054T01_9000003286_22216cztM0_level2_quad_clean.evt |
| Size (bytes) | 428,512,320 | 134,003,520 |
| Size | 408.7 MB | 127.8 MB |
| Events in quadrant A | 3,092,753 | 910,253 |
| Events in quadrant B | 3,168,643 | 932,847 |
| Events in quadrant C | 3,135,217 | 891,294 |
| Events in quadrant D | 3,133,489 | 865,915 |
| Mode M0 | |||
|---|---|---|---|
| Quadrant | BADHDUFLAG | Total packets | Discarded packets |
| A | 0 | 13575 | 2 |
| B | 0 | 13762 | 2 |
| C | 0 | 13721 | 2 |
| D | 0 | 13967 | 2 |
| Mode M9 | |||
|---|---|---|---|
| Quadrant | BADHDUFLAG | Total packets | Discarded packets |
| A | 0 | 19 | 0 |
| B | 0 | 20 | 0 |
| C | 0 | 20 | 0 |
| D | 0 | 20 | 0 |
| Mode SS | |||
|---|---|---|---|
| Quadrant | BADHDUFLAG | Total packets | Discarded packets |
| A | 0 | 134 | 0 |
| B | 0 | 134 | 0 |
| C | 0 | 134 | 0 |
| D | 0 | 134 | 0 |
| Quadrant | Total seconds | Saturated seconds | Saturation percentage |
|---|---|---|---|
| A | 6577 | 11 | 0.167250% |
| B | 6577 | 27 | 0.410522% |
| C | 6577 | 45 | 0.684203% |
| D | 6577 | 11 | 0.167250% |
Noise dominated data is calculated using 1-second bins in cleaned event files. If a bin has >2000 counts, and if more than 50% of those come from <1% of pixels, then it is considered to be noise-dominated and hence unusable.
| Quadrant | # 1 sec bins | Bins with >0 counts | Bins with >2000 counts | High rate bins dominated by noise | Noise dominated (total time) | Noise dominated (detector-on time) | Marked lightcurve |
|---|---|---|---|---|---|---|---|
| A | 7781 | 6577 | 0 | 0 | 0.00% | 0.00% | 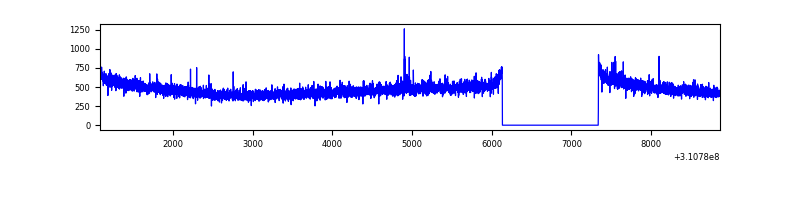 |
| B | 7781 | 6577 | 0 | 0 | 0.00% | 0.00% | 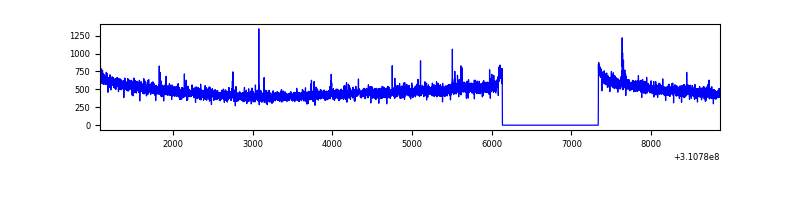 |
| C | 7781 | 6577 | 0 | 0 | 0.00% | 0.00% | 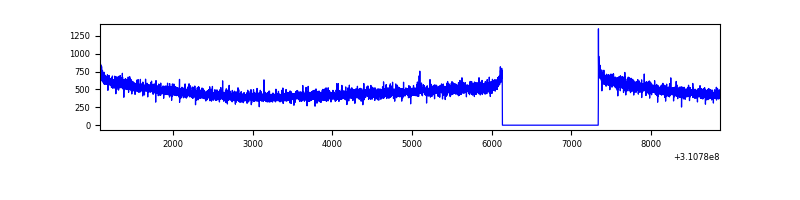 |
| D | 7781 | 6577 | 5 | 5 | 0.06% | 0.08% | 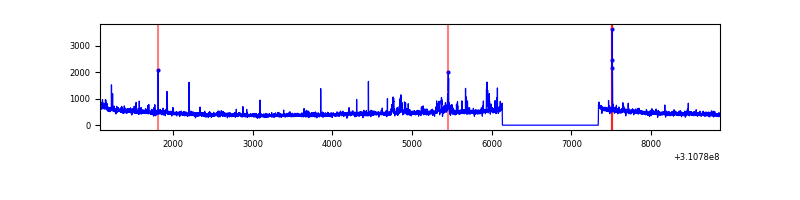 |
Top three noisy pixels from each quadrant. If the there are fewer than three noisy pixels in the level2.evt file, extra rows are filled as -1
| Pixel properties | Quadrant properties | ||||||
|---|---|---|---|---|---|---|---|
| Quadrant | DetID | PixID | Counts | Sigma | Mean | Median | Sigma |
| A | 2 | 79 | 14862 | 88.54 | 798 | 784 | 159.0 |
| A | 13 | 254 | 10584 | 61.64 | 798 | 784 | 159.0 |
| A | 0 | 226 | 6918 | 38.58 | 798 | 784 | 159.0 |
| B | 12 | 111 | 17966 | 115.52 | 804 | 786 | 148.7 |
| B | 11 | 111 | 15911 | 101.7 | 804 | 786 | 148.7 |
| B | 14 | 111 | 14182 | 90.08 | 804 | 786 | 148.7 |
| C | 14 | 238 | 124821 | 699.57 | 771 | 777 | 177.3 |
| C | 13 | 61 | 5275 | 25.37 | 771 | 777 | 177.3 |
| C | 0 | 10 | 3731 | 16.66 | 771 | 777 | 177.3 |
| D | 1 | 52 | 174768 | 942.65 | 770 | 748 | 184.6 |
| D | 13 | 172 | 25566 | 134.44 | 770 | 748 | 184.6 |
| D | 2 | 234 | 25100 | 131.91 | 770 | 748 | 184.6 |
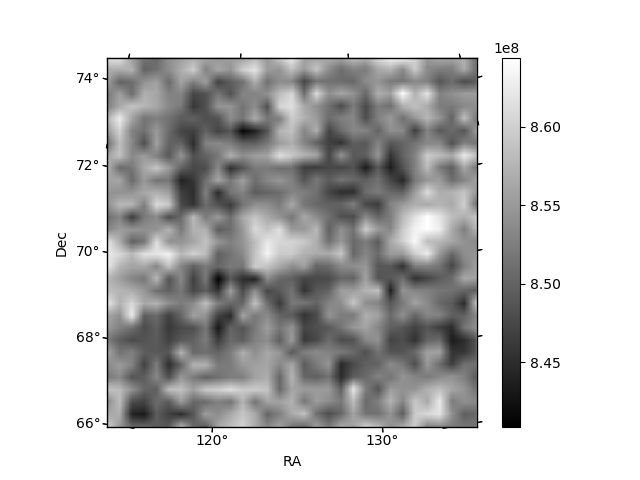
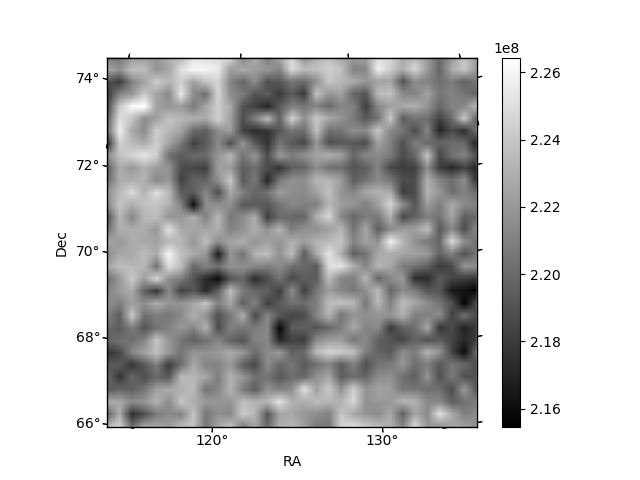
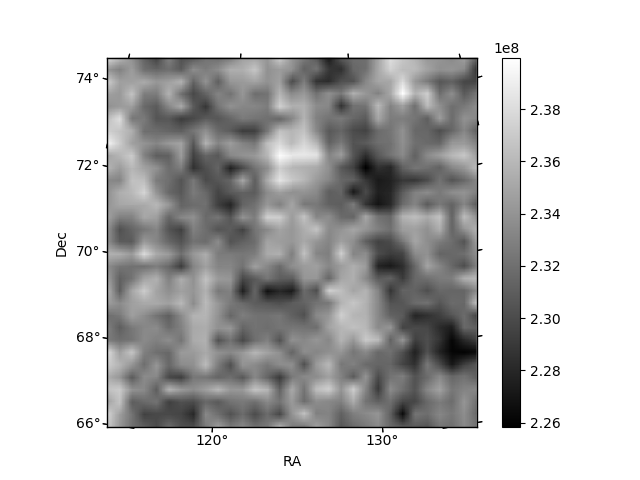
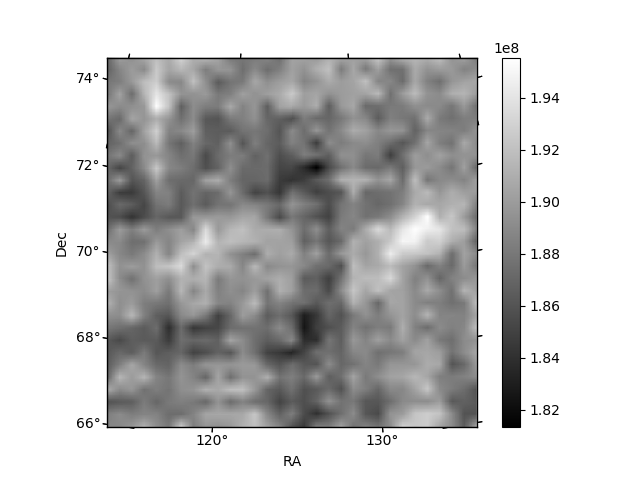
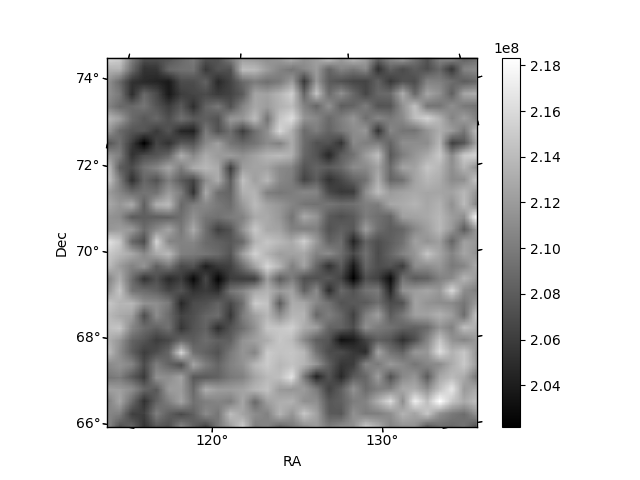
Histogram calculated using DETX and DETY for each event in the final _common_clean file
| Quadrant A | 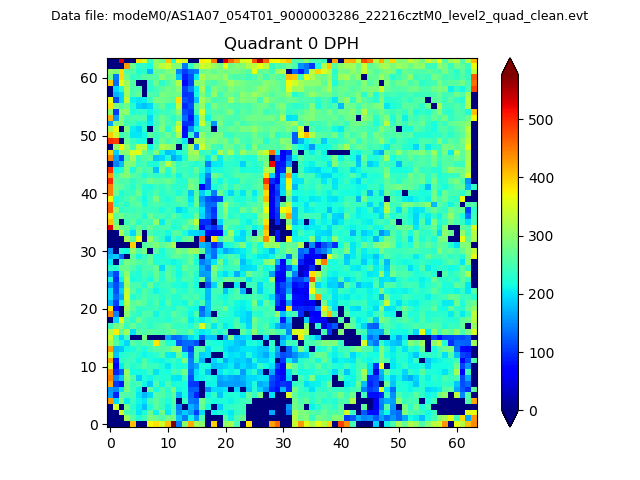 |
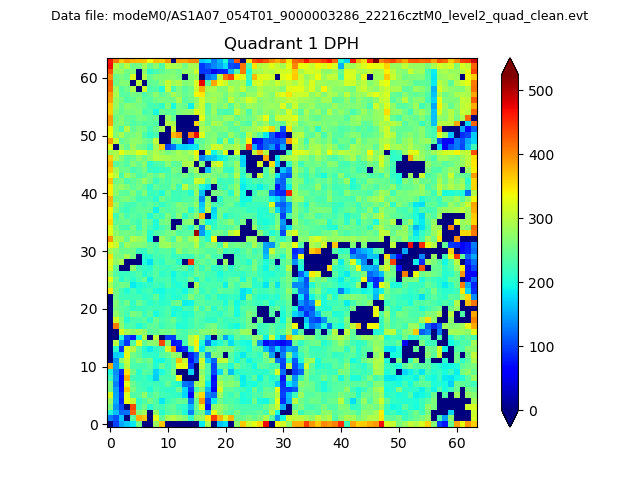 |
Quadrant B |
|---|---|---|---|
| Quadrant D | 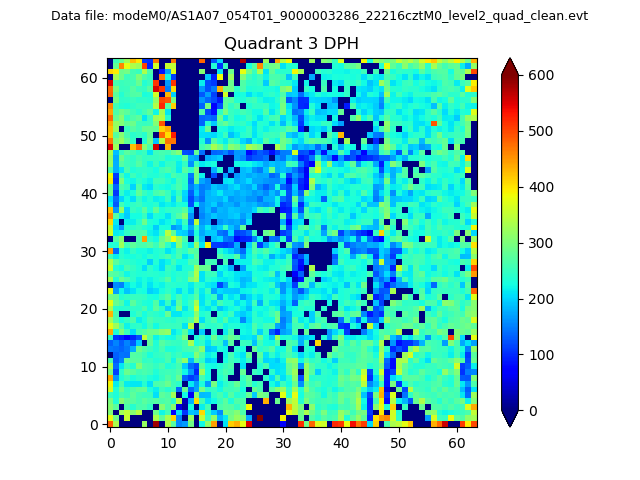 |
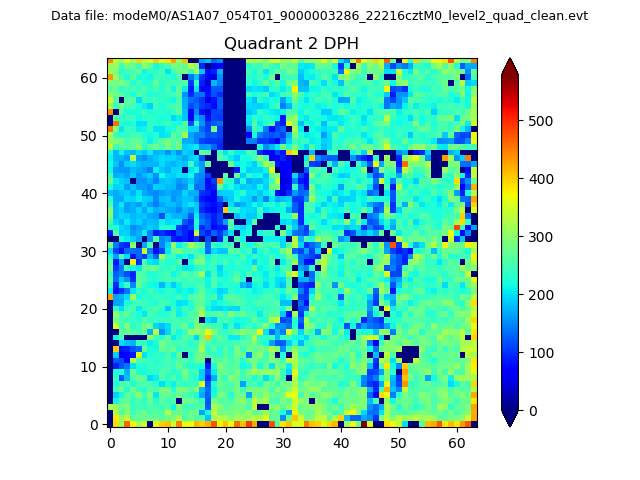 |
Quadrant C |
| Plot type | Count rate plots | Images |
|---|---|---|
| Comparison with Poisson distribution Blue bars denote a histogram of data divided into 1 sec bins. Red curve is a Poisson curve with rate = median count rate of data. |
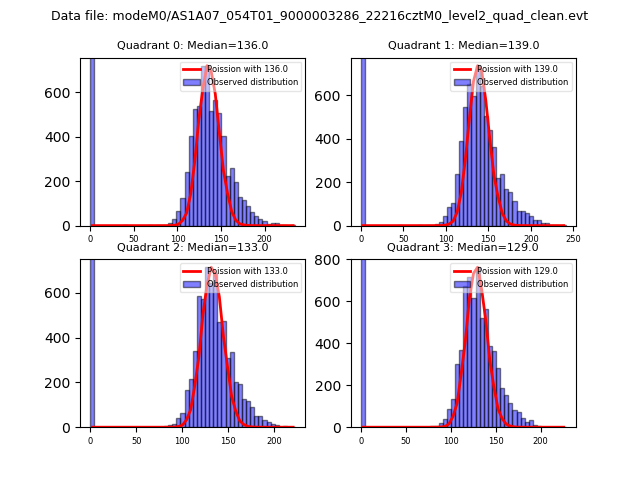 |
 |
| Quadrant-wise count rates Data is divided into 100 sec bins |
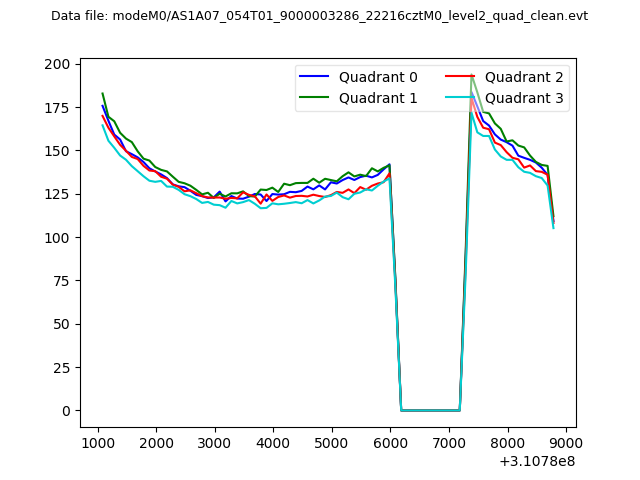 |
|
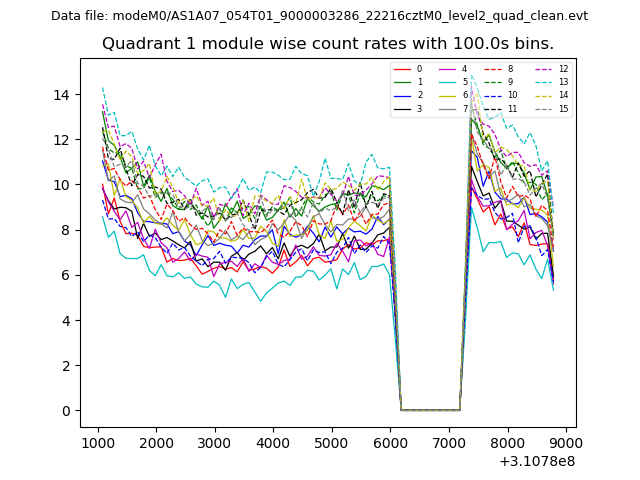
| Module-wise count rates for Quadrant A Data is divided into 100 sec bins |
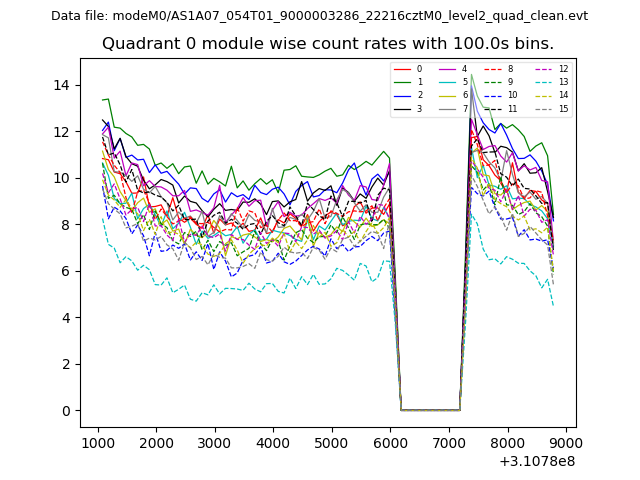 |
 |
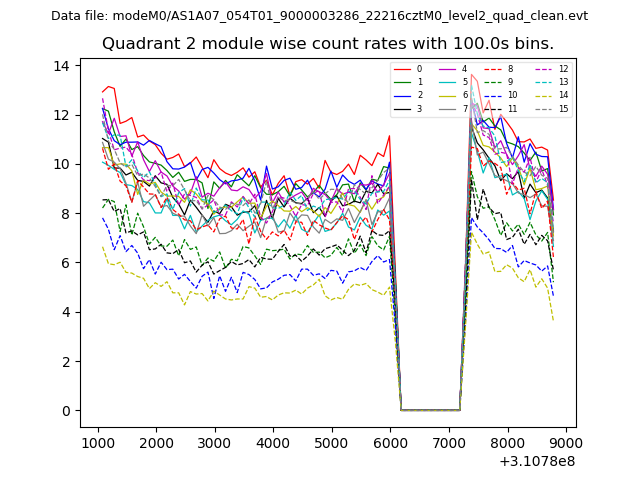
| Module-wise count rates for Quadrant B Data is divided into 100 sec bins |
 |
 |
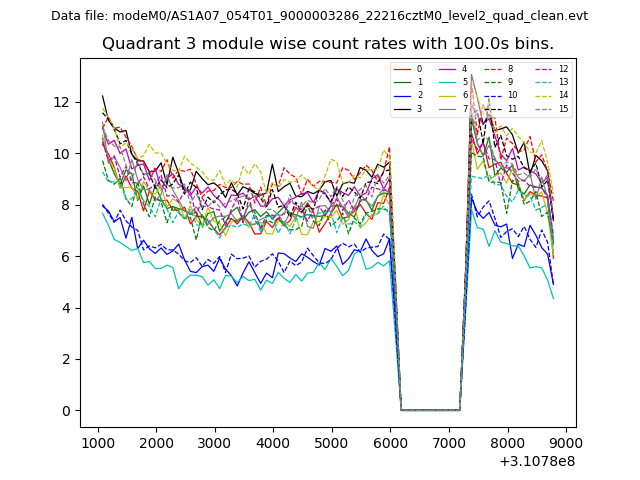
| Module-wise count rates for Quadrant C Data is divided into 100 sec bins |
 |
 |
| Module-wise count rates for Quadrant D Data is divided into 100 sec bins |
 |
 |
| Parameter | Plot |
|---|---|
| CZT HV Monitor | 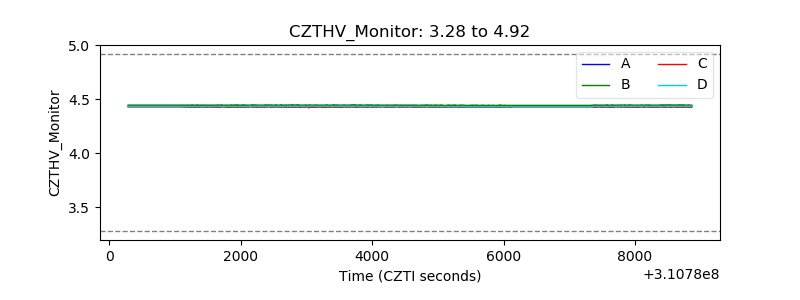 |
| D_VDD | 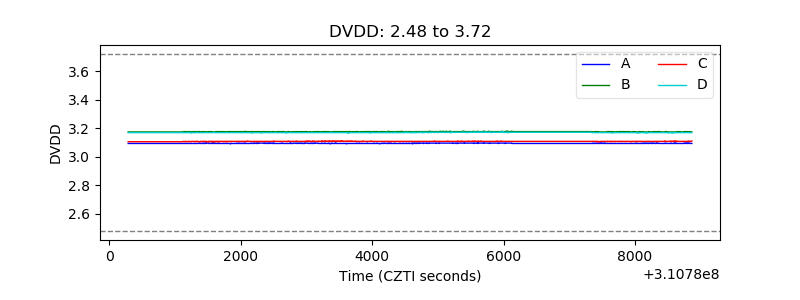 |
| Temperature 1 | 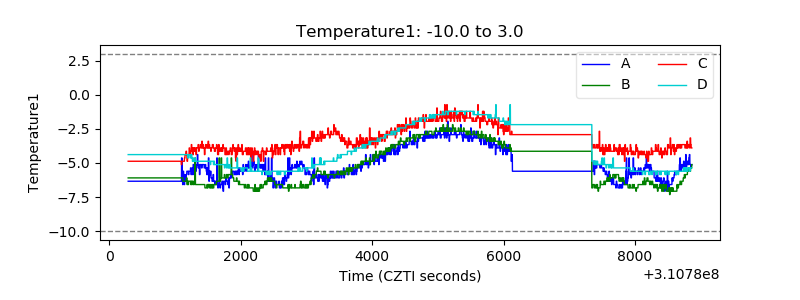 |
| Veto HV Monitor | 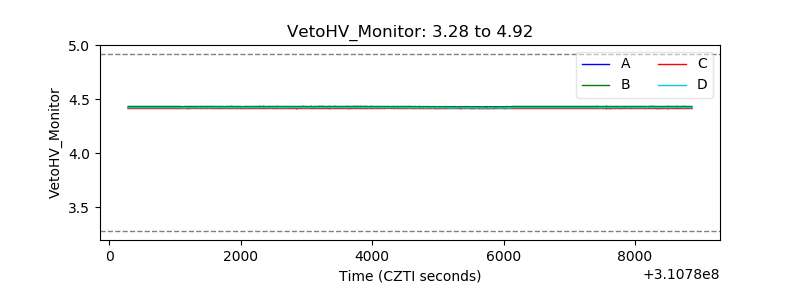 |
| Veto LLD | 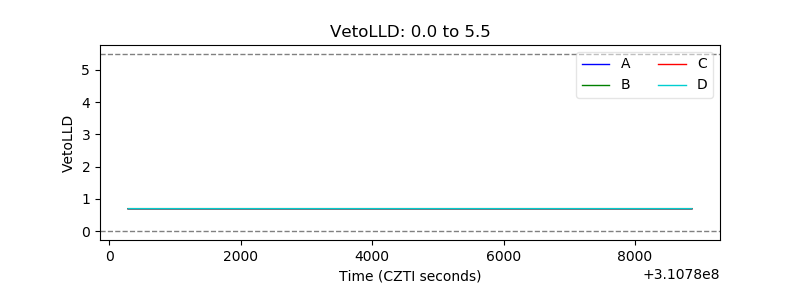 |
| Alpha Counter | 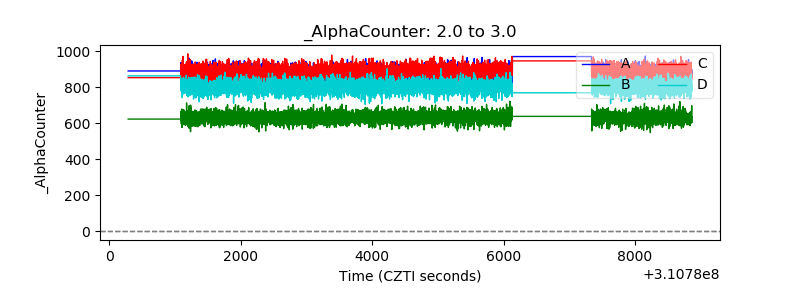 |
| _CPM_Rate | 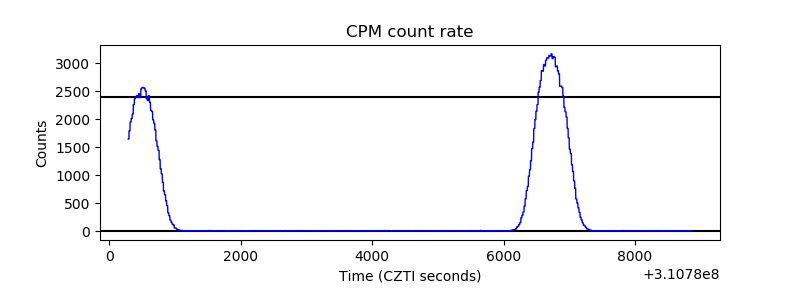 |
| CZT Counter | 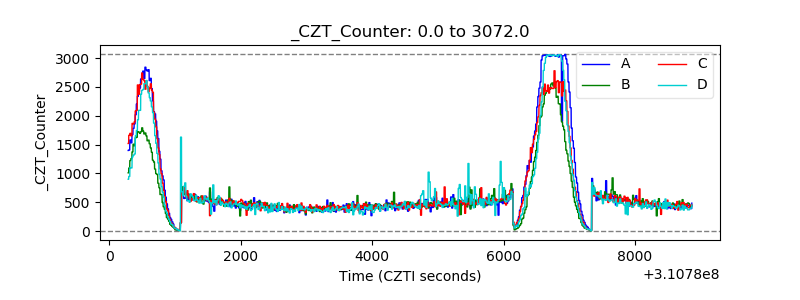 |
| +2.5 Volts monitor |  |
| +5 Volts monitor |  |
| _ROLL_ROT | 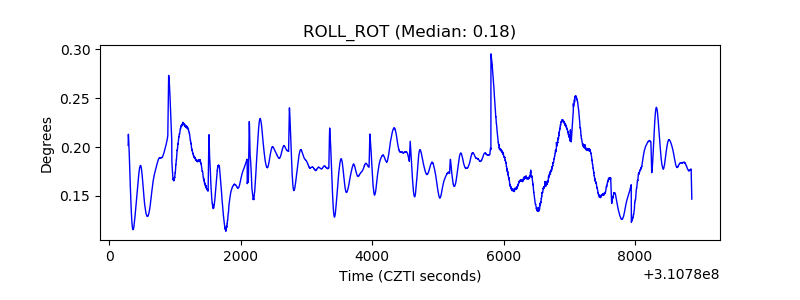 |
| _Roll_DEC | 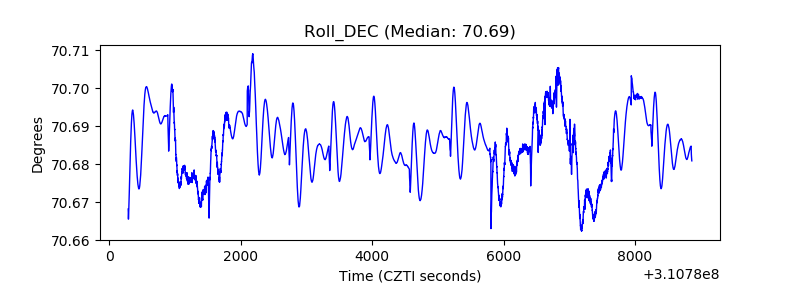 |
| _Roll_RA | 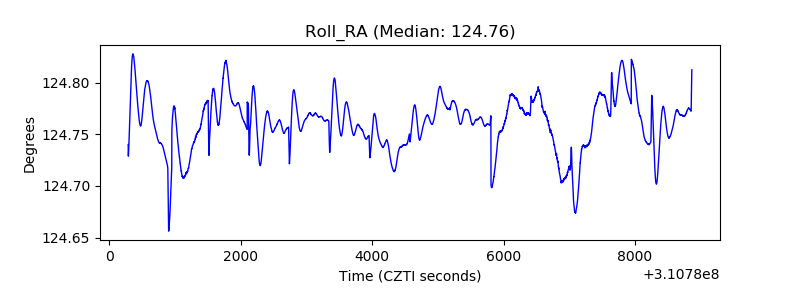 |
| Veto Counter | 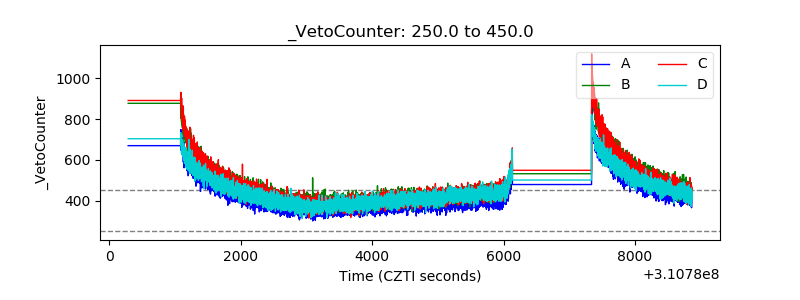 |