| Param | Original file | Final file |
|---|---|---|
| Filename | modeM0/AS1A07_054T01_9000003286_22223cztM0_level2.evt | modeM0/AS1A07_054T01_9000003286_22223cztM0_level2_quad_clean.evt |
| Size (bytes) | 521,320,320 | 145,048,320 |
| Size | 497.2 MB | 138.3 MB |
| Events in quadrant A | 3,634,082 | 985,131 |
| Events in quadrant B | 3,789,484 | 995,761 |
| Events in quadrant C | 3,638,130 | 940,615 |
| Events in quadrant D | 4,195,255 | 928,080 |
| Mode M0 | |||
|---|---|---|---|
| Quadrant | BADHDUFLAG | Total packets | Discarded packets |
| A | 0 | 16069 | 2 |
| B | 0 | 16298 | 2 |
| C | 0 | 16093 | 2 |
| D | 0 | 17730 | 3 |
| Mode M9 | |||
|---|---|---|---|
| Quadrant | BADHDUFLAG | Total packets | Discarded packets |
| A | 0 | 1 | 0 |
| B | 0 | 1 | 0 |
| C | 0 | 1 | 0 |
| D | 0 | 1 | 0 |
| Mode SS | |||
|---|---|---|---|
| Quadrant | BADHDUFLAG | Total packets | Discarded packets |
| A | 0 | 160 | 0 |
| B | 0 | 160 | 0 |
| C | 0 | 160 | 0 |
| D | 0 | 160 | 0 |
| Quadrant | Total seconds | Saturated seconds | Saturation percentage |
|---|---|---|---|
| A | 7812 | 139 | 1.779314% |
| B | 7813 | 168 | 2.150262% |
| C | 7813 | 196 | 2.508639% |
| D | 7812 | 173 | 2.214542% |
Noise dominated data is calculated using 1-second bins in cleaned event files. If a bin has >2000 counts, and if more than 50% of those come from <1% of pixels, then it is considered to be noise-dominated and hence unusable.
| Quadrant | # 1 sec bins | Bins with >0 counts | Bins with >2000 counts | High rate bins dominated by noise | Noise dominated (total time) | Noise dominated (detector-on time) | Marked lightcurve |
|---|---|---|---|---|---|---|---|
| A | 7957 | 7813 | 4 | 4 | 0.05% | 0.05% | 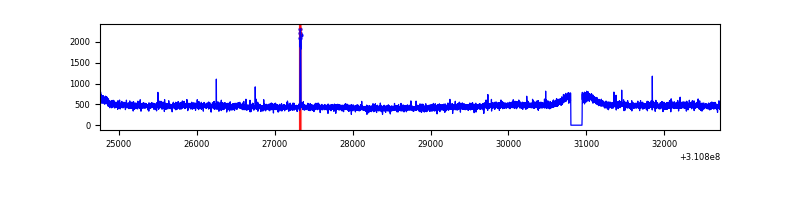 |
| B | 7958 | 7814 | 0 | 0 | 0.00% | 0.00% | 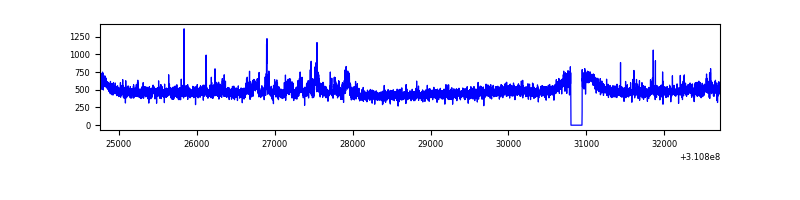 |
| C | 7958 | 7814 | 4 | 4 | 0.05% | 0.05% | 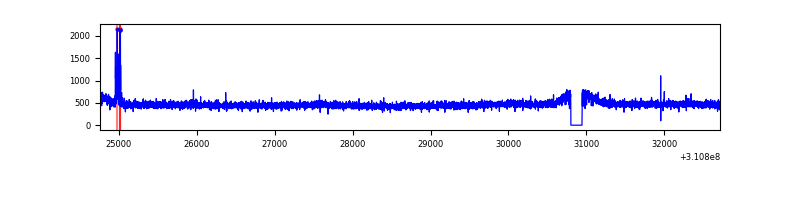 |
| D | 7957 | 7813 | 81 | 81 | 1.02% | 1.04% | 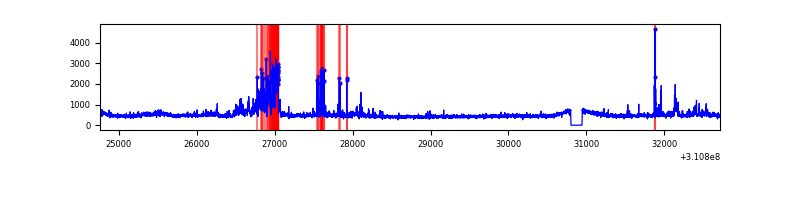 |
Top three noisy pixels from each quadrant. If the there are fewer than three noisy pixels in the level2.evt file, extra rows are filled as -1
| Pixel properties | Quadrant properties | ||||||
|---|---|---|---|---|---|---|---|
| Quadrant | DetID | PixID | Counts | Sigma | Mean | Median | Sigma |
| A | 5 | 168 | 24123 | 124.0 | 935 | 914 | 187.2 |
| A | 13 | 254 | 12680 | 62.86 | 935 | 914 | 187.2 |
| A | 3 | 137 | 8246 | 39.17 | 935 | 914 | 187.2 |
| B | 0 | 245 | 115191 | 649.15 | 926 | 900 | 176.1 |
| B | 0 | 190 | 31603 | 174.38 | 926 | 900 | 176.1 |
| B | 12 | 111 | 21573 | 117.42 | 926 | 900 | 176.1 |
| C | 14 | 238 | 141618 | 682.53 | 885 | 887 | 206.2 |
| C | 10 | 22 | 39084 | 185.25 | 885 | 887 | 206.2 |
| C | 13 | 61 | 6225 | 25.89 | 885 | 887 | 206.2 |
| D | 12 | 227 | 446084 | 2033.29 | 902 | 870 | 219.0 |
| D | 1 | 52 | 133381 | 605.18 | 902 | 870 | 219.0 |
| D | 5 | 243 | 125537 | 569.35 | 902 | 870 | 219.0 |
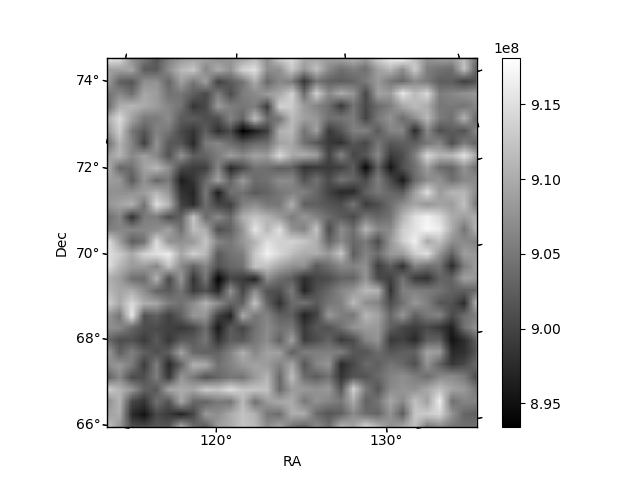
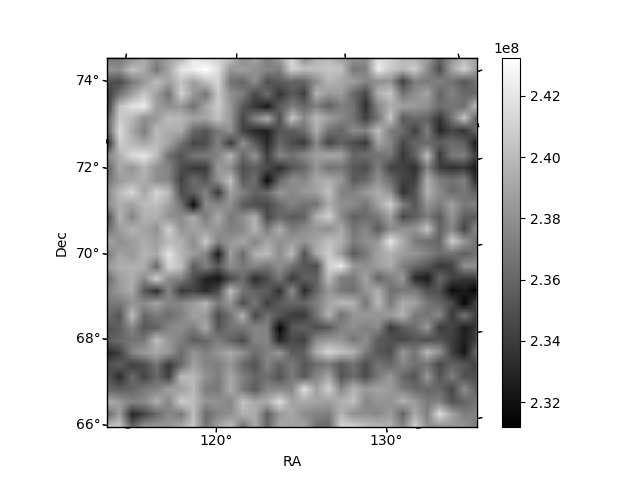
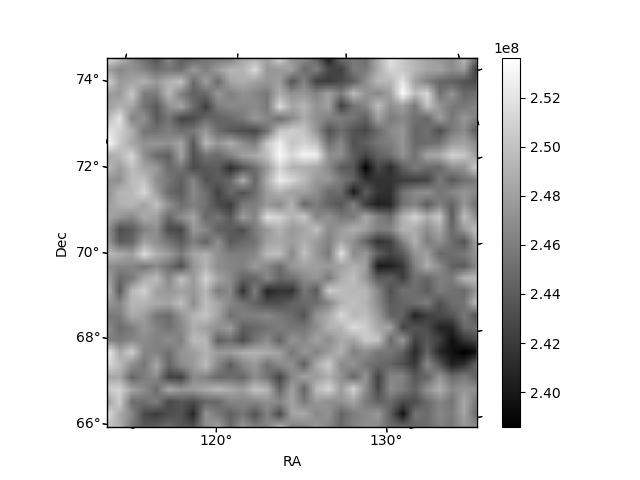
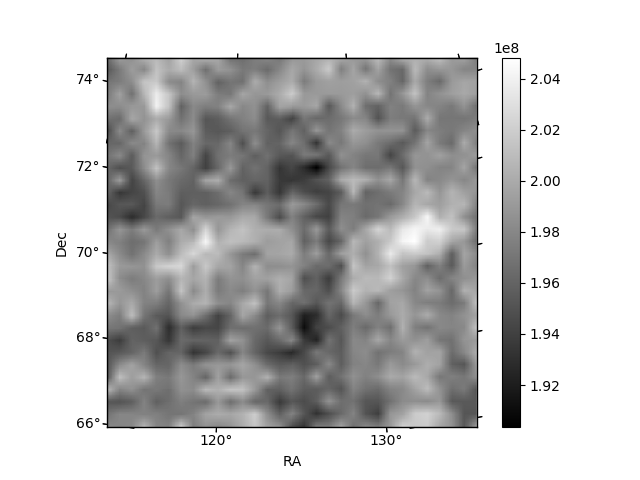
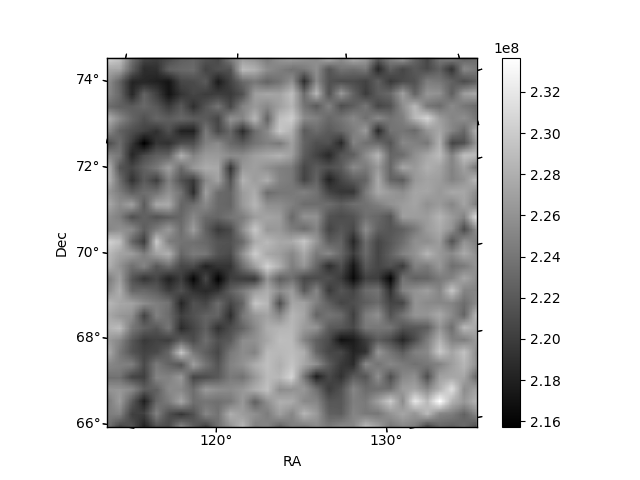
Histogram calculated using DETX and DETY for each event in the final _common_clean file
| Quadrant A | 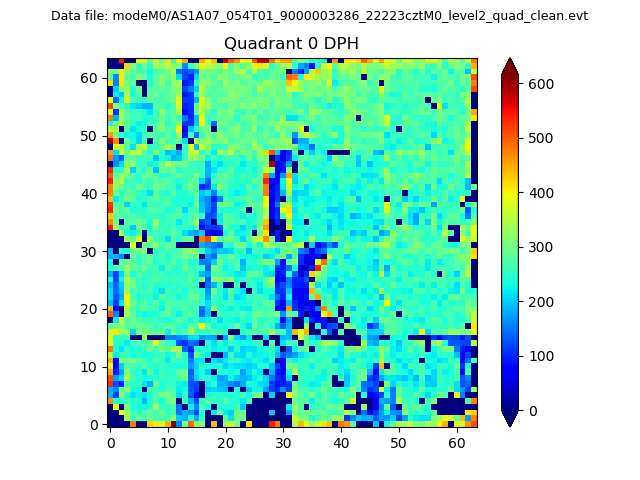 |
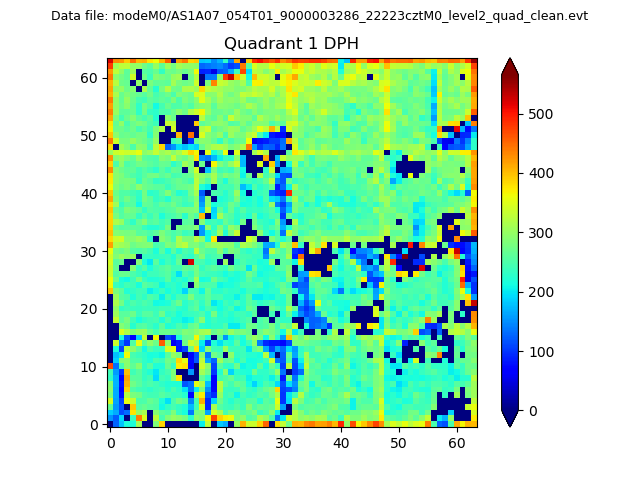 |
Quadrant B |
|---|---|---|---|
| Quadrant D | 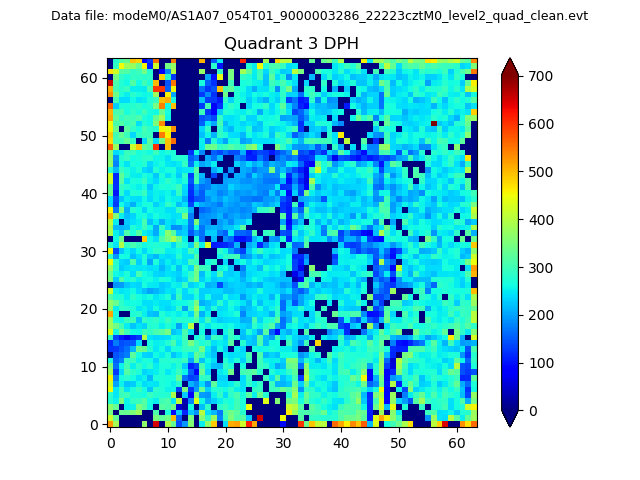 |
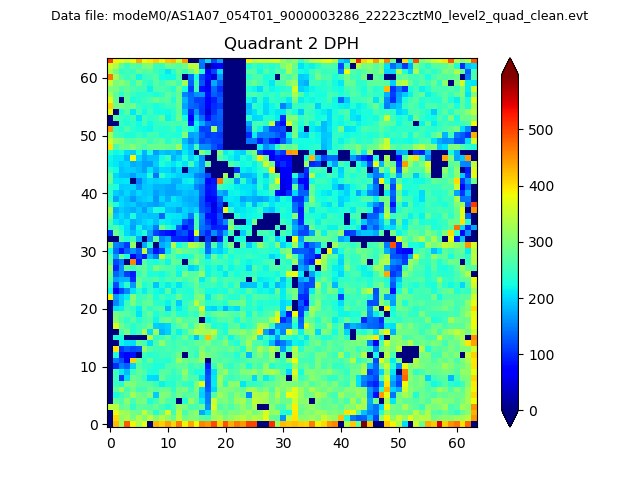 |
Quadrant C |
| Plot type | Count rate plots | Images |
|---|---|---|
| Comparison with Poisson distribution Blue bars denote a histogram of data divided into 1 sec bins. Red curve is a Poisson curve with rate = median count rate of data. |
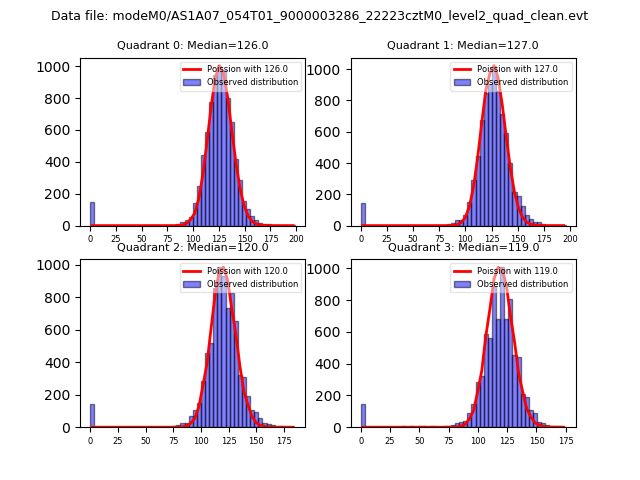 |
 |
| Quadrant-wise count rates Data is divided into 100 sec bins |
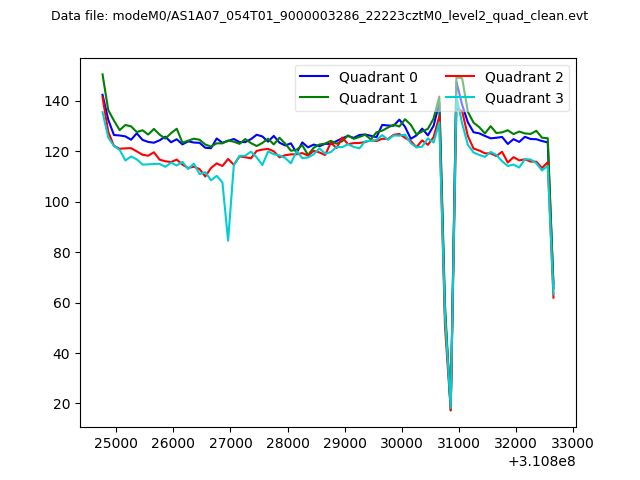 |
|
| Module-wise count rates for Quadrant A Data is divided into 100 sec bins |
 |
 |
| Module-wise count rates for Quadrant B Data is divided into 100 sec bins |
 |
 |
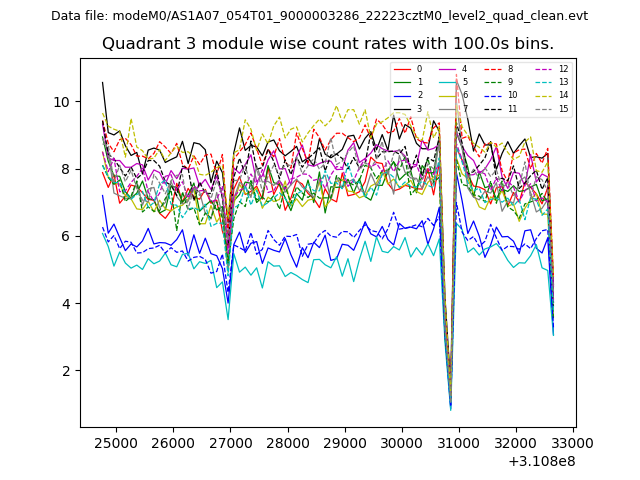
| Module-wise count rates for Quadrant C Data is divided into 100 sec bins |
 |
 |
| Module-wise count rates for Quadrant D Data is divided into 100 sec bins |
 |
 |
| Parameter | Plot |
|---|---|
| CZT HV Monitor |  |
| D_VDD | 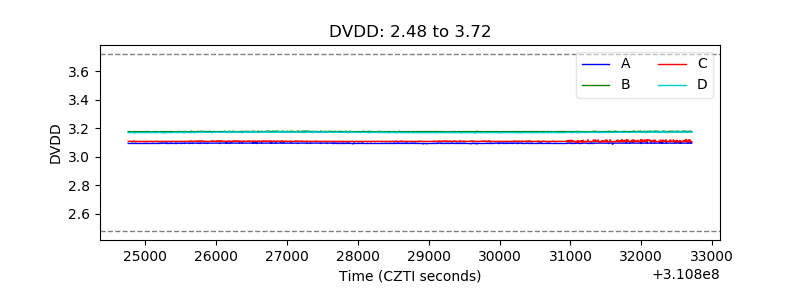 |
| Temperature 1 | 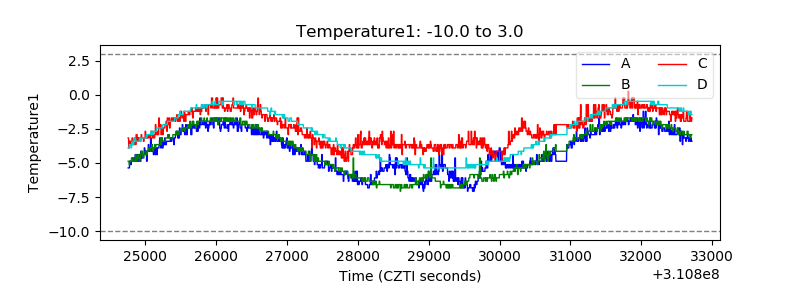 |
| Veto HV Monitor | 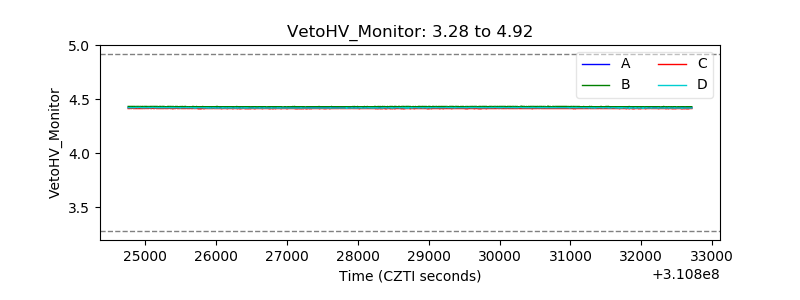 |
| Veto LLD | 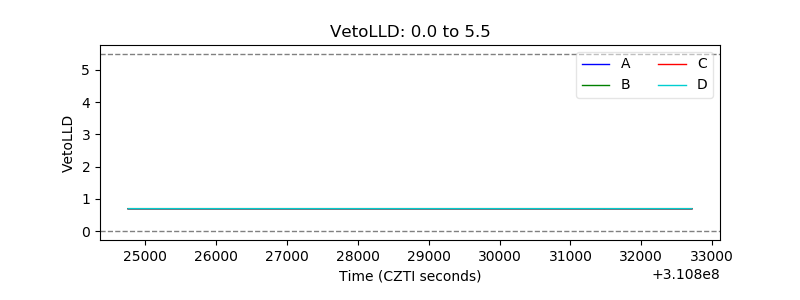 |
| Alpha Counter |  |
| _CPM_Rate | 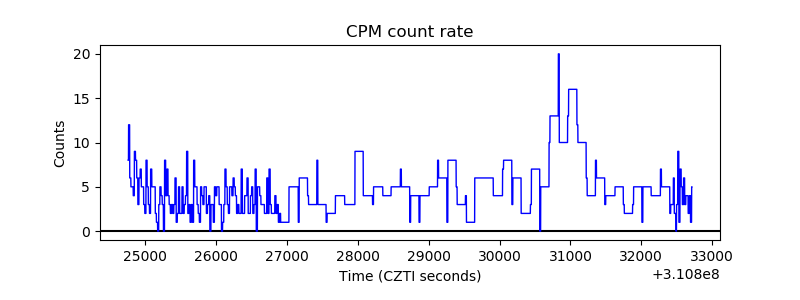 |
| CZT Counter | 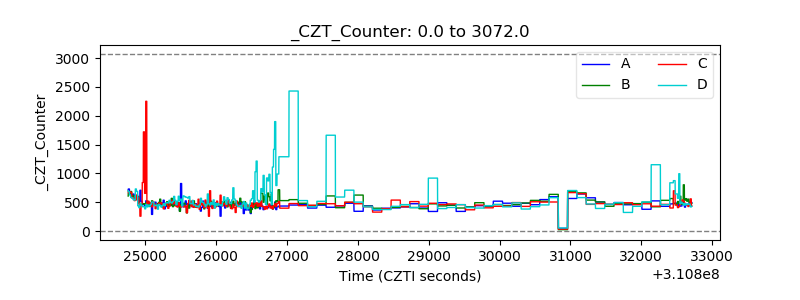 |
| +2.5 Volts monitor | 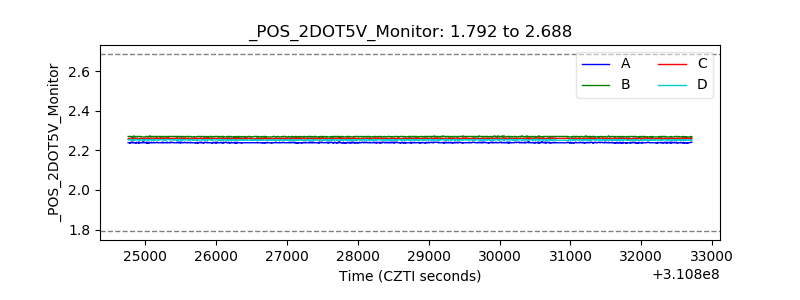 |
| +5 Volts monitor |  |
| _ROLL_ROT | 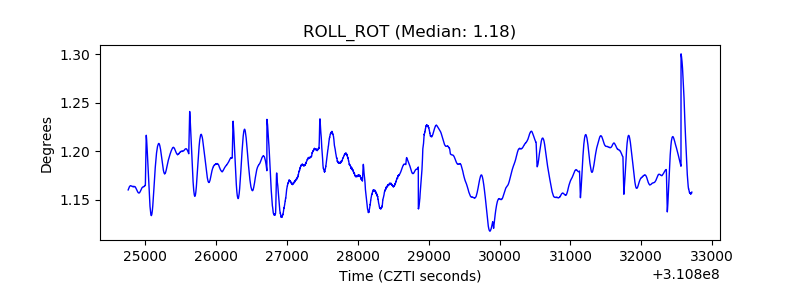 |
| _Roll_DEC |  |
| _Roll_RA | 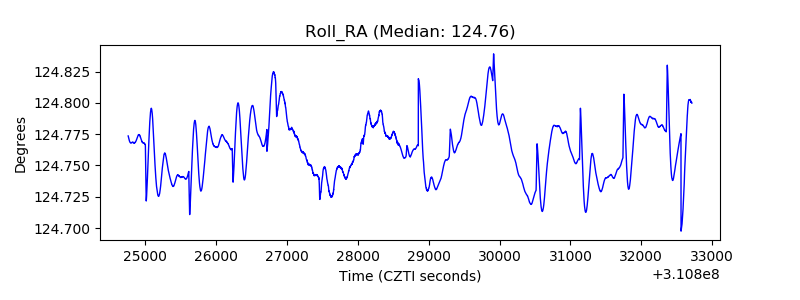 |
| Veto Counter |  |