| Param | Original file | Final file |
|---|---|---|
| Filename | modeM0/AS1A07_054T01_9000003286_22224cztM0_level2.evt | modeM0/AS1A07_054T01_9000003286_22224cztM0_level2_quad_clean.evt |
| Size (bytes) | 449,804,160 | 127,203,840 |
| Size | 429.0 MB | 121.3 MB |
| Events in quadrant A | 3,180,946 | 862,464 |
| Events in quadrant B | 3,294,223 | 866,093 |
| Events in quadrant C | 3,191,622 | 823,931 |
| Events in quadrant D | 3,482,322 | 815,584 |
| Mode M0 | |||
|---|---|---|---|
| Quadrant | BADHDUFLAG | Total packets | Discarded packets |
| A | 0 | 14101 | 1 |
| B | 0 | 14231 | 1 |
| C | 0 | 14037 | 1 |
| D | 0 | 15208 | 1 |
| Mode M9 | |||
|---|---|---|---|
| Quadrant | BADHDUFLAG | Total packets | Discarded packets |
| A | 0 | 3 | 0 |
| B | 0 | 3 | 0 |
| C | 0 | 3 | 0 |
| D | 0 | 3 | 0 |
| Mode SS | |||
|---|---|---|---|
| Quadrant | BADHDUFLAG | Total packets | Discarded packets |
| A | 0 | 144 | 0 |
| B | 0 | 144 | 0 |
| C | 0 | 144 | 0 |
| D | 0 | 144 | 0 |
| Quadrant | Total seconds | Saturated seconds | Saturation percentage |
|---|---|---|---|
| A | 6949 | 23 | 0.330983% |
| B | 6950 | 40 | 0.575540% |
| C | 6950 | 76 | 1.093525% |
| D | 6950 | 40 | 0.575540% |
Noise dominated data is calculated using 1-second bins in cleaned event files. If a bin has >2000 counts, and if more than 50% of those come from <1% of pixels, then it is considered to be noise-dominated and hence unusable.
| Quadrant | # 1 sec bins | Bins with >0 counts | Bins with >2000 counts | High rate bins dominated by noise | Noise dominated (total time) | Noise dominated (detector-on time) | Marked lightcurve |
|---|---|---|---|---|---|---|---|
| A | 7324 | 6950 | 1 | 1 | 0.01% | 0.01% | 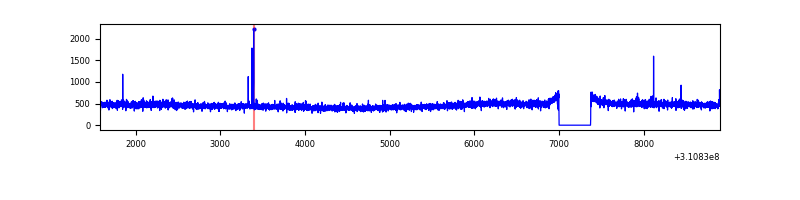 |
| B | 7325 | 6951 | 1 | 1 | 0.01% | 0.01% | 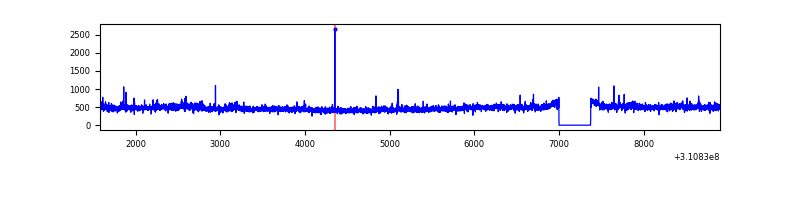 |
| C | 7325 | 6951 | 0 | 0 | 0.00% | 0.00% | 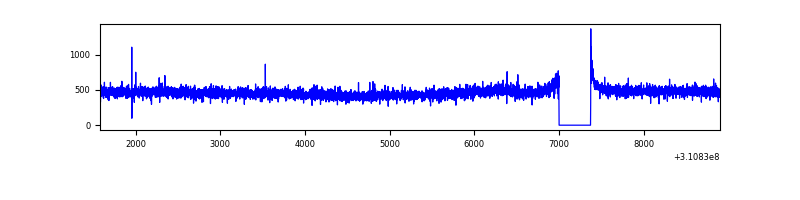 |
| D | 7325 | 6951 | 7 | 7 | 0.10% | 0.10% | 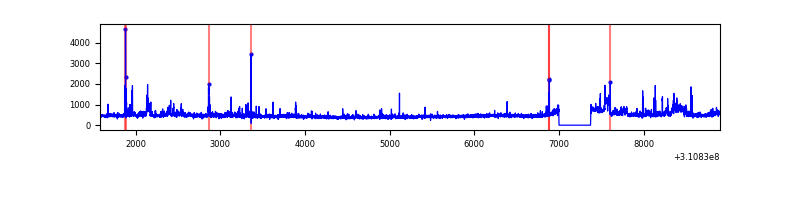 |
Top three noisy pixels from each quadrant. If the there are fewer than three noisy pixels in the level2.evt file, extra rows are filled as -1
| Pixel properties | Quadrant properties | ||||||
|---|---|---|---|---|---|---|---|
| Quadrant | DetID | PixID | Counts | Sigma | Mean | Median | Sigma |
| A | 5 | 168 | 15916 | 90.63 | 820 | 799 | 166.8 |
| A | 13 | 254 | 10764 | 59.74 | 820 | 799 | 166.8 |
| A | 3 | 137 | 7312 | 39.05 | 820 | 799 | 166.8 |
| B | 0 | 245 | 62363 | 395.13 | 812 | 791 | 155.8 |
| B | 0 | 190 | 24214 | 150.31 | 812 | 791 | 155.8 |
| B | 12 | 111 | 18931 | 116.41 | 812 | 791 | 155.8 |
| C | 14 | 238 | 123542 | 672.14 | 781 | 784 | 182.6 |
| C | 8 | 128 | 10616 | 53.83 | 781 | 784 | 182.6 |
| C | 0 | 10 | 7047 | 34.29 | 781 | 784 | 182.6 |
| D | 12 | 227 | 103341 | 528.59 | 795 | 770 | 194.0 |
| D | 2 | 16 | 84369 | 430.82 | 795 | 770 | 194.0 |
| D | 1 | 52 | 73170 | 373.11 | 795 | 770 | 194.0 |
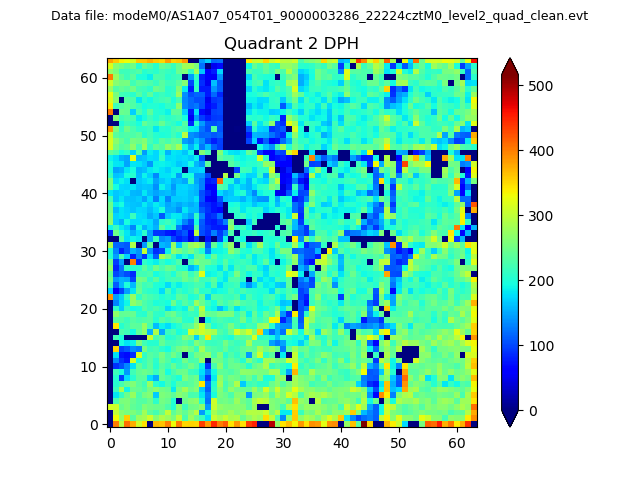
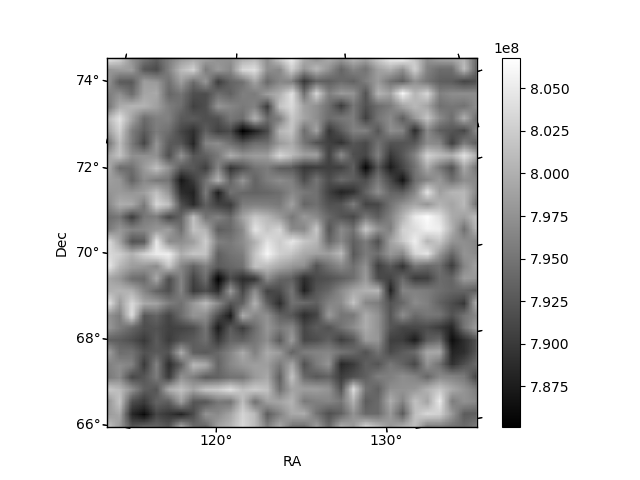
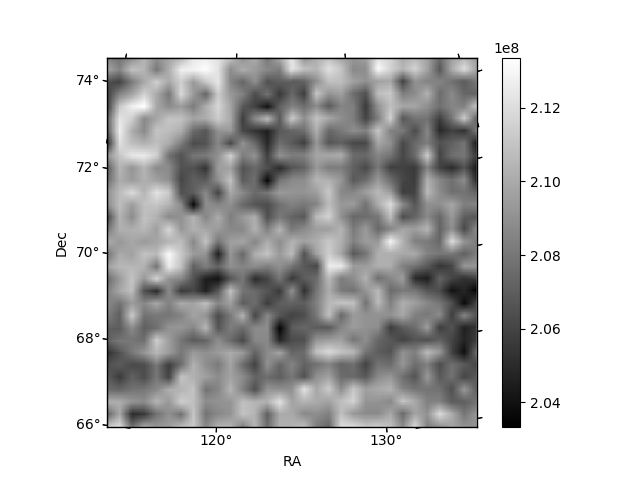
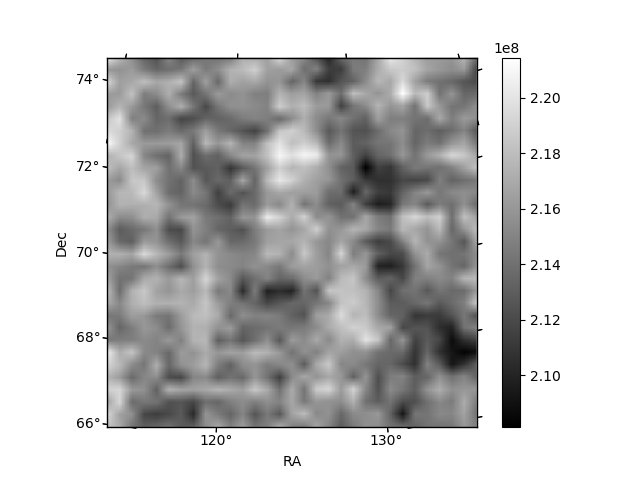
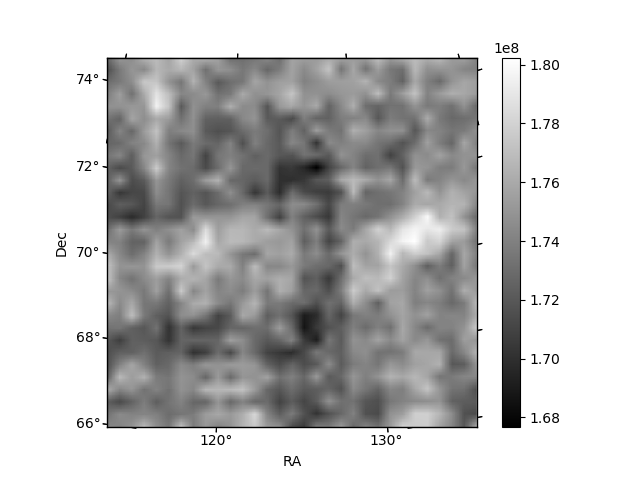
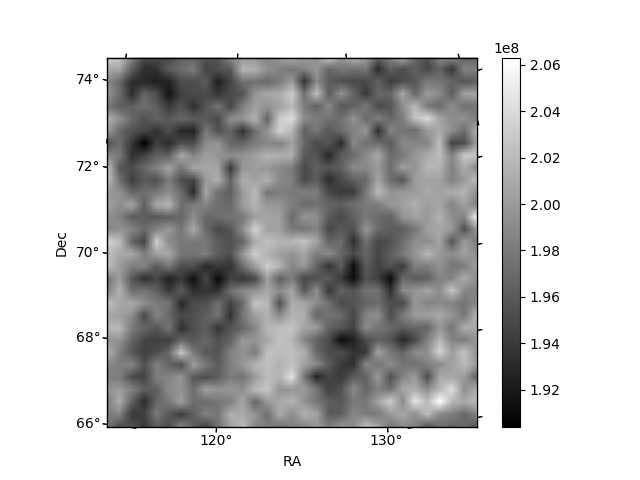
Histogram calculated using DETX and DETY for each event in the final _common_clean file
| Quadrant A | 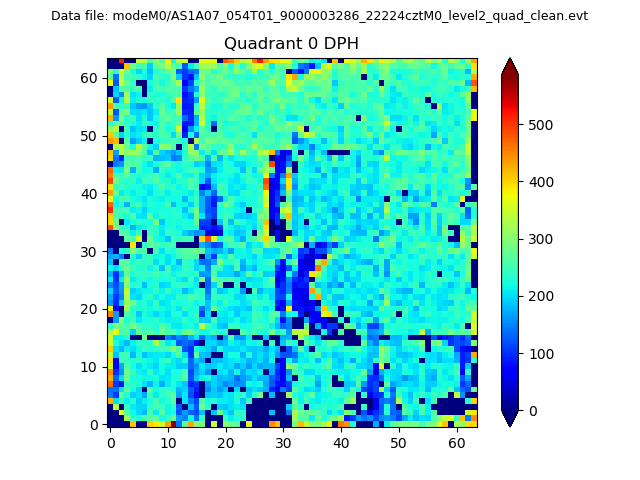 |
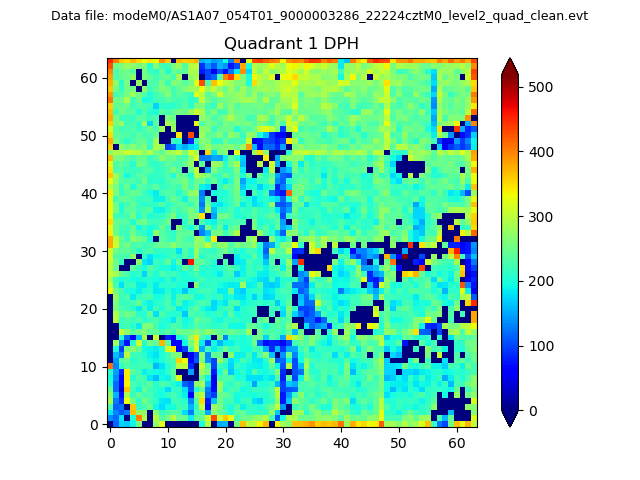 |
Quadrant B |
|---|---|---|---|
| Quadrant D | 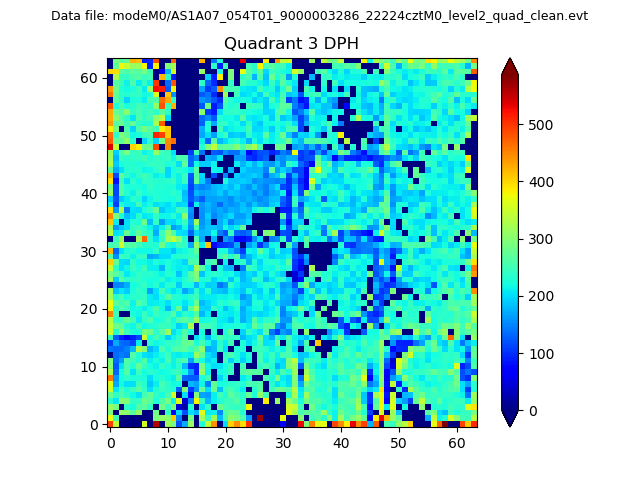 |
 |
Quadrant C |
| Plot type | Count rate plots | Images |
|---|---|---|
| Comparison with Poisson distribution Blue bars denote a histogram of data divided into 1 sec bins. Red curve is a Poisson curve with rate = median count rate of data. |
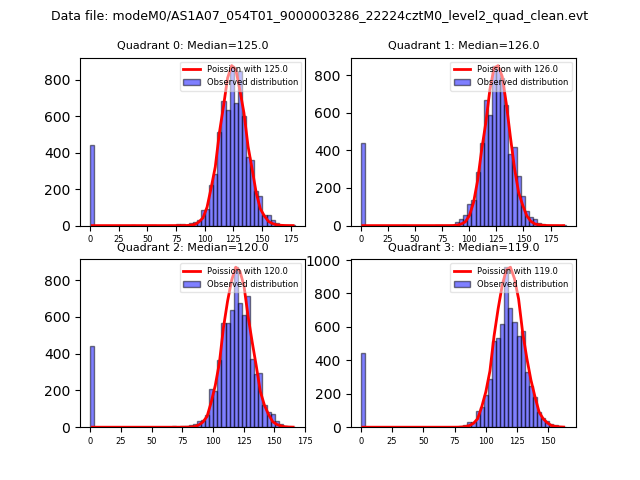 |
 |
| Quadrant-wise count rates Data is divided into 100 sec bins |
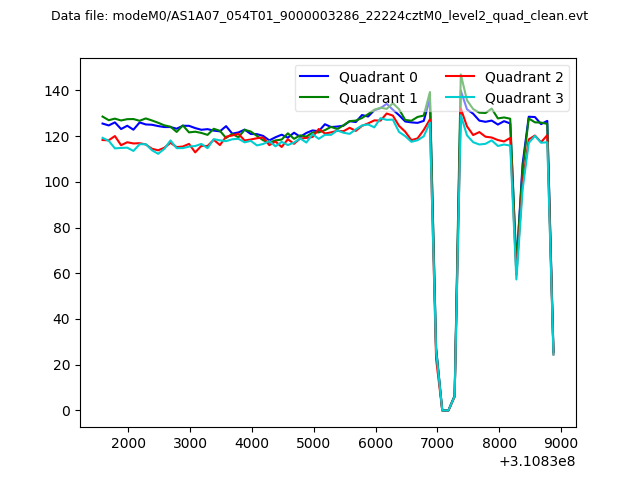 |
|
| Module-wise count rates for Quadrant A Data is divided into 100 sec bins |
 |
 |
| Module-wise count rates for Quadrant B Data is divided into 100 sec bins |
 |
 |
| Module-wise count rates for Quadrant C Data is divided into 100 sec bins |
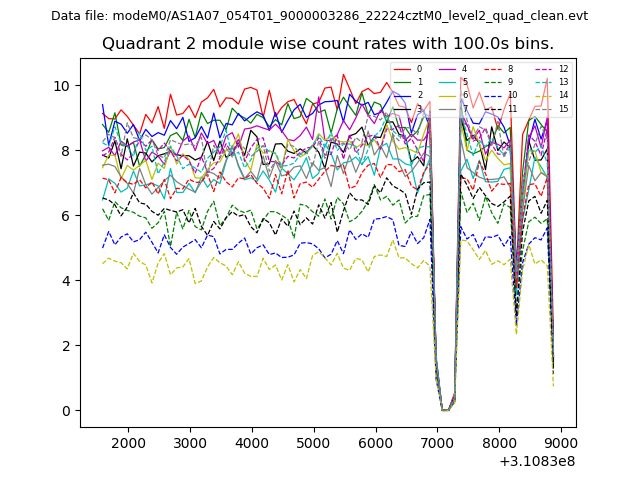 |
 |
| Module-wise count rates for Quadrant D Data is divided into 100 sec bins |
 |
 |
| Parameter | Plot |
|---|---|
| CZT HV Monitor |  |
| D_VDD |  |
| Temperature 1 | 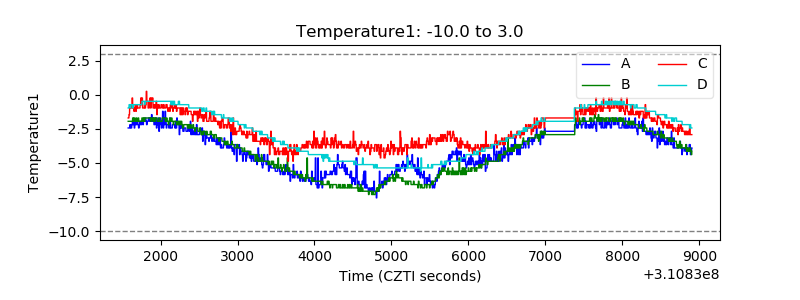 |
| Veto HV Monitor | 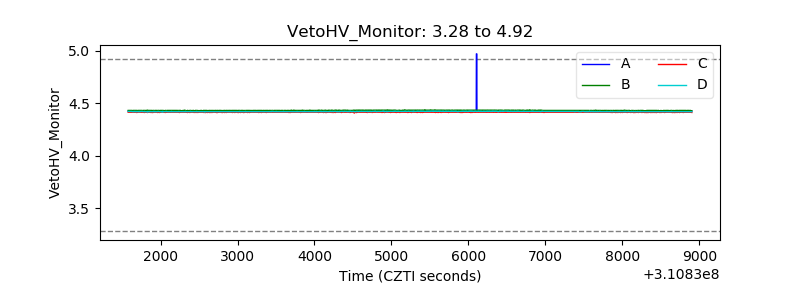 |
| Veto LLD |  |
| Alpha Counter | 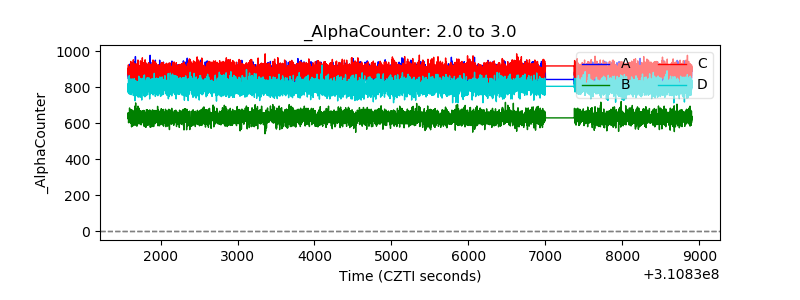 |
| _CPM_Rate | 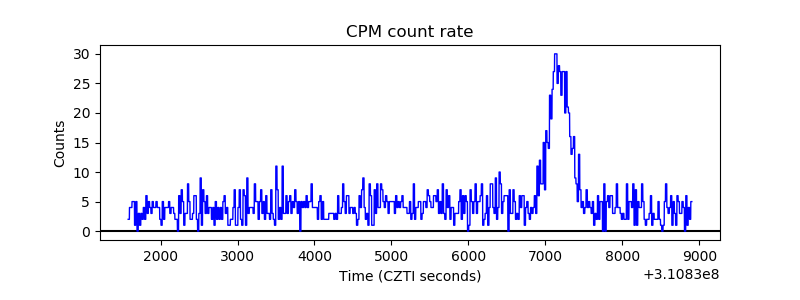 |
| CZT Counter | 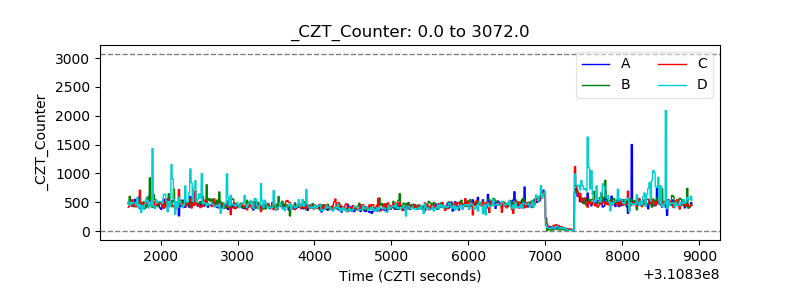 |
| +2.5 Volts monitor |  |
| +5 Volts monitor | 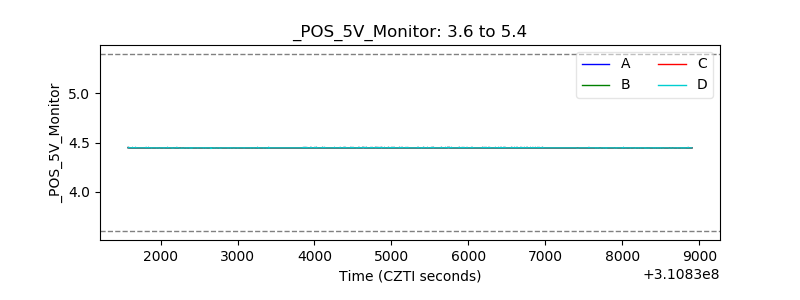 |
| _ROLL_ROT |  |
| _Roll_DEC | 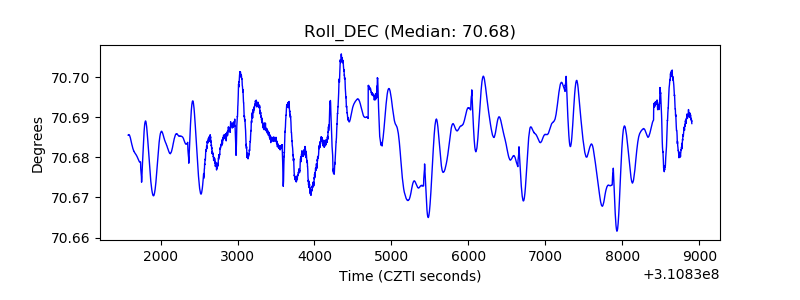 |
| _Roll_RA | 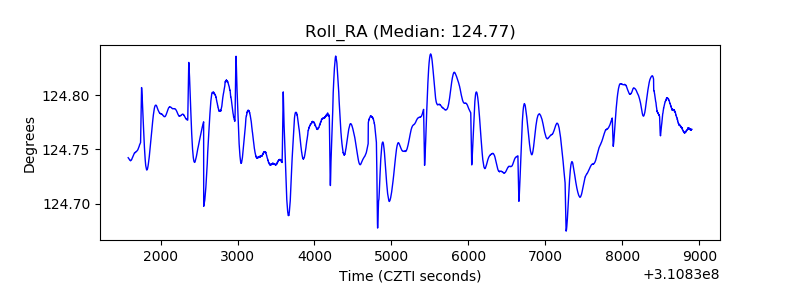 |
| Veto Counter |  |