| Param | Original file | Final file |
|---|---|---|
| Filename | modeM0/AS1A07_018T02_9000003288cztM0_level2.fits | modeM0/AS1A07_018T02_9000003288cztM0_level2_quad_clean.evt |
| Size (bytes) | 103,518,720 | 84,263,040 |
| Size | 98.7 MB | 80.4 MB |
| Events in quadrant A | 648,764 | 482,660 |
| Events in quadrant B | 625,188 | 490,619 |
| Events in quadrant C | 621,364 | 458,875 |
| Events in quadrant D | 541,530 | 420,049 |
| Mode M0 | |||
|---|---|---|---|
| Quadrant | BADHDUFLAG | Total packets | Discarded packets |
| A | 0 | 21035 | 0 |
| B | 0 | 21144 | 0 |
| C | 0 | 20888 | 0 |
| D | 0 | 23753 | 0 |
| Mode M9 | |||
|---|---|---|---|
| Quadrant | BADHDUFLAG | Total packets | Discarded packets |
| A | 0 | 18 | 0 |
| B | 0 | 19 | 0 |
| C | 0 | 19 | 0 |
| D | 0 | 19 | 0 |
| Mode SS | |||
|---|---|---|---|
| Quadrant | BADHDUFLAG | Total packets | Discarded packets |
| A | 0 | 206 | 0 |
| B | 0 | 206 | 0 |
| C | 0 | 206 | 0 |
| D | 0 | 206 | 0 |
| Quadrant | Total seconds | Saturated seconds | Saturation percentage |
|---|---|---|---|
| A | 10085 | 42 | 0.416460% |
| B | 10085 | 64 | 0.634606% |
| C | 10085 | 75 | 0.743679% |
| D | 10085 | 63 | 0.624690% |
Noise dominated data is calculated using 1-second bins in cleaned event files. If a bin has >2000 counts, and if more than 50% of those come from <1% of pixels, then it is considered to be noise-dominated and hence unusable.
| Quadrant | # 1 sec bins | Bins with >0 counts | Bins with >2000 counts | High rate bins dominated by noise | Noise dominated (total time) | Noise dominated (detector-on time) | Marked lightcurve |
|---|---|---|---|---|---|---|---|
| A | 11244 | 10084 | 0 | 0 | 0.00% | 0.00% | 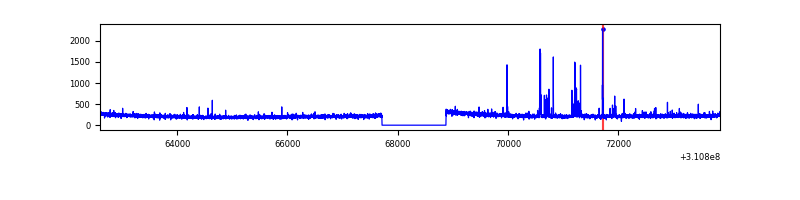 |
| B | 11244 | 10084 | 0 | 0 | 0.00% | 0.00% |  |
| C | 11244 | 10084 | 0 | 0 | 0.00% | 0.00% |  |
| D | 11244 | 10084 | 0 | 0 | 0.00% | 0.00% |  |
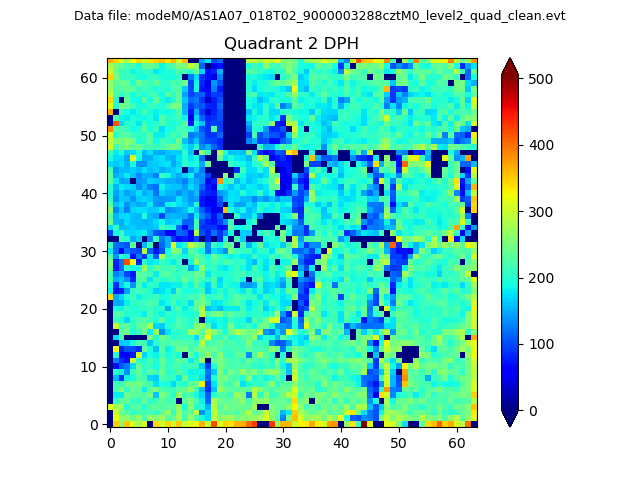
Top three noisy pixels from each quadrant. If the there are fewer than three noisy pixels in the level2.evt file, extra rows are filled as -1
| Pixel properties | Quadrant properties | ||||||
|---|---|---|---|---|---|---|---|
| Quadrant | DetID | PixID | Counts | Sigma | Mean | Median | Sigma |
| A | 0 | 29 | 645 | 11.45 | 168 | 159 | 42.5 |
| A | 0 | 30 | 513 | 8.34 | 168 | 159 | 42.5 |
| A | 9 | 19 | 506 | 8.17 | 168 | 159 | 42.5 |
| B | 2 | 9 | 519 | 10.22 | 165 | 157 | 35.4 |
| B | 2 | 8 | 442 | 8.05 | 165 | 157 | 35.4 |
| B | 3 | 80 | 429 | 7.68 | 165 | 157 | 35.4 |
| C | 12 | 241 | 463 | 7.13 | 163 | 153 | 43.4 |
| C | 3 | 203 | 460 | 7.07 | 163 | 153 | 43.4 |
| C | 3 | 202 | 455 | 6.95 | 163 | 153 | 43.4 |
| D | 7 | 3 | 401 | 6.06 | 154 | 140 | 43.0 |
| D | 4 | 160 | 381 | 5.6 | 154 | 140 | 43.0 |
| D | 7 | 5 | 377 | 5.51 | 154 | 140 | 43.0 |
Histogram calculated using DETX and DETY for each event in the final _common_clean file
| Quadrant A | 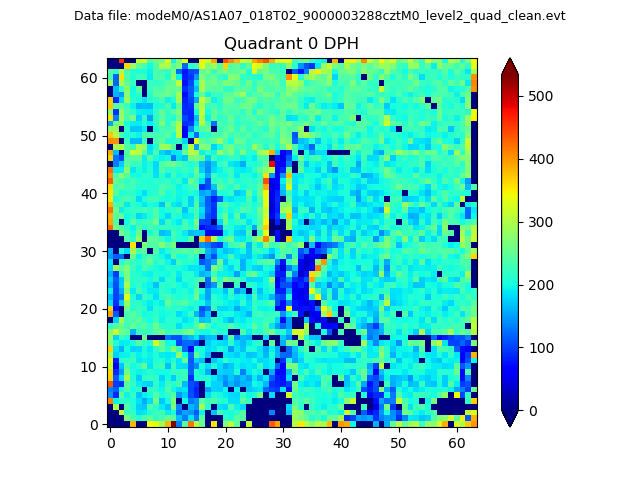 |
 |
Quadrant B |
|---|---|---|---|
| Quadrant D | 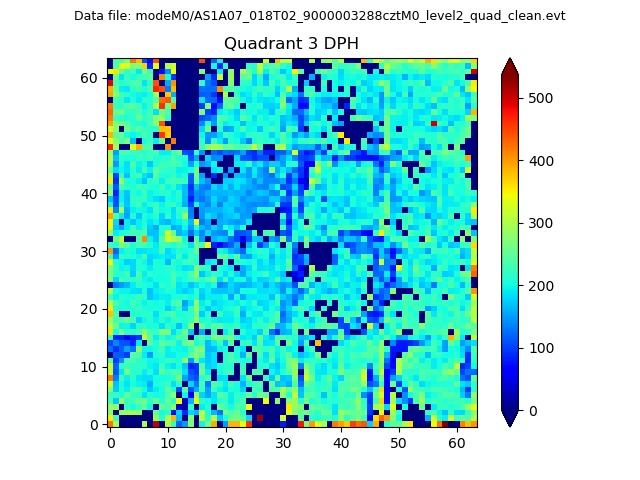 |
 |
Quadrant C |
| Plot type | Count rate plots | Images |
|---|---|---|
| Comparison with Poisson distribution Blue bars denote a histogram of data divided into 1 sec bins. Red curve is a Poisson curve with rate = median count rate of data. |
 |
 |
| Quadrant-wise count rates Data is divided into 100 sec bins |
 |
|
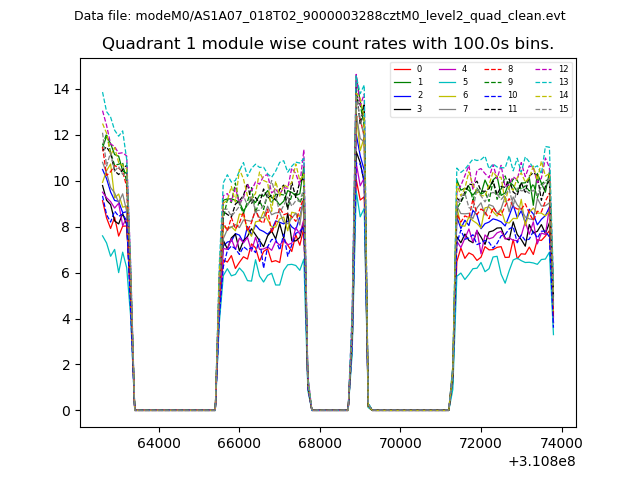
| Module-wise count rates for Quadrant A Data is divided into 100 sec bins |
 |
 |
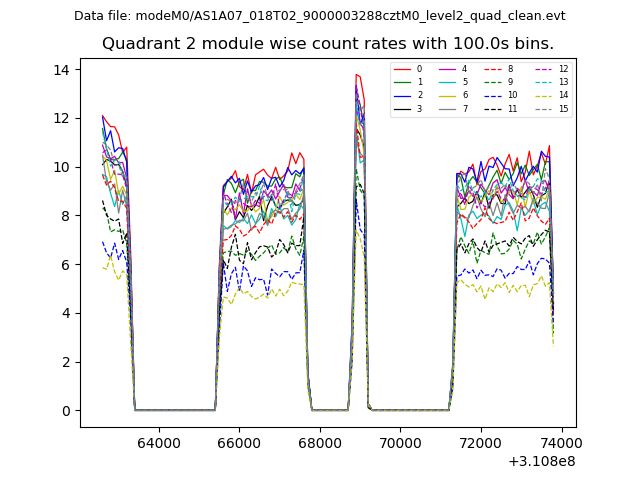
| Module-wise count rates for Quadrant B Data is divided into 100 sec bins |
 |
 |
| Module-wise count rates for Quadrant C Data is divided into 100 sec bins |
 |
 |
| Module-wise count rates for Quadrant D Data is divided into 100 sec bins |
 |
 |
| Parameter | Plot |
|---|---|
| CZT HV Monitor | 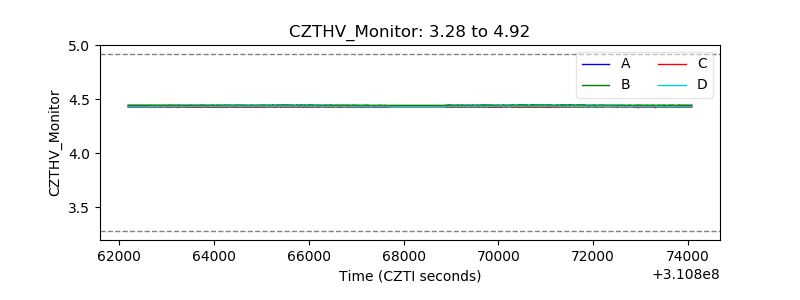 |
| D_VDD | 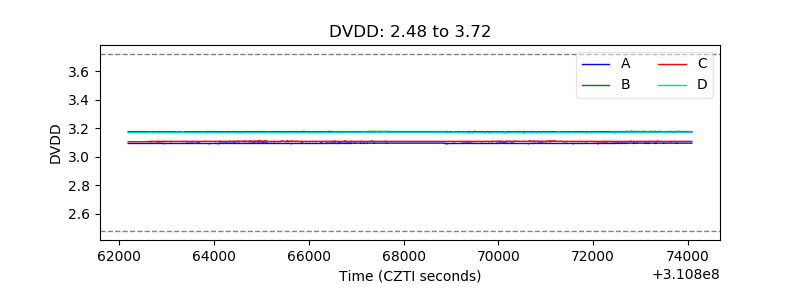 |
| Temperature 1 |  |
| Veto HV Monitor |  |
| Veto LLD | 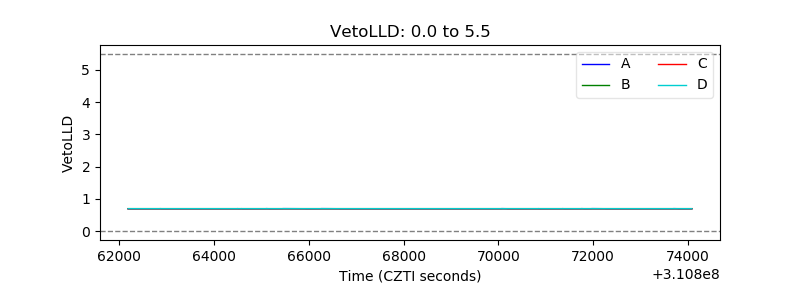 |
| Alpha Counter |  |
| _CPM_Rate |  |
| CZT Counter |  |
| +2.5 Volts monitor |  |
| +5 Volts monitor | 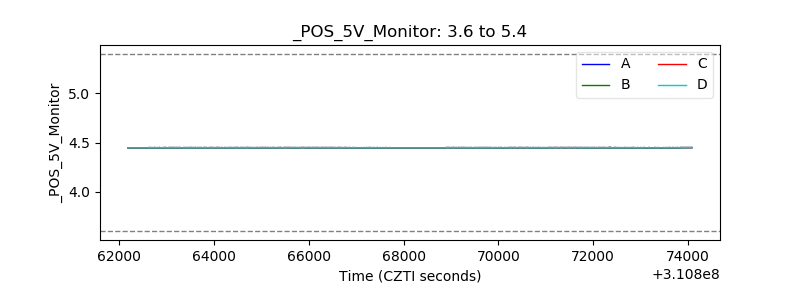 |
| _ROLL_ROT |  |
| _Roll_DEC | 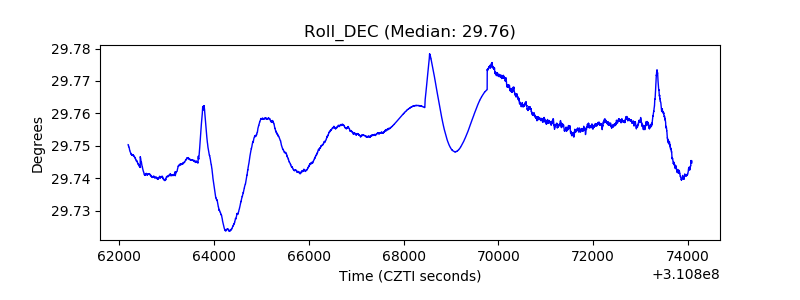 |
| _Roll_RA |  |
| Veto Counter |  |