| Param | Original file | Final file |
|---|---|---|
| Filename | modeM0/AS1A07_018T02_9000003288_22231cztM0_level2.evt | modeM0/AS1A07_018T02_9000003288_22231cztM0_level2_quad_clean.evt |
| Size (bytes) | 363,752,640 | 62,951,040 |
| Size | 346.9 MB | 60.0 MB |
| Events in quadrant A | 2,569,571 | 396,965 |
| Events in quadrant B | 2,528,515 | 409,107 |
| Events in quadrant C | 2,481,428 | 382,745 |
| Events in quadrant D | 3,098,308 | 368,479 |
| Mode M0 | |||
|---|---|---|---|
| Quadrant | BADHDUFLAG | Total packets | Discarded packets |
| A | 0 | 10606 | 1 |
| B | 0 | 10502 | 1 |
| C | 0 | 10404 | 1 |
| D | 0 | 12613 | 1 |
| Mode M9 | |||
|---|---|---|---|
| Quadrant | BADHDUFLAG | Total packets | Discarded packets |
| A | 0 | 10 | 0 |
| B | 0 | 11 | 0 |
| C | 0 | 11 | 0 |
| D | 0 | 11 | 0 |
| Mode SS | |||
|---|---|---|---|
| Quadrant | BADHDUFLAG | Total packets | Discarded packets |
| A | 0 | 102 | 0 |
| B | 0 | 102 | 0 |
| C | 0 | 102 | 0 |
| D | 0 | 102 | 0 |
| Quadrant | Total seconds | Saturated seconds | Saturation percentage |
|---|---|---|---|
| A | 4970 | 22 | 0.442656% |
| B | 4970 | 22 | 0.442656% |
| C | 4970 | 26 | 0.523139% |
| D | 4970 | 39 | 0.784708% |
Noise dominated data is calculated using 1-second bins in cleaned event files. If a bin has >2000 counts, and if more than 50% of those come from <1% of pixels, then it is considered to be noise-dominated and hence unusable.
| Quadrant | # 1 sec bins | Bins with >0 counts | Bins with >2000 counts | High rate bins dominated by noise | Noise dominated (total time) | Noise dominated (detector-on time) | Marked lightcurve |
|---|---|---|---|---|---|---|---|
| A | 4970 | 4970 | 6 | 6 | 0.12% | 0.12% | 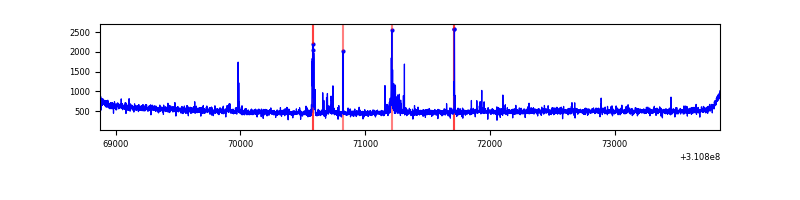 |
| B | 4970 | 4970 | 0 | 0 | 0.00% | 0.00% | 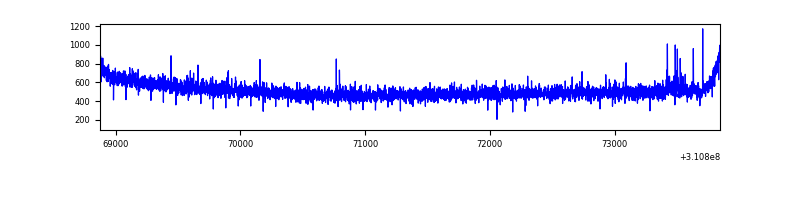 |
| C | 4970 | 4970 | 0 | 0 | 0.00% | 0.00% | 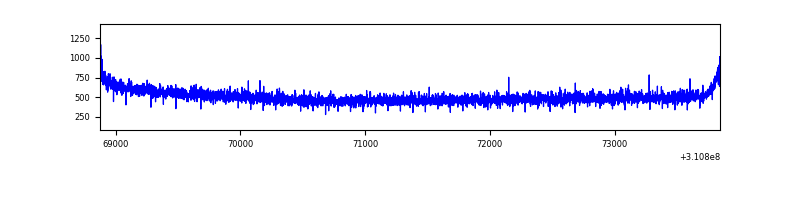 |
| D | 4970 | 4970 | 5 | 5 | 0.10% | 0.10% | 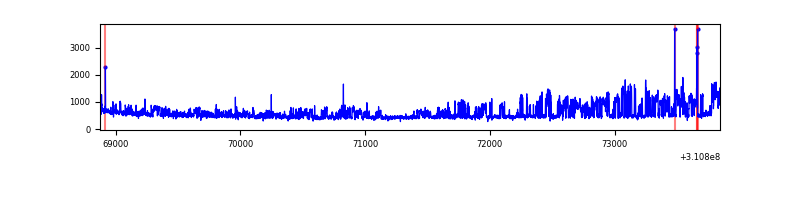 |
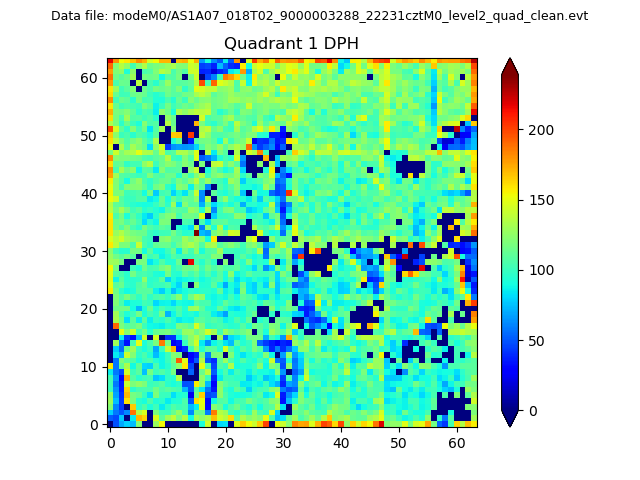
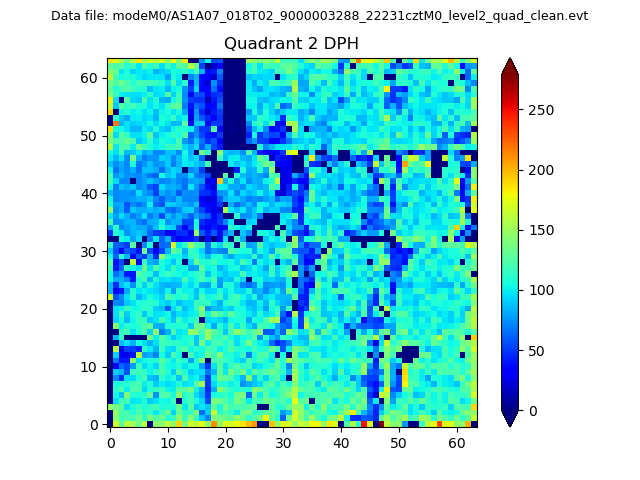
Top three noisy pixels from each quadrant. If the there are fewer than three noisy pixels in the level2.evt file, extra rows are filled as -1
| Pixel properties | Quadrant properties | ||||||
|---|---|---|---|---|---|---|---|
| Quadrant | DetID | PixID | Counts | Sigma | Mean | Median | Sigma |
| A | 4 | 2 | 96876 | 751.37 | 641 | 627 | 128.1 |
| A | 13 | 254 | 7350 | 52.48 | 641 | 627 | 128.1 |
| A | 0 | 226 | 5497 | 38.02 | 641 | 627 | 128.1 |
| B | 4 | 216 | 14403 | 113.58 | 640 | 626 | 121.3 |
| B | 12 | 111 | 14325 | 112.93 | 640 | 626 | 121.3 |
| B | 11 | 111 | 12926 | 101.4 | 640 | 626 | 121.3 |
| C | 14 | 238 | 99561 | 699.15 | 609 | 614 | 141.5 |
| C | 0 | 10 | 5077 | 31.54 | 609 | 614 | 141.5 |
| C | 13 | 61 | 4138 | 24.9 | 609 | 614 | 141.5 |
| D | 2 | 16 | 707131 | 4733.92 | 614 | 598 | 149.2 |
| D | 1 | 52 | 34662 | 228.24 | 614 | 598 | 149.2 |
| D | 2 | 136 | 19613 | 127.4 | 614 | 598 | 149.2 |
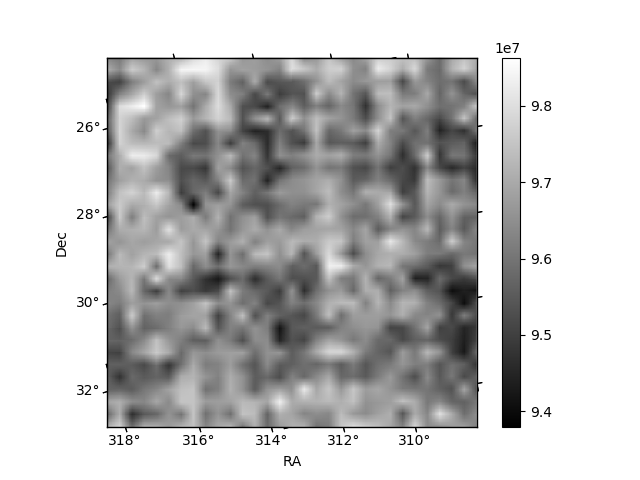
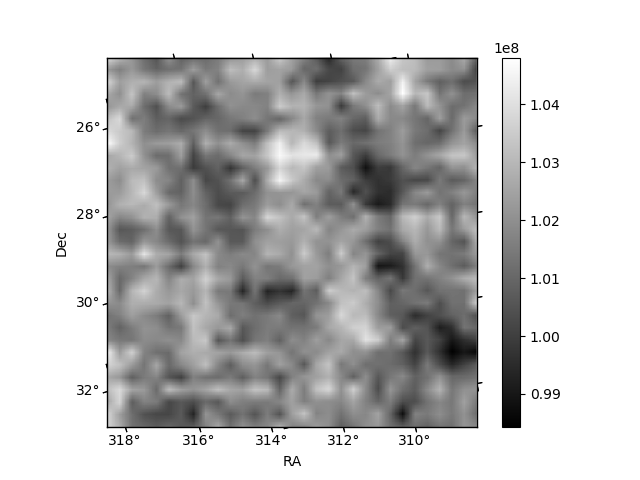
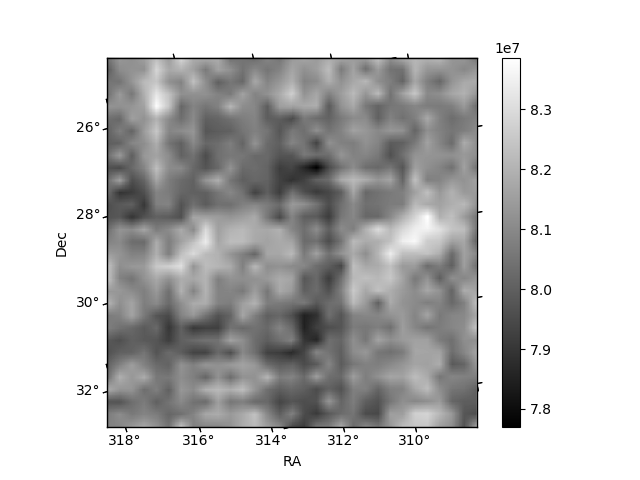
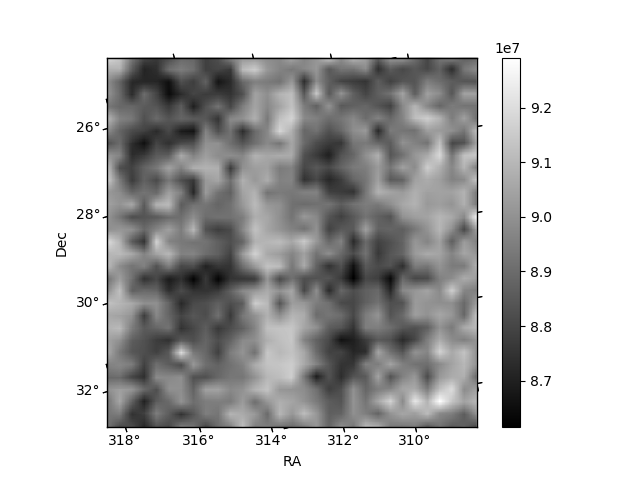
Histogram calculated using DETX and DETY for each event in the final _common_clean file
| Quadrant A | 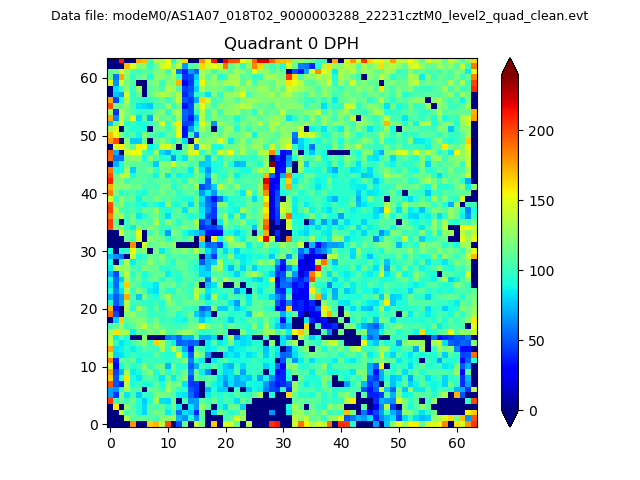 |
 |
Quadrant B |
|---|---|---|---|
| Quadrant D | 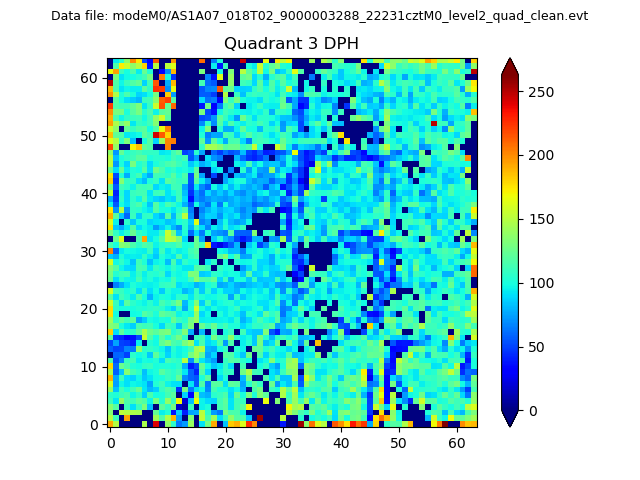 |
 |
Quadrant C |
| Plot type | Count rate plots | Images |
|---|---|---|
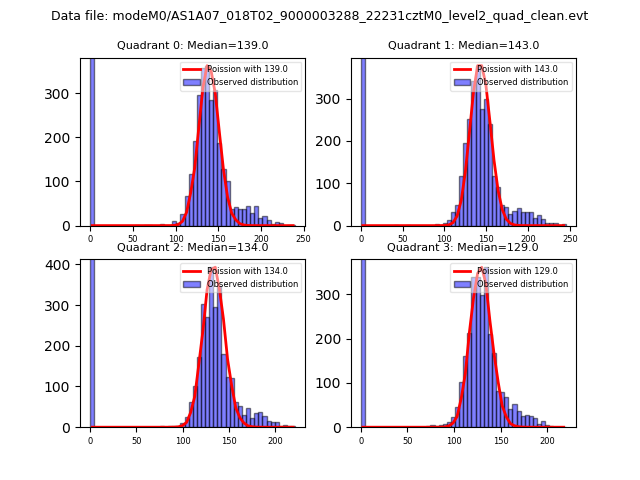
| Comparison with Poisson distribution Blue bars denote a histogram of data divided into 1 sec bins. Red curve is a Poisson curve with rate = median count rate of data. |
 |
 |
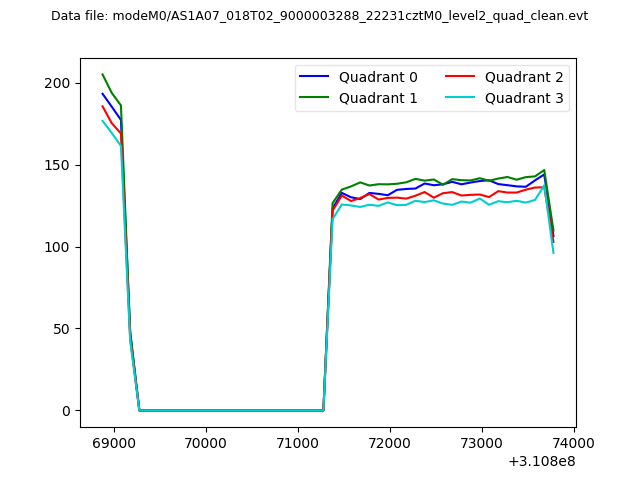
| Quadrant-wise count rates Data is divided into 100 sec bins |
 |
|
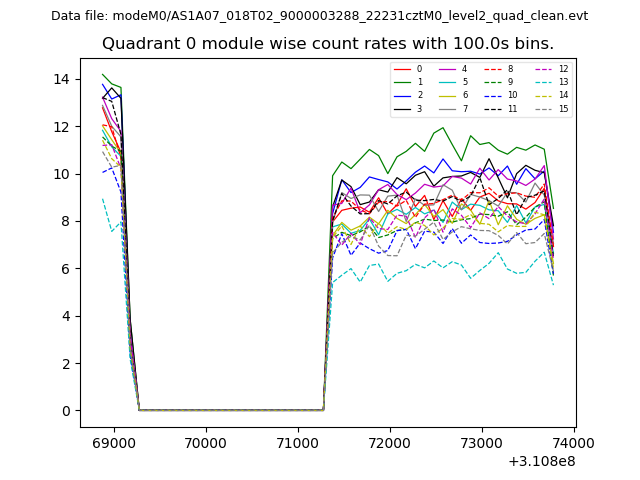
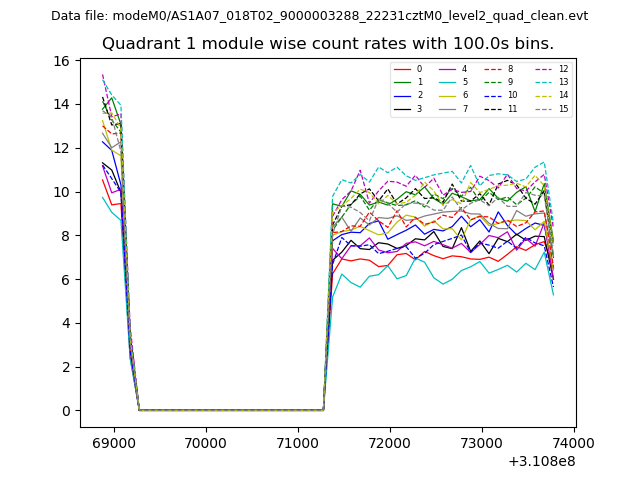
| Module-wise count rates for Quadrant A Data is divided into 100 sec bins |
 |
 |
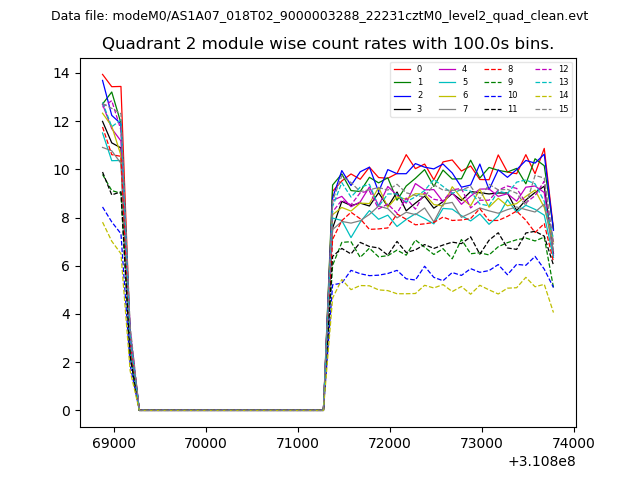
| Module-wise count rates for Quadrant B Data is divided into 100 sec bins |
 |
 |
| Module-wise count rates for Quadrant C Data is divided into 100 sec bins |
 |
 |
| Module-wise count rates for Quadrant D Data is divided into 100 sec bins |
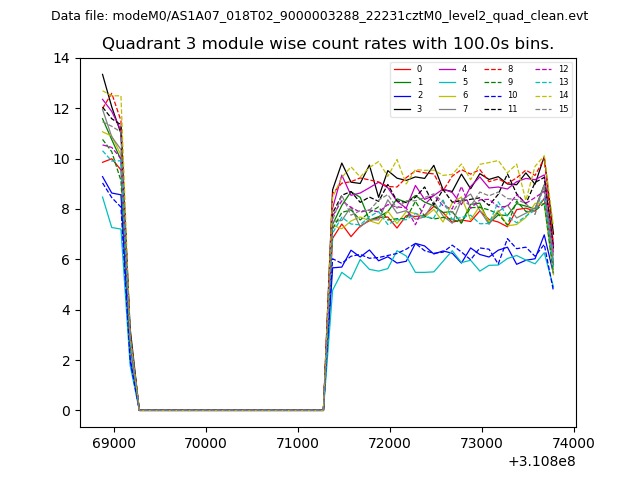 |
 |
| Parameter | Plot |
|---|---|
| CZT HV Monitor | 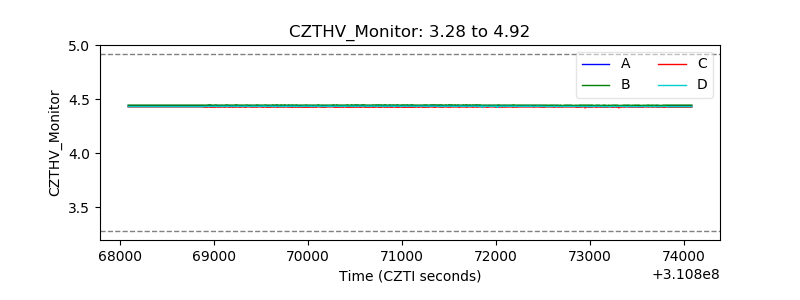 |
| D_VDD | 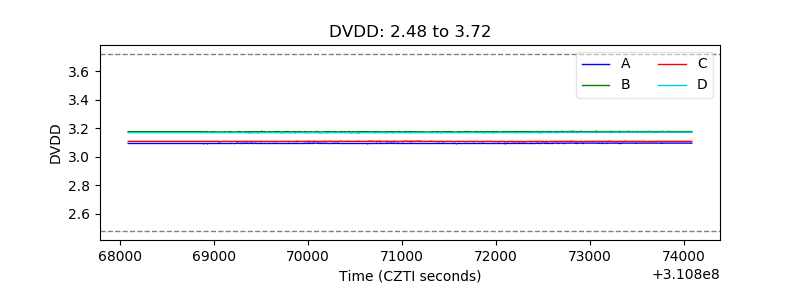 |
| Temperature 1 | 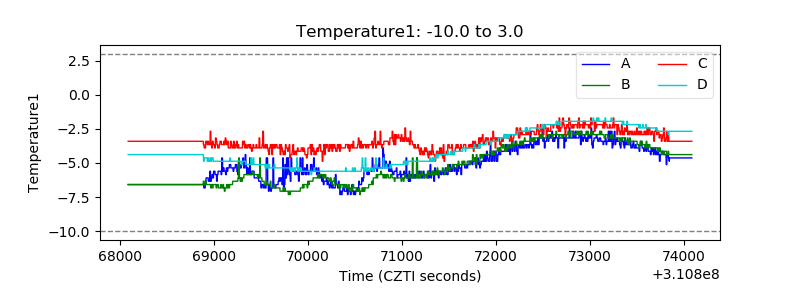 |
| Veto HV Monitor | 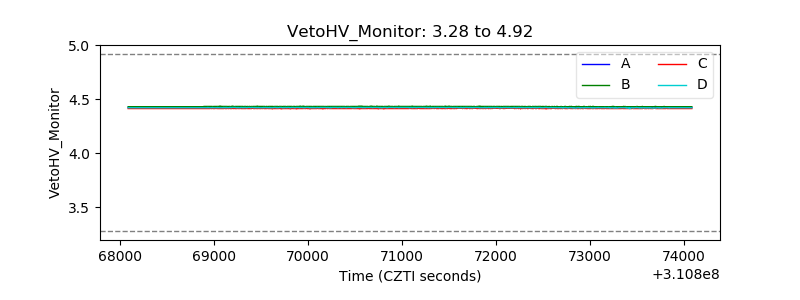 |
| Veto LLD | 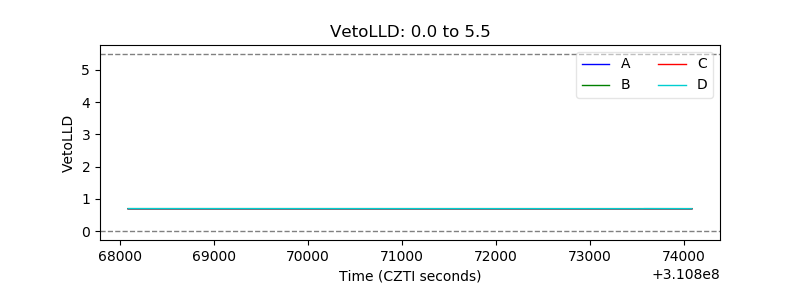 |
| Alpha Counter | 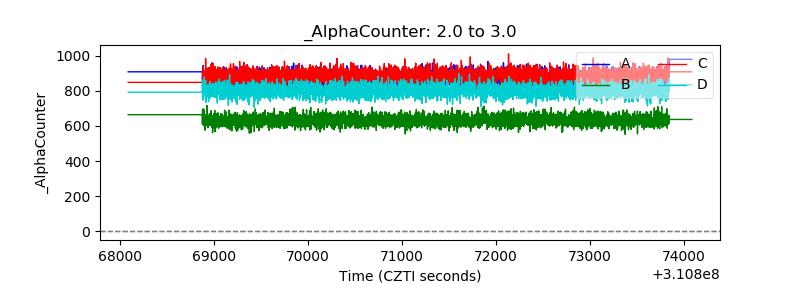 |
| _CPM_Rate | 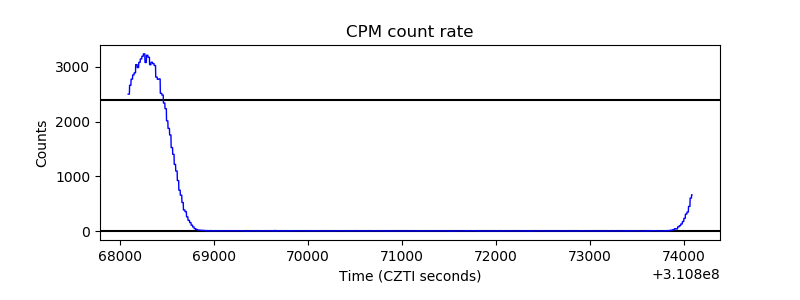 |
| CZT Counter | 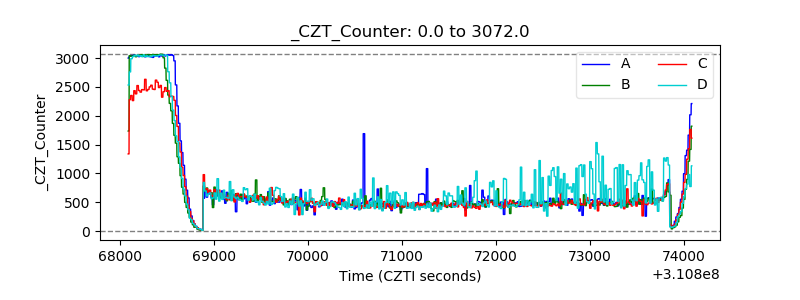 |
| +2.5 Volts monitor | 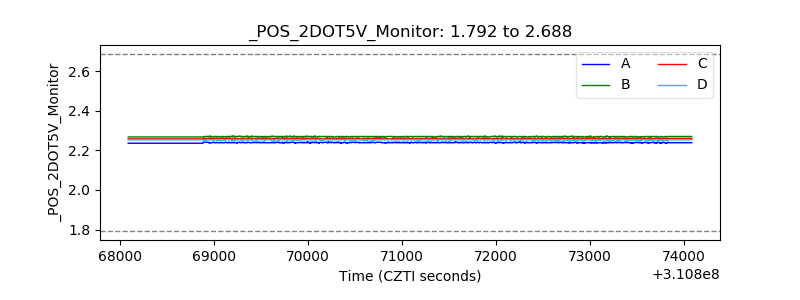 |
| +5 Volts monitor |  |
| _ROLL_ROT | 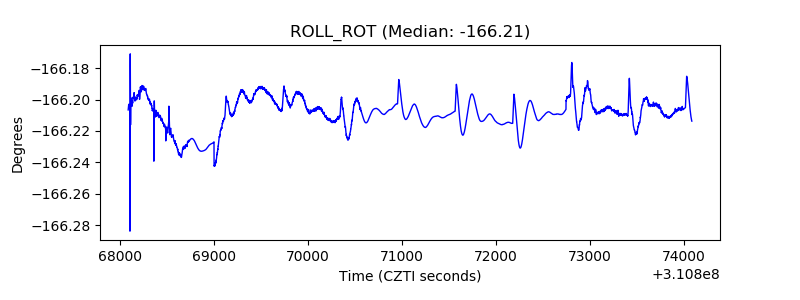 |
| _Roll_DEC | 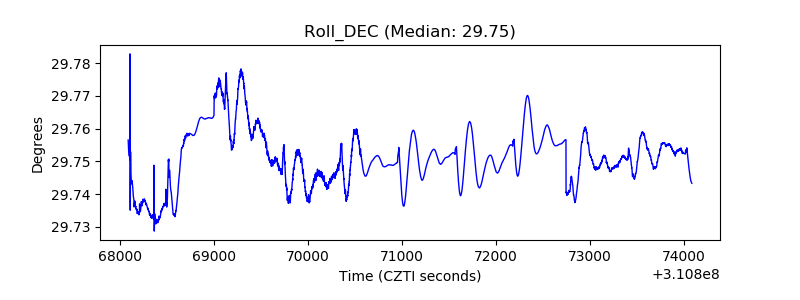 |
| _Roll_RA | 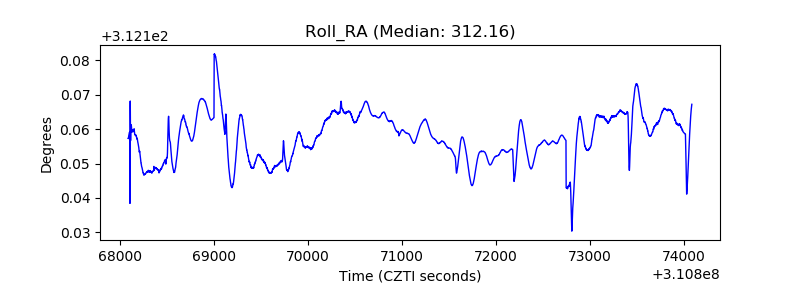 |
| Veto Counter | 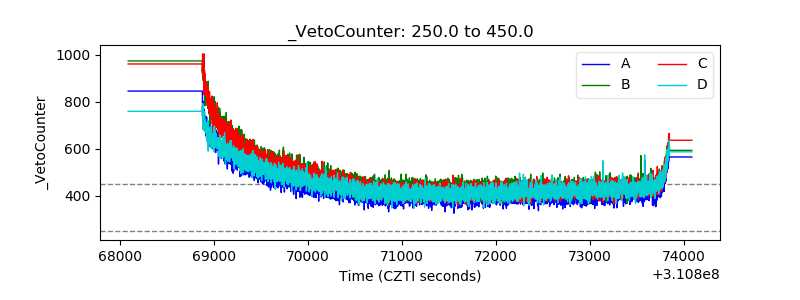 |