| Param | Original file | Final file |
|---|---|---|
| Filename | modeM0/AS1T03_147T01_9000003290cztM0_level2.fits | modeM0/AS1T03_147T01_9000003290cztM0_level2_quad_clean.evt |
| Size (bytes) | 421,911,360 | 219,594,240 |
| Size | 402.4 MB | 209.4 MB |
| Events in quadrant A | 2,665,512 | 1,032,444 |
| Events in quadrant B | 2,565,032 | 1,037,923 |
| Events in quadrant C | 2,614,260 | 980,403 |
| Events in quadrant D | 2,192,654 | 857,260 |
| Mode SS | |||
|---|---|---|---|
| Quadrant | BADHDUFLAG | Total packets | Discarded packets |
| A | 0 | 736 | 0 |
| B | 0 | 736 | 0 |
| C | 0 | 736 | 0 |
| D | 0 | 736 | 0 |
| Mode M9 | |||
|---|---|---|---|
| Quadrant | BADHDUFLAG | Total packets | Discarded packets |
| A | 0 | 64 | 0 |
| B | 0 | 65 | 0 |
| C | 0 | 65 | 0 |
| D | 0 | 65 | 0 |
| Mode M0 | |||
|---|---|---|---|
| Quadrant | BADHDUFLAG | Total packets | Discarded packets |
| A | 0 | 84012 | 0 |
| B | 0 | 84715 | 0 |
| C | 0 | 86874 | 0 |
| D | 0 | 114663 | 0 |
| Quadrant | Total seconds | Saturated seconds | Saturation percentage |
|---|---|---|---|
| A | 40148 | 557 | 1.387367% |
| B | 40148 | 637 | 1.586629% |
| C | 40147 | 935 | 2.328941% |
| D | 40147 | 3933 | 9.796498% |
Noise dominated data is calculated using 1-second bins in cleaned event files. If a bin has >2000 counts, and if more than 50% of those come from <1% of pixels, then it is considered to be noise-dominated and hence unusable.
| Quadrant | # 1 sec bins | Bins with >0 counts | Bins with >2000 counts | High rate bins dominated by noise | Noise dominated (total time) | Noise dominated (detector-on time) | Marked lightcurve |
|---|---|---|---|---|---|---|---|
| A | 89359 | 40148 | 0 | 0 | 0.00% | 0.00% | 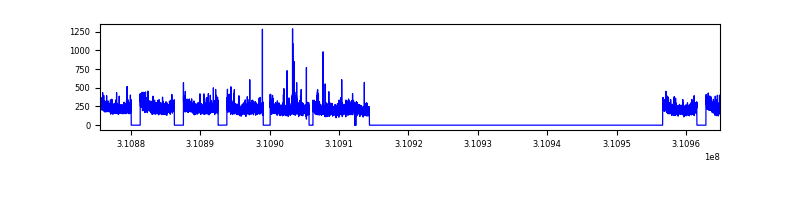 |
| B | 89359 | 40148 | 0 | 0 | 0.00% | 0.00% |  |
| C | 89359 | 40142 | 0 | 0 | 0.00% | 0.00% |  |
| D | 89359 | 40122 | 0 | 0 | 0.00% | 0.00% |  |
Top three noisy pixels from each quadrant. If the there are fewer than three noisy pixels in the level2.evt file, extra rows are filled as -1
| Pixel properties | Quadrant properties | ||||||
|---|---|---|---|---|---|---|---|
| Quadrant | DetID | PixID | Counts | Sigma | Mean | Median | Sigma |
| A | 0 | 29 | 2481 | 10.72 | 694 | 654 | 170.4 |
| A | 7 | 110 | 2153 | 8.8 | 694 | 654 | 170.4 |
| A | 9 | 19 | 2072 | 8.32 | 694 | 654 | 170.4 |
| B | 2 | 9 | 1973 | 9.87 | 678 | 648 | 134.3 |
| B | 2 | 8 | 1679 | 7.68 | 678 | 648 | 134.3 |
| B | 3 | 80 | 1674 | 7.64 | 678 | 648 | 134.3 |
| C | 1 | 81 | 1955 | 7.34 | 690 | 651 | 177.7 |
| C | 1 | 80 | 1949 | 7.3 | 690 | 651 | 177.7 |
| C | 3 | 126 | 1827 | 6.62 | 690 | 651 | 177.7 |
| D | 10 | 189 | 1633 | 6.51 | 625 | 574 | 162.7 |
| D | 15 | 46 | 1587 | 6.22 | 625 | 574 | 162.7 |
| D | 6 | 67 | 1575 | 6.15 | 625 | 574 | 162.7 |
Histogram calculated using DETX and DETY for each event in the final _common_clean file
| Quadrant A |  |
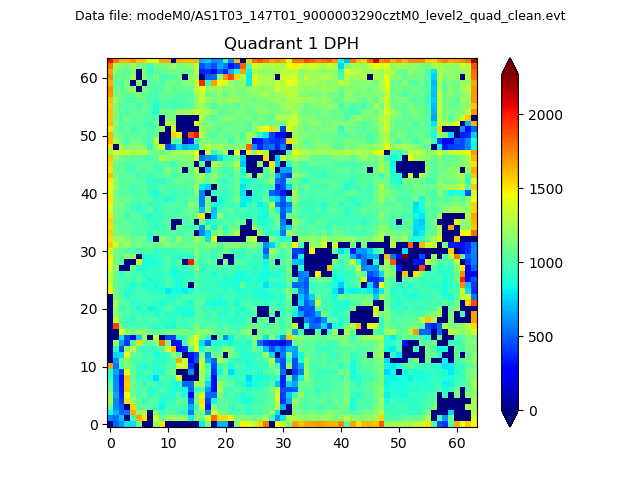 |
Quadrant B |
|---|---|---|---|
| Quadrant D |  |
 |
Quadrant C |
| Plot type | Count rate plots | Images |
|---|---|---|
| Comparison with Poisson distribution Blue bars denote a histogram of data divided into 1 sec bins. Red curve is a Poisson curve with rate = median count rate of data. |
 |
 |
| Quadrant-wise count rates Data is divided into 100 sec bins |
 |
|
| Module-wise count rates for Quadrant A Data is divided into 100 sec bins |
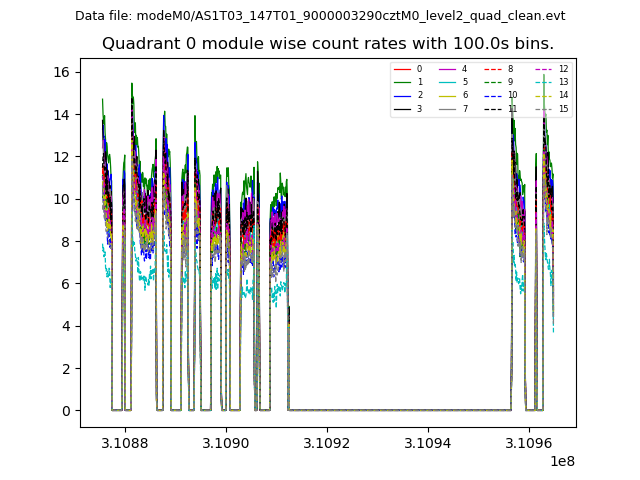 |
 |
| Module-wise count rates for Quadrant B Data is divided into 100 sec bins |
 |
 |
| Module-wise count rates for Quadrant C Data is divided into 100 sec bins |
 |
 |
| Module-wise count rates for Quadrant D Data is divided into 100 sec bins |
 |
 |
| Parameter | Plot |
|---|---|
| CZT HV Monitor |  |
| D_VDD |  |
| Temperature 1 |  |
| Veto HV Monitor |  |
| Veto LLD | 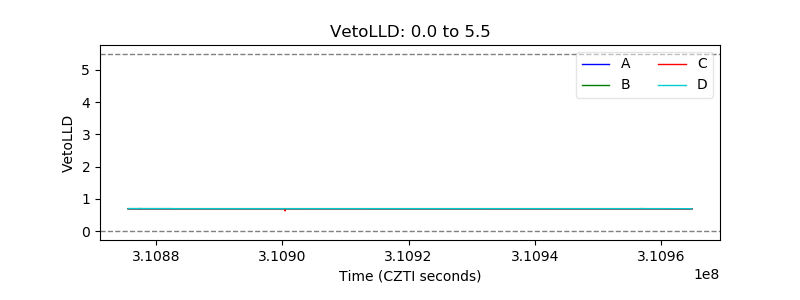 |
| Alpha Counter |  |
| _CPM_Rate |  |
| CZT Counter | 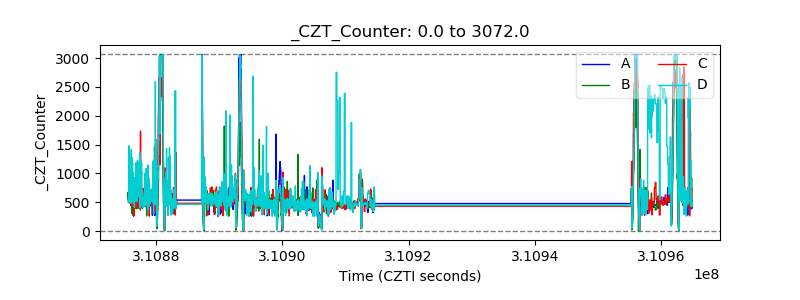 |
| +2.5 Volts monitor |  |
| +5 Volts monitor |  |
| _ROLL_ROT |  |
| _Roll_DEC | 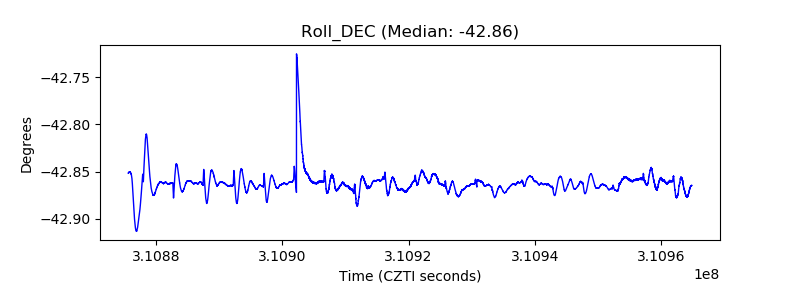 |
| _Roll_RA | 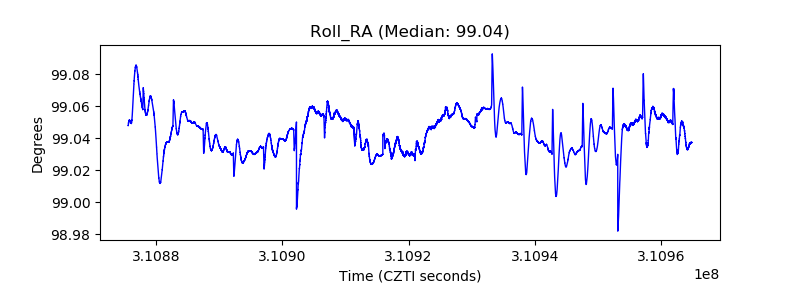 |
| Veto Counter | 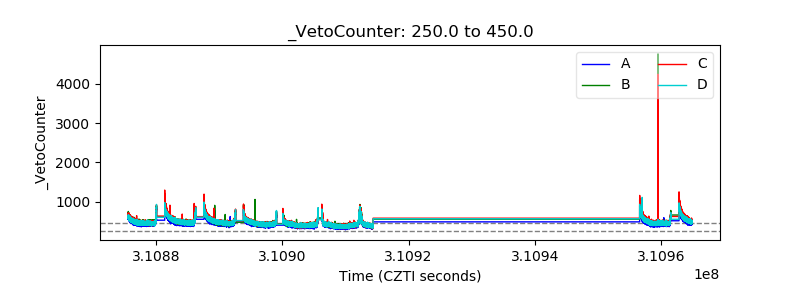 |