| Param | Original file | Final file |
|---|---|---|
| Filename | modeM0/AS1T03_147T01_9000003290_22231cztM0_level2.evt | modeM0/AS1T03_147T01_9000003290_22231cztM0_level2_quad_clean.evt |
| Size (bytes) | 75,358,080 | 23,428,800 |
| Size | 71.9 MB | 22.3 MB |
| Events in quadrant A | 507,026 | 163,979 |
| Events in quadrant B | 521,561 | 168,753 |
| Events in quadrant C | 514,542 | 153,384 |
| Events in quadrant D | 670,118 | 148,181 |
| Mode SS | |||
|---|---|---|---|
| Quadrant | BADHDUFLAG | Total packets | Discarded packets |
| A | 0 | 20 | 0 |
| B | 0 | 20 | 0 |
| C | 0 | 20 | 0 |
| D | 0 | 20 | 0 |
| Mode M0 | |||
|---|---|---|---|
| Quadrant | BADHDUFLAG | Total packets | Discarded packets |
| A | 0 | 1997 | 0 |
| B | 0 | 2049 | 0 |
| C | 0 | 2031 | 0 |
| D | 0 | 2654 | 0 |
| Quadrant | Total seconds | Saturated seconds | Saturation percentage |
|---|---|---|---|
| A | 966 | 0 | 0.000000% |
| B | 966 | 1 | 0.103520% |
| C | 966 | 3 | 0.310559% |
| D | 966 | 1 | 0.103520% |
Noise dominated data is calculated using 1-second bins in cleaned event files. If a bin has >2000 counts, and if more than 50% of those come from <1% of pixels, then it is considered to be noise-dominated and hence unusable.
| Quadrant | # 1 sec bins | Bins with >0 counts | Bins with >2000 counts | High rate bins dominated by noise | Noise dominated (total time) | Noise dominated (detector-on time) | Marked lightcurve |
|---|---|---|---|---|---|---|---|
| A | 966 | 966 | 0 | 0 | 0.00% | 0.00% | 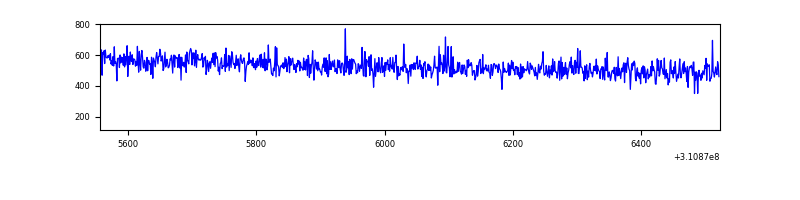 |
| B | 966 | 966 | 0 | 0 | 0.00% | 0.00% | 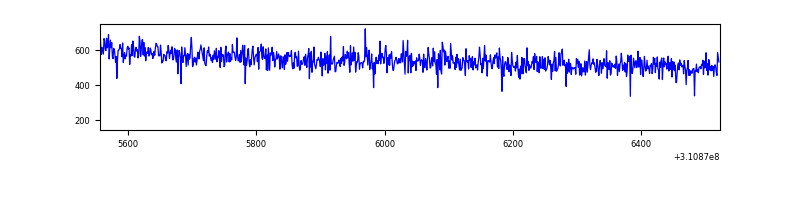 |
| C | 966 | 966 | 0 | 0 | 0.00% | 0.00% | 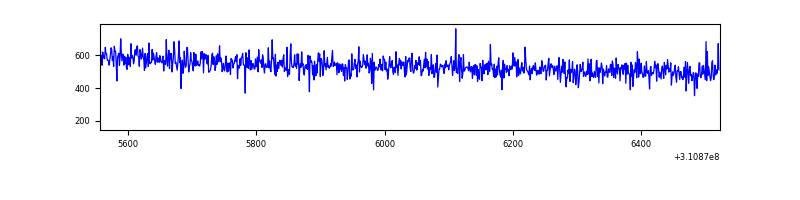 |
| D | 966 | 966 | 2 | 2 | 0.21% | 0.21% | 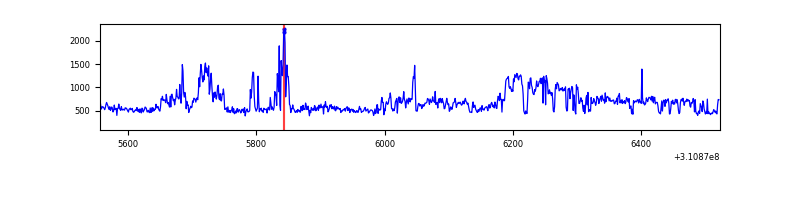 |
Top three noisy pixels from each quadrant. If the there are fewer than three noisy pixels in the level2.evt file, extra rows are filled as -1
| Pixel properties | Quadrant properties | ||||||
|---|---|---|---|---|---|---|---|
| Quadrant | DetID | PixID | Counts | Sigma | Mean | Median | Sigma |
| A | 13 | 254 | 1419 | 46.99 | 131 | 129 | 27.5 |
| A | 0 | 226 | 1184 | 38.43 | 131 | 129 | 27.5 |
| A | 3 | 137 | 924 | 28.96 | 131 | 129 | 27.5 |
| B | 12 | 111 | 2785 | 99.88 | 133 | 130 | 26.6 |
| B | 11 | 111 | 2364 | 84.04 | 133 | 130 | 26.6 |
| B | 14 | 111 | 2208 | 78.18 | 133 | 130 | 26.6 |
| C | 14 | 238 | 20164 | 657.77 | 126 | 127 | 30.5 |
| C | 13 | 61 | 906 | 25.57 | 126 | 127 | 30.5 |
| C | 15 | 78 | 346 | 7.19 | 126 | 127 | 30.5 |
| D | 2 | 16 | 128828 | 4033.75 | 125 | 121 | 31.9 |
| D | 1 | 52 | 68529 | 2143.94 | 125 | 121 | 31.9 |
| D | 2 | 234 | 3330 | 100.57 | 125 | 121 | 31.9 |
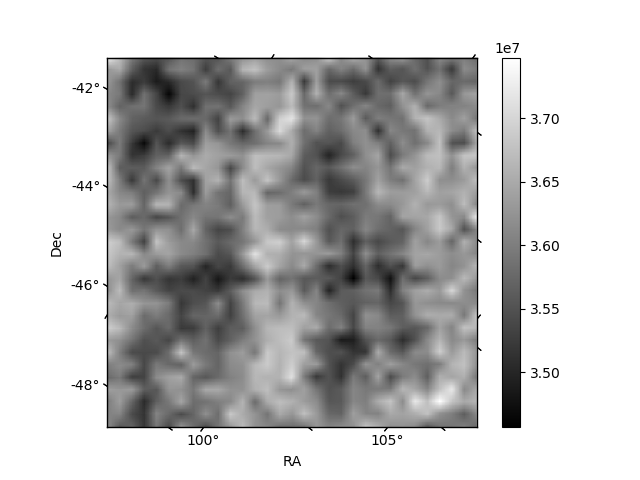
Histogram calculated using DETX and DETY for each event in the final _common_clean file
| Quadrant A | 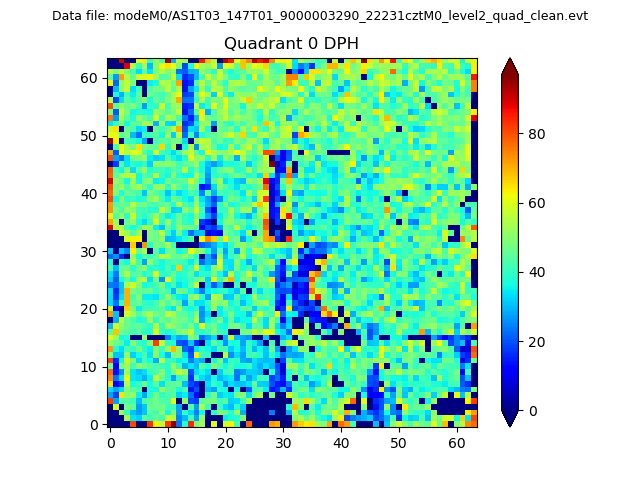 |
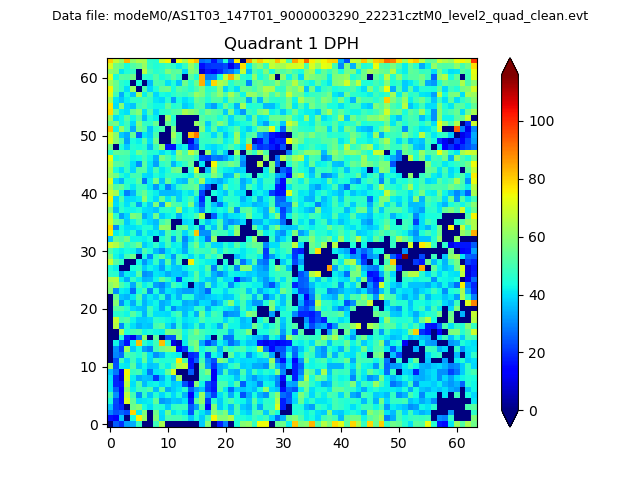 |
Quadrant B |
|---|---|---|---|
| Quadrant D |  |
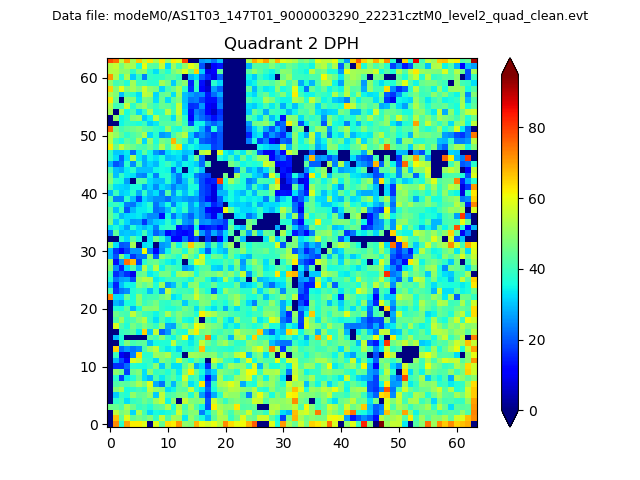 |
Quadrant C |
| Plot type | Count rate plots | Images |
|---|---|---|
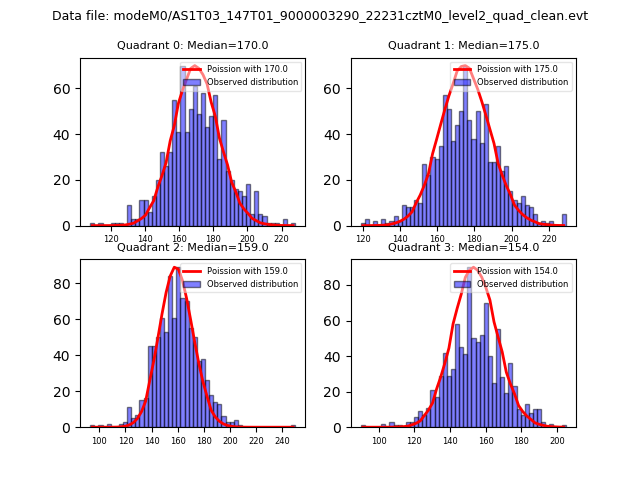
| Comparison with Poisson distribution Blue bars denote a histogram of data divided into 1 sec bins. Red curve is a Poisson curve with rate = median count rate of data. |
 |
 |
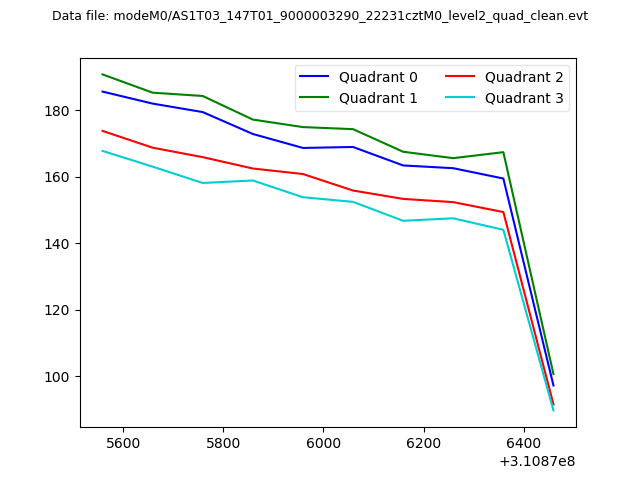
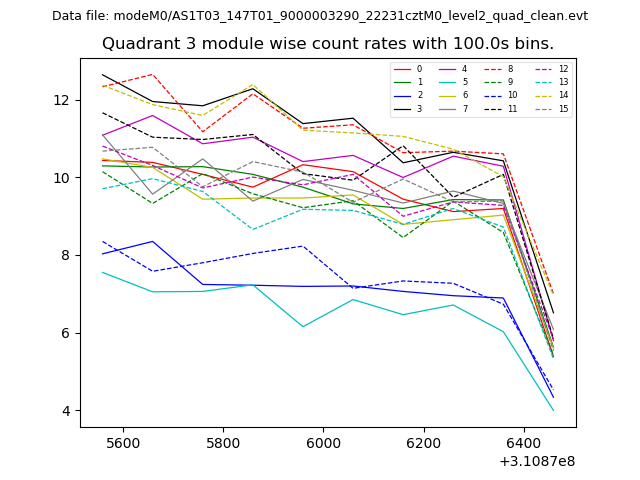
| Quadrant-wise count rates Data is divided into 100 sec bins |
 |
|
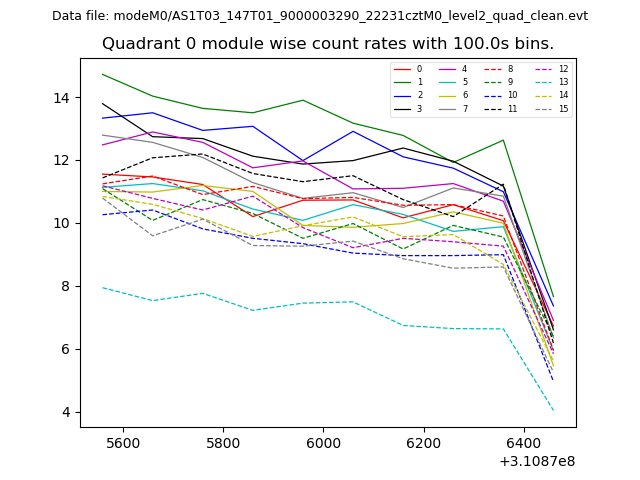
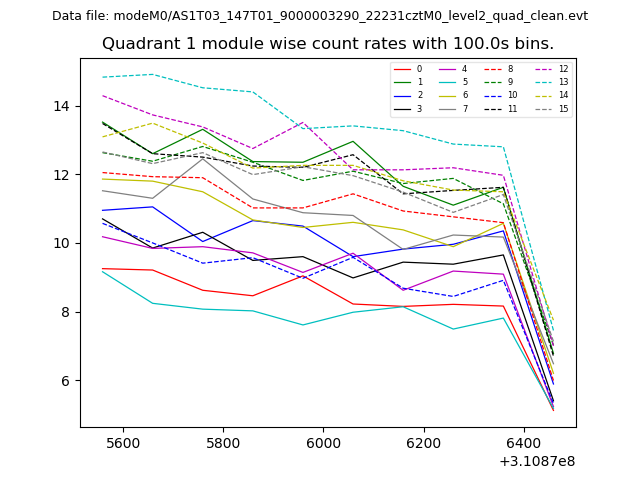
| Module-wise count rates for Quadrant A Data is divided into 100 sec bins |
 |
 |
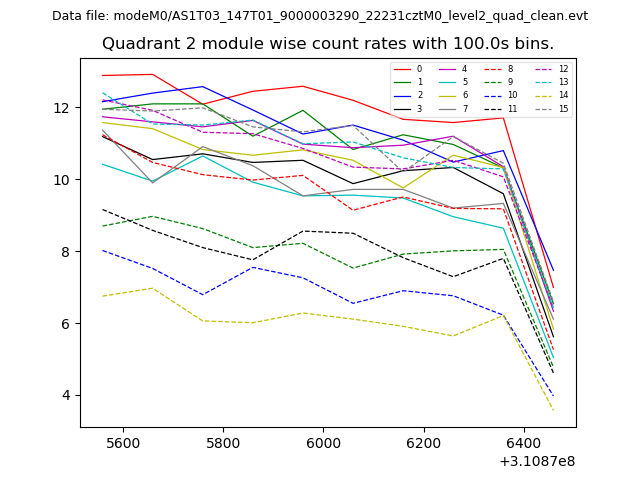
| Module-wise count rates for Quadrant B Data is divided into 100 sec bins |
 |
 |
| Module-wise count rates for Quadrant C Data is divided into 100 sec bins |
 |
 |
| Module-wise count rates for Quadrant D Data is divided into 100 sec bins |
 |
 |
| Parameter | Plot |
|---|---|
| CZT HV Monitor | 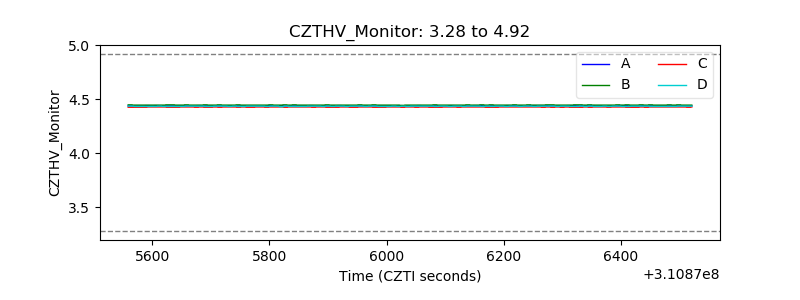 |
| D_VDD | 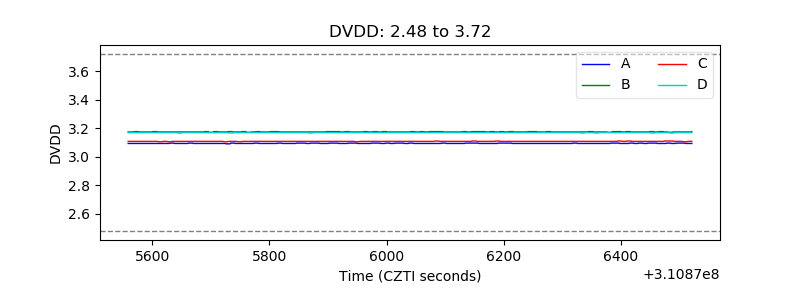 |
| Temperature 1 |  |
| Veto HV Monitor | 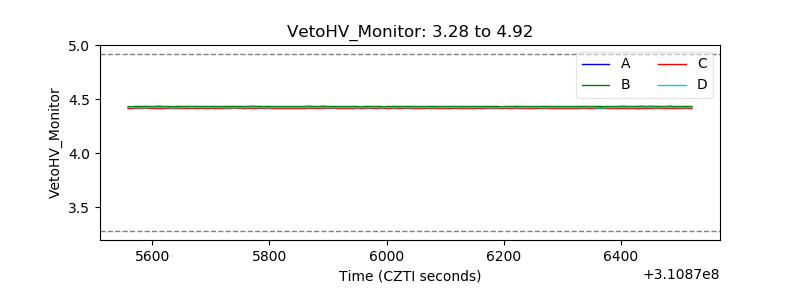 |
| Veto LLD | 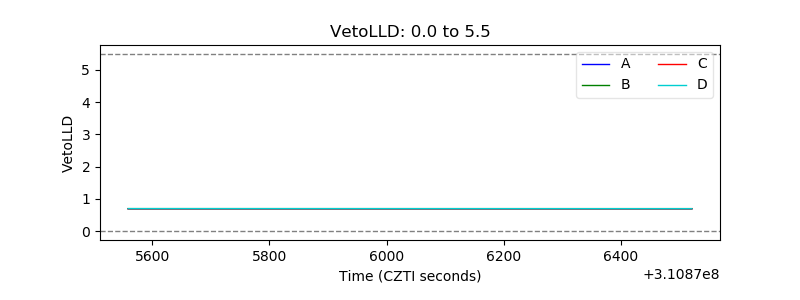 |
| Alpha Counter | 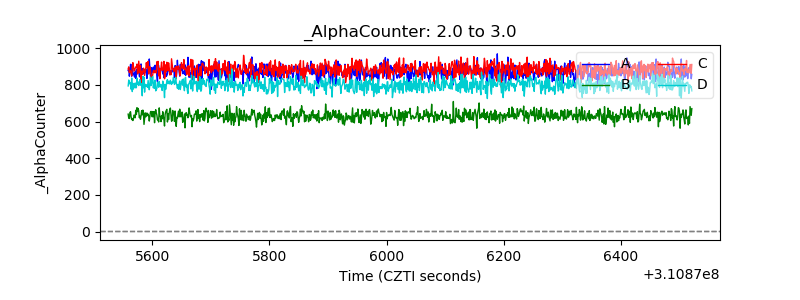 |
| _CPM_Rate | 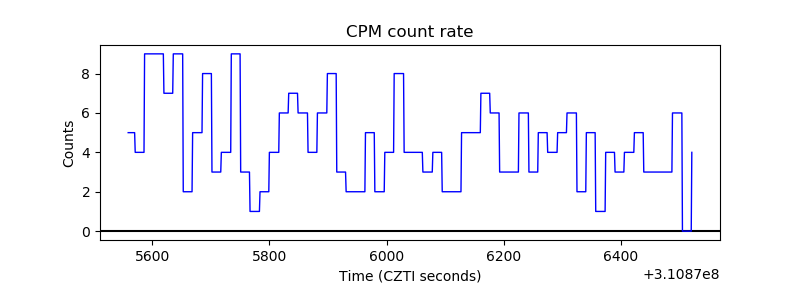 |
| CZT Counter | 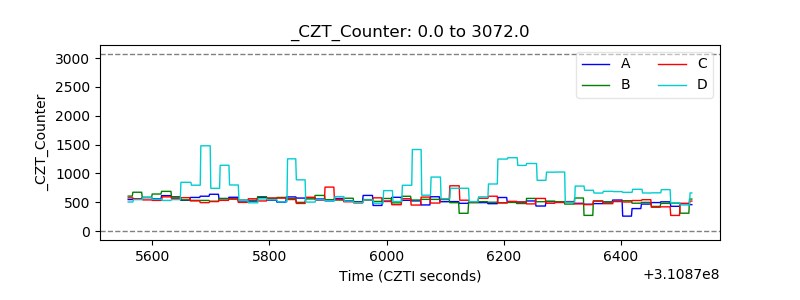 |
| +2.5 Volts monitor |  |
| +5 Volts monitor | 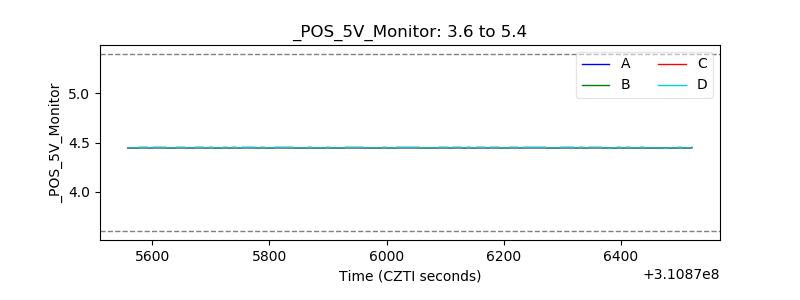 |
| _ROLL_ROT | 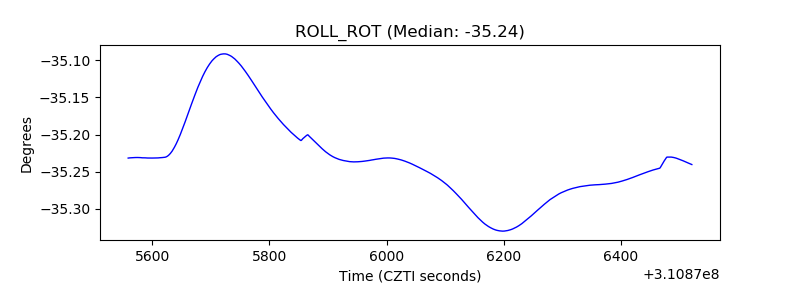 |
| _Roll_DEC | 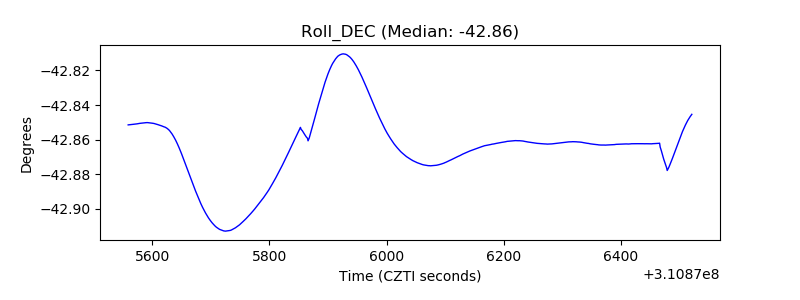 |
| _Roll_RA | 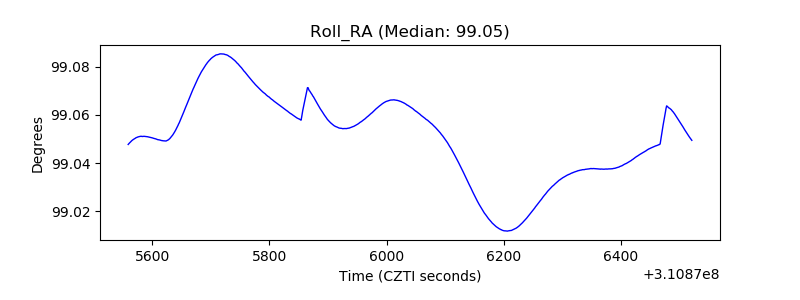 |
| Veto Counter | 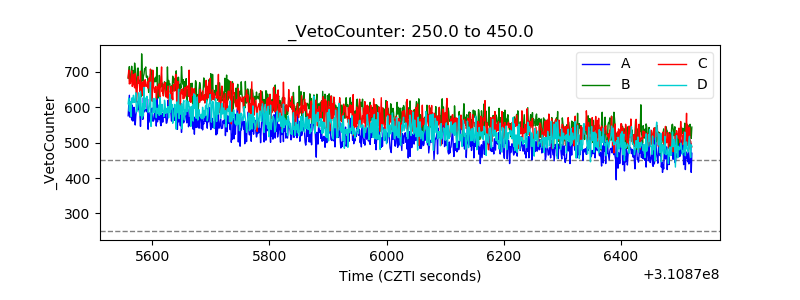 |