| Param | Original file | Final file |
|---|---|---|
| Filename | modeM0/AS1T03_147T01_9000003290_22232cztM0_level2.evt | modeM0/AS1T03_147T01_9000003290_22232cztM0_level2_quad_clean.evt |
| Size (bytes) | 446,002,560 | 91,990,080 |
| Size | 425.3 MB | 87.7 MB |
| Events in quadrant A | 3,028,033 | 608,972 |
| Events in quadrant B | 3,083,191 | 627,147 |
| Events in quadrant C | 3,085,860 | 584,133 |
| Events in quadrant D | 3,917,907 | 561,703 |
| Mode SS | |||
|---|---|---|---|
| Quadrant | BADHDUFLAG | Total packets | Discarded packets |
| A | 0 | 118 | 0 |
| B | 0 | 118 | 0 |
| C | 0 | 118 | 0 |
| D | 0 | 118 | 0 |
| Mode M9 | |||
|---|---|---|---|
| Quadrant | BADHDUFLAG | Total packets | Discarded packets |
| A | 0 | 13 | 0 |
| B | 0 | 13 | 0 |
| C | 0 | 13 | 0 |
| D | 0 | 13 | 0 |
| Mode M0 | |||
|---|---|---|---|
| Quadrant | BADHDUFLAG | Total packets | Discarded packets |
| A | 0 | 12230 | 1 |
| B | 0 | 12406 | 1 |
| C | 0 | 12452 | 1 |
| D | 0 | 15347 | 1 |
| Quadrant | Total seconds | Saturated seconds | Saturation percentage |
|---|---|---|---|
| A | 5776 | 43 | 0.744460% |
| B | 5776 | 50 | 0.865651% |
| C | 5776 | 84 | 1.454294% |
| D | 5776 | 48 | 0.831025% |
Noise dominated data is calculated using 1-second bins in cleaned event files. If a bin has >2000 counts, and if more than 50% of those come from <1% of pixels, then it is considered to be noise-dominated and hence unusable.
| Quadrant | # 1 sec bins | Bins with >0 counts | Bins with >2000 counts | High rate bins dominated by noise | Noise dominated (total time) | Noise dominated (detector-on time) | Marked lightcurve |
|---|---|---|---|---|---|---|---|
| A | 7076 | 5777 | 0 | 0 | 0.00% | 0.00% | 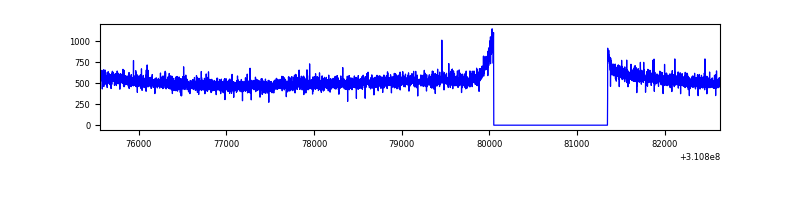 |
| B | 7076 | 5777 | 0 | 0 | 0.00% | 0.00% | 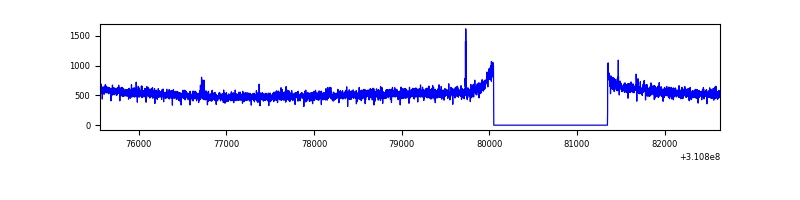 |
| C | 7076 | 5777 | 0 | 0 | 0.00% | 0.00% | 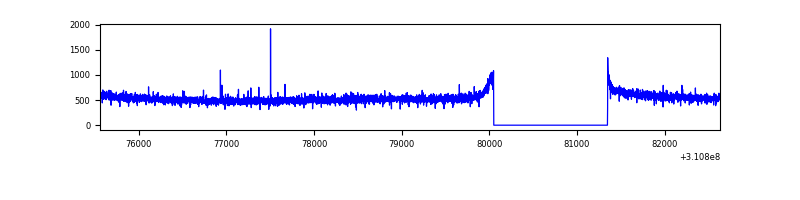 |
| D | 7076 | 5777 | 10 | 10 | 0.14% | 0.17% | 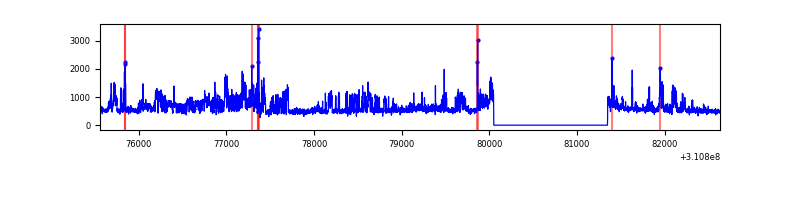 |
Top three noisy pixels from each quadrant. If the there are fewer than three noisy pixels in the level2.evt file, extra rows are filled as -1
| Pixel properties | Quadrant properties | ||||||
|---|---|---|---|---|---|---|---|
| Quadrant | DetID | PixID | Counts | Sigma | Mean | Median | Sigma |
| A | 13 | 254 | 7841 | 45.75 | 785 | 771 | 154.5 |
| A | 0 | 226 | 6762 | 38.77 | 785 | 771 | 154.5 |
| A | 3 | 137 | 6145 | 34.78 | 785 | 771 | 154.5 |
| B | 12 | 111 | 17107 | 113.75 | 783 | 766 | 143.7 |
| B | 11 | 111 | 15054 | 99.46 | 783 | 766 | 143.7 |
| B | 14 | 111 | 13936 | 91.67 | 783 | 766 | 143.7 |
| C | 14 | 238 | 122364 | 696.82 | 758 | 765 | 174.5 |
| C | 13 | 61 | 5129 | 25.01 | 758 | 765 | 174.5 |
| C | 0 | 10 | 3998 | 18.53 | 758 | 765 | 174.5 |
| D | 2 | 16 | 681663 | 3760.68 | 761 | 741 | 181.1 |
| D | 1 | 52 | 341366 | 1881.25 | 761 | 741 | 181.1 |
| D | 2 | 234 | 21049 | 112.16 | 761 | 741 | 181.1 |
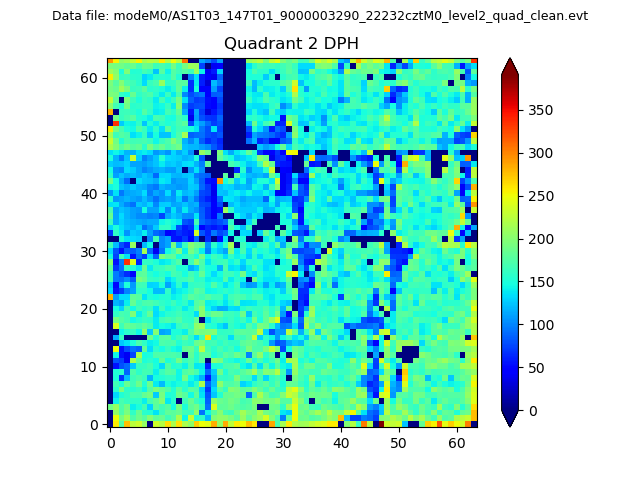
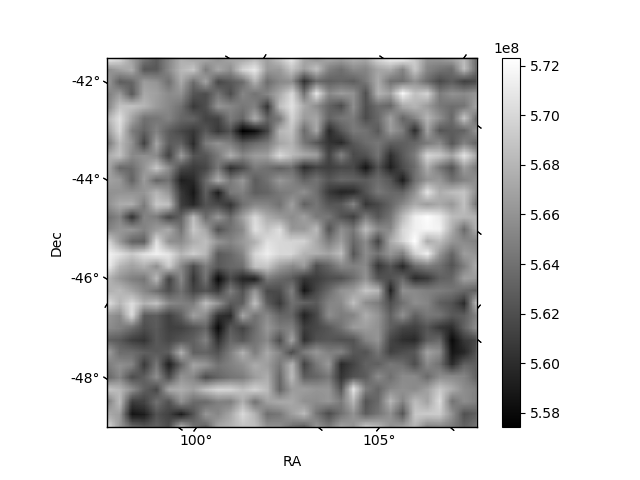
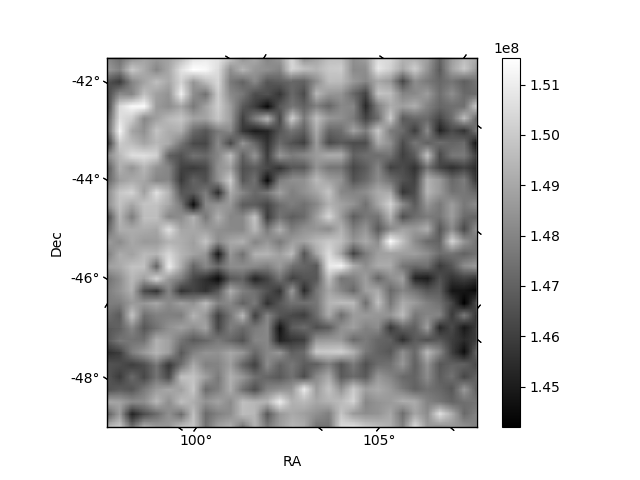
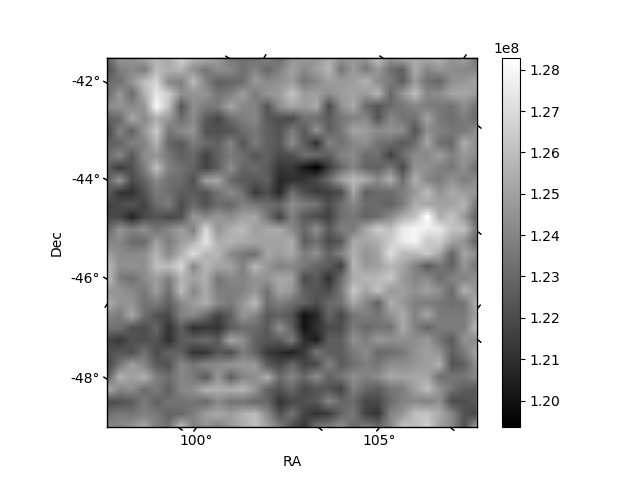
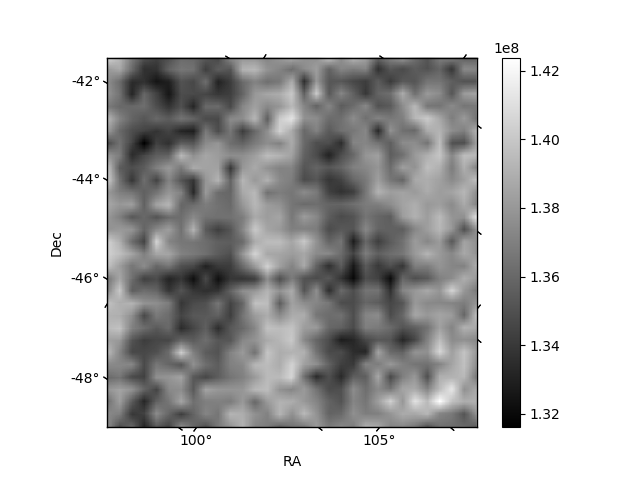
Histogram calculated using DETX and DETY for each event in the final _common_clean file
| Quadrant A | 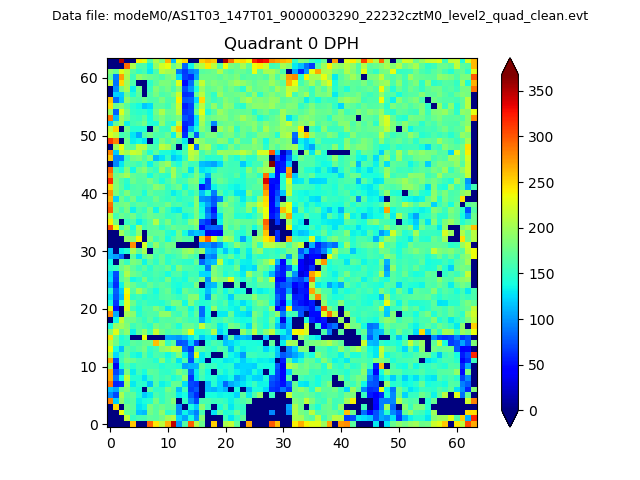 |
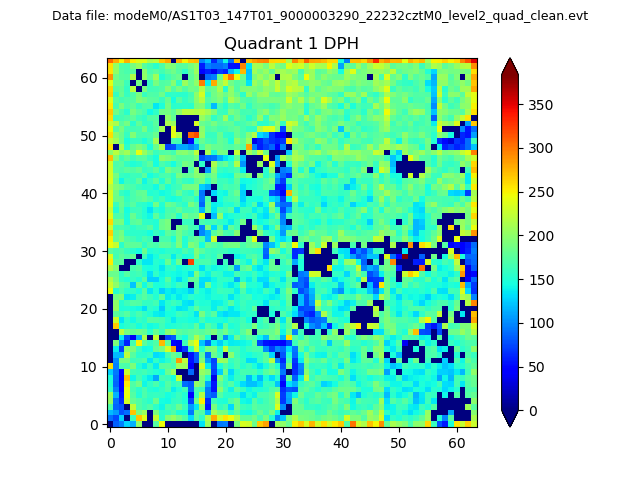 |
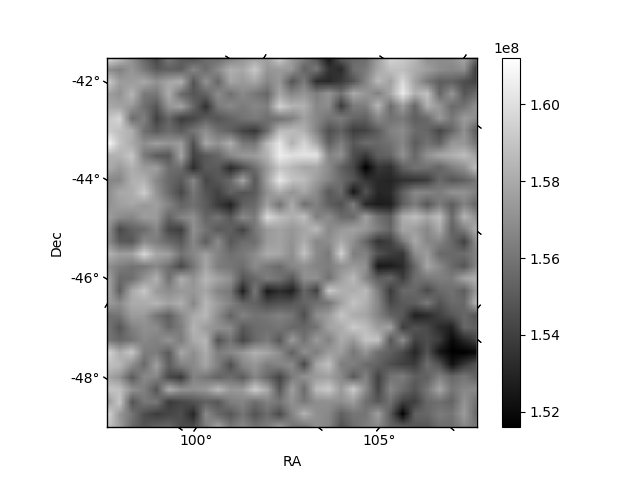
Quadrant B |
|---|---|---|---|
| Quadrant D | 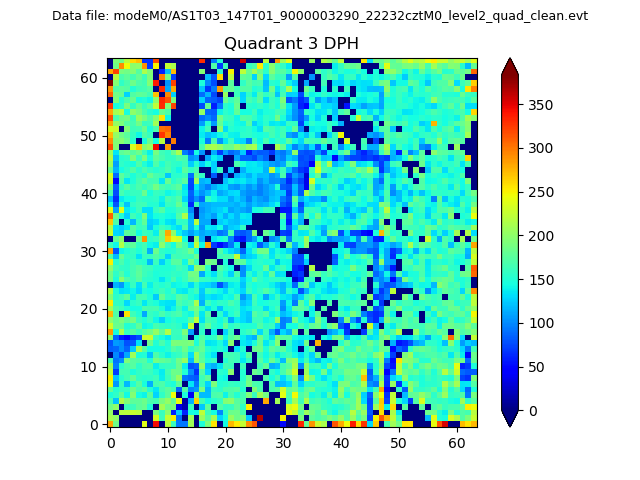 |
 |
Quadrant C |
| Plot type | Count rate plots | Images |
|---|---|---|
| Comparison with Poisson distribution Blue bars denote a histogram of data divided into 1 sec bins. Red curve is a Poisson curve with rate = median count rate of data. |
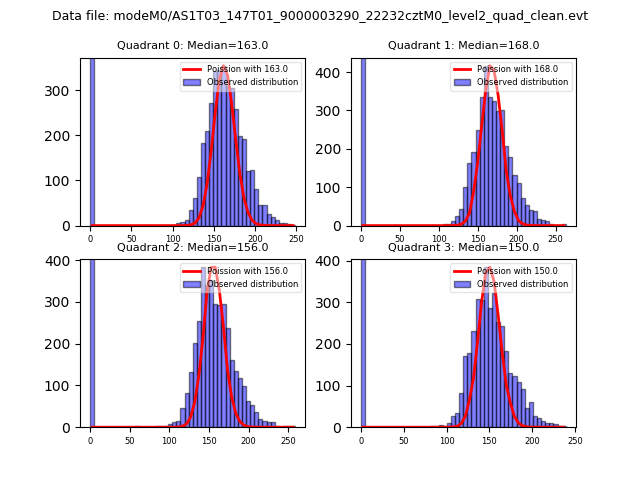 |
 |
| Quadrant-wise count rates Data is divided into 100 sec bins |
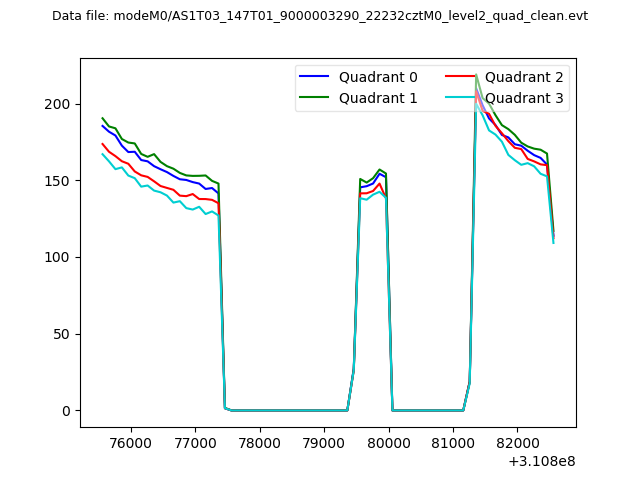 |
|
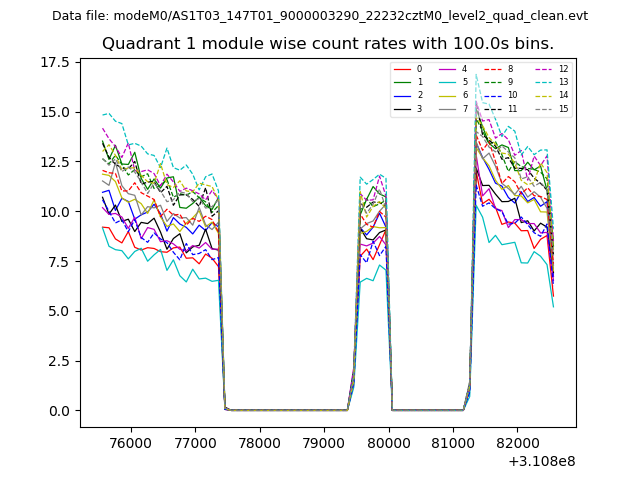
| Module-wise count rates for Quadrant A Data is divided into 100 sec bins |
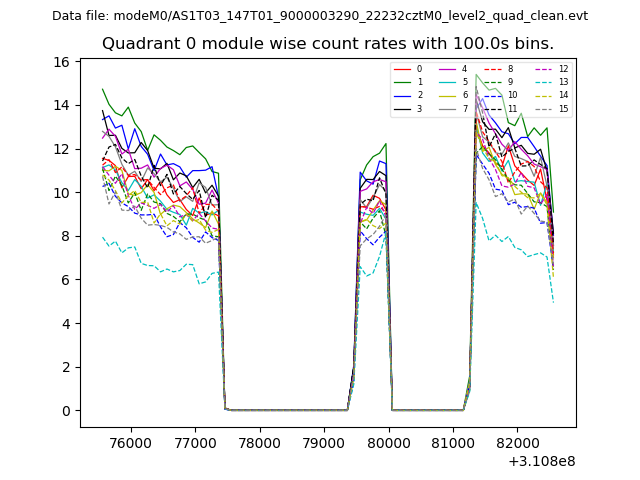 |
 |
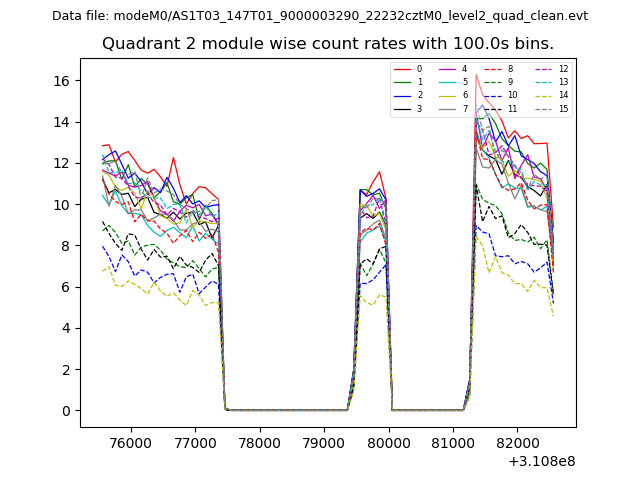
| Module-wise count rates for Quadrant B Data is divided into 100 sec bins |
 |
 |
| Module-wise count rates for Quadrant C Data is divided into 100 sec bins |
 |
 |
| Module-wise count rates for Quadrant D Data is divided into 100 sec bins |
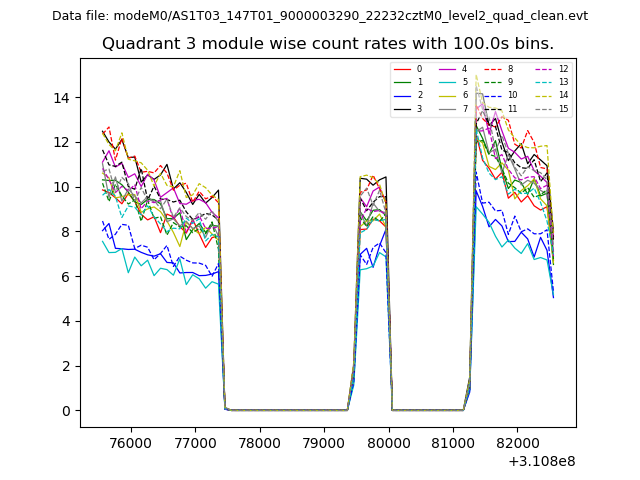 |
 |
| Parameter | Plot |
|---|---|
| CZT HV Monitor | 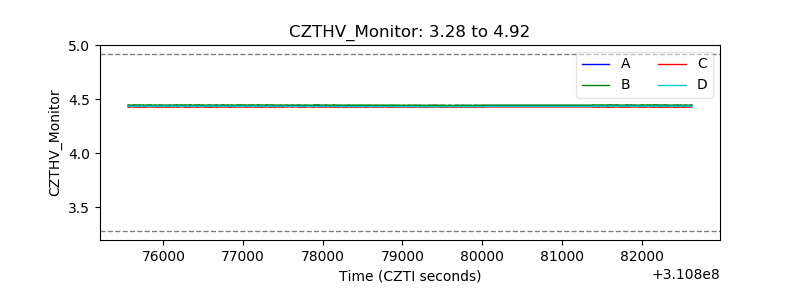 |
| D_VDD | 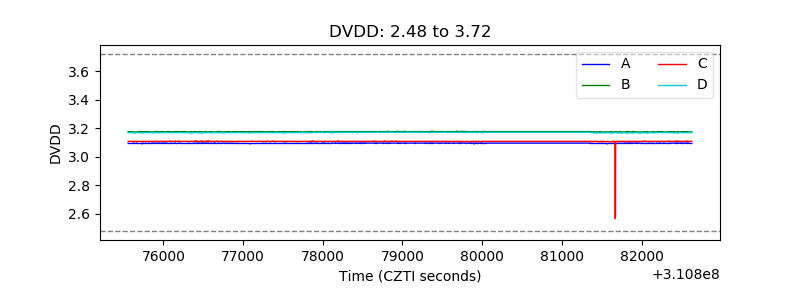 |
| Temperature 1 | 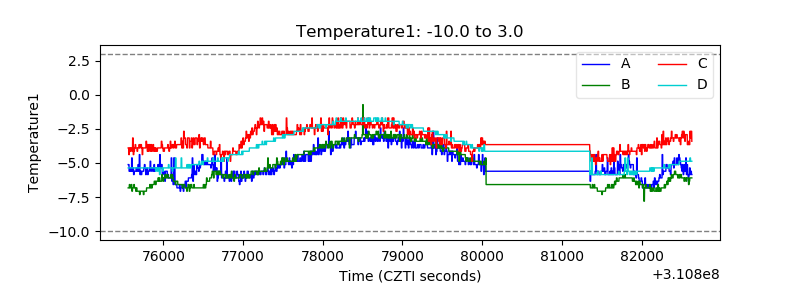 |
| Veto HV Monitor | 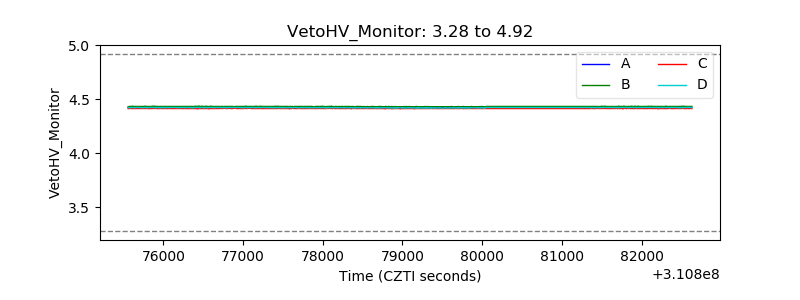 |
| Veto LLD | 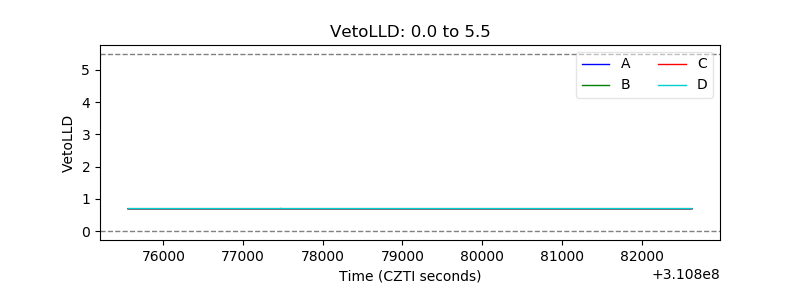 |
| Alpha Counter | 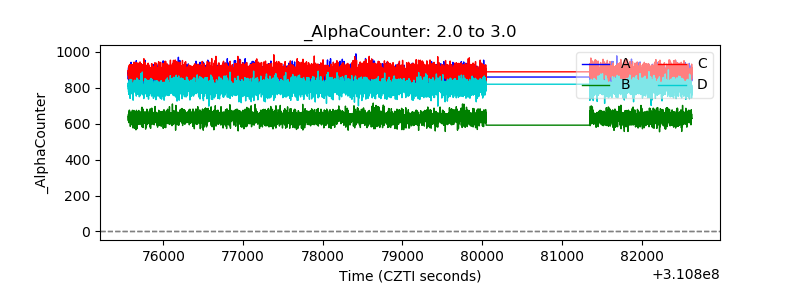 |
| _CPM_Rate | 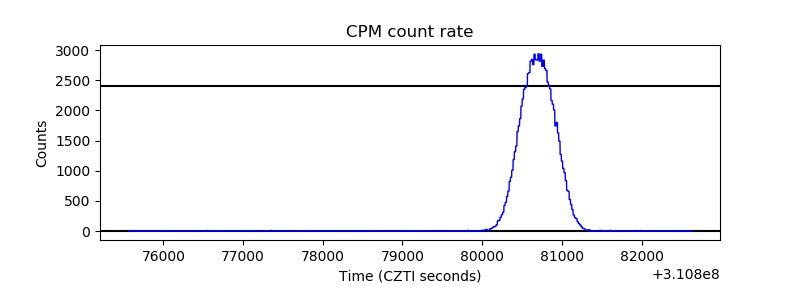 |
| CZT Counter | 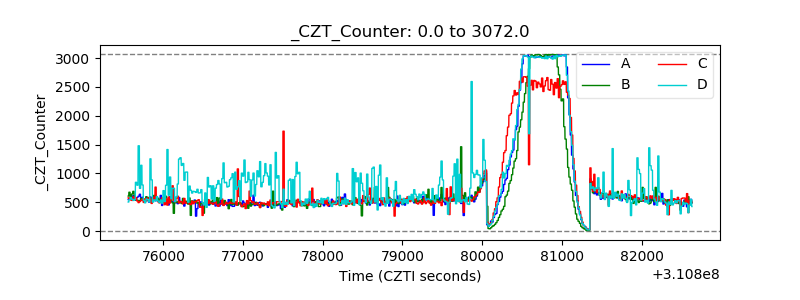 |
| +2.5 Volts monitor |  |
| +5 Volts monitor |  |
| _ROLL_ROT | 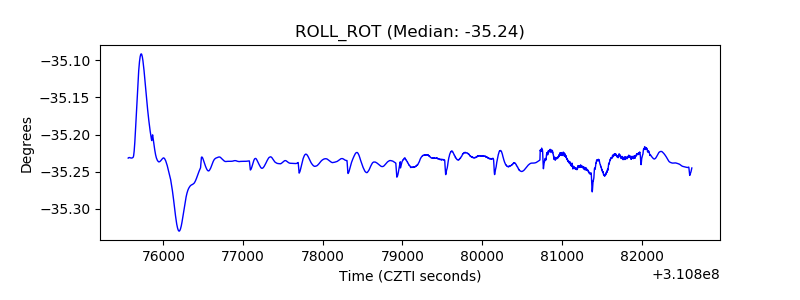 |
| _Roll_DEC |  |
| _Roll_RA | 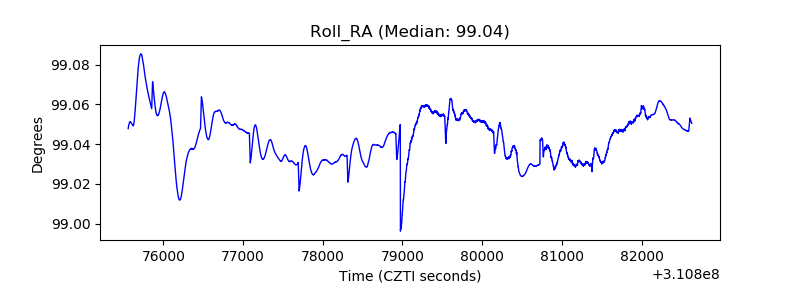 |
| Veto Counter |  |