| Param | Original file | Final file |
|---|---|---|
| Filename | modeM0/AS1T03_147T01_9000003290_22235cztM0_level2.evt | modeM0/AS1T03_147T01_9000003290_22235cztM0_level2_quad_clean.evt |
| Size (bytes) | 461,882,880 | 89,104,320 |
| Size | 440.5 MB | 85.0 MB |
| Events in quadrant A | 3,259,524 | 568,428 |
| Events in quadrant B | 3,326,659 | 578,198 |
| Events in quadrant C | 3,341,567 | 549,608 |
| Events in quadrant D | 3,613,373 | 543,119 |
| Mode SS | |||
|---|---|---|---|
| Quadrant | BADHDUFLAG | Total packets | Discarded packets |
| A | 0 | 134 | 0 |
| B | 0 | 134 | 0 |
| C | 0 | 134 | 0 |
| D | 0 | 134 | 0 |
| Mode M9 | |||
|---|---|---|---|
| Quadrant | BADHDUFLAG | Total packets | Discarded packets |
| A | 0 | 10 | 0 |
| B | 0 | 11 | 0 |
| C | 0 | 11 | 0 |
| D | 0 | 11 | 0 |
| Mode M0 | |||
|---|---|---|---|
| Quadrant | BADHDUFLAG | Total packets | Discarded packets |
| A | 0 | 13576 | 2 |
| B | 0 | 13720 | 2 |
| C | 0 | 13732 | 2 |
| D | 0 | 14763 | 2 |
| Quadrant | Total seconds | Saturated seconds | Saturation percentage |
|---|---|---|---|
| A | 6580 | 75 | 1.139818% |
| B | 6580 | 85 | 1.291793% |
| C | 6580 | 114 | 1.732523% |
| D | 6580 | 111 | 1.686930% |
Noise dominated data is calculated using 1-second bins in cleaned event files. If a bin has >2000 counts, and if more than 50% of those come from <1% of pixels, then it is considered to be noise-dominated and hence unusable.
| Quadrant | # 1 sec bins | Bins with >0 counts | Bins with >2000 counts | High rate bins dominated by noise | Noise dominated (total time) | Noise dominated (detector-on time) | Marked lightcurve |
|---|---|---|---|---|---|---|---|
| A | 7585 | 6581 | 0 | 0 | 0.00% | 0.00% | 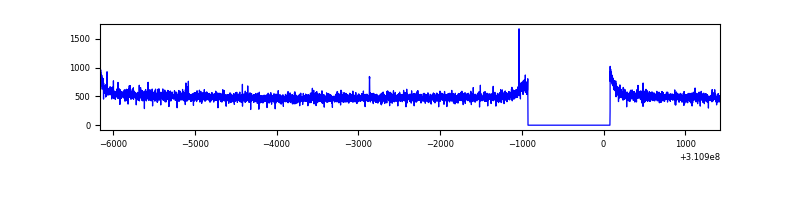 |
| B | 7585 | 6581 | 2 | 2 | 0.03% | 0.03% | 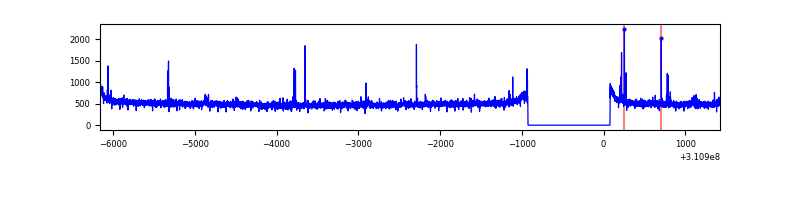 |
| C | 7585 | 6581 | 0 | 0 | 0.00% | 0.00% | 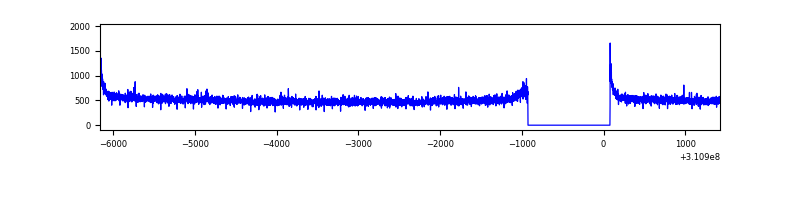 |
| D | 7585 | 6581 | 45 | 45 | 0.59% | 0.68% | 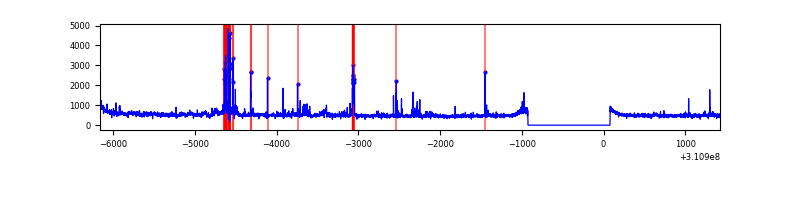 |
Top three noisy pixels from each quadrant. If the there are fewer than three noisy pixels in the level2.evt file, extra rows are filled as -1
| Pixel properties | Quadrant properties | ||||||
|---|---|---|---|---|---|---|---|
| Quadrant | DetID | PixID | Counts | Sigma | Mean | Median | Sigma |
| A | 2 | 79 | 16264 | 93.19 | 839 | 822 | 165.7 |
| A | 13 | 254 | 9523 | 52.51 | 839 | 822 | 165.7 |
| A | 0 | 226 | 7320 | 39.22 | 839 | 822 | 165.7 |
| B | 4 | 173 | 37548 | 235.4 | 833 | 813 | 156.1 |
| B | 12 | 111 | 18712 | 114.7 | 833 | 813 | 156.1 |
| B | 11 | 111 | 16756 | 102.16 | 833 | 813 | 156.1 |
| C | 14 | 238 | 128750 | 670.4 | 816 | 821 | 190.8 |
| C | 0 | 10 | 23131 | 116.91 | 816 | 821 | 190.8 |
| C | 9 | 54 | 10735 | 51.95 | 816 | 821 | 190.8 |
| D | 2 | 16 | 185797 | 936.77 | 822 | 799 | 197.5 |
| D | 1 | 52 | 176481 | 889.59 | 822 | 799 | 197.5 |
| D | 13 | 172 | 74503 | 373.21 | 822 | 799 | 197.5 |
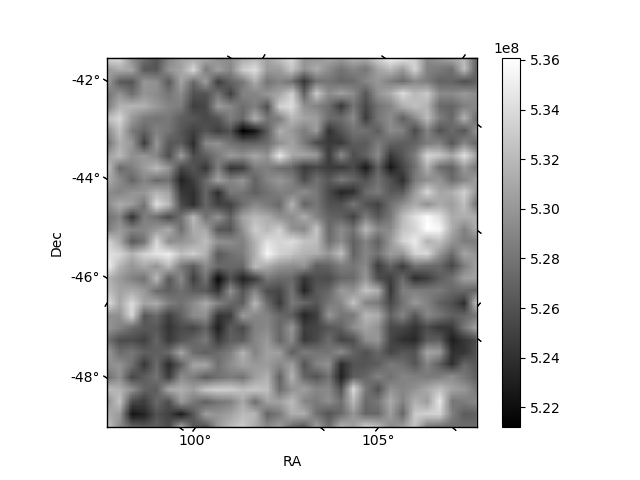
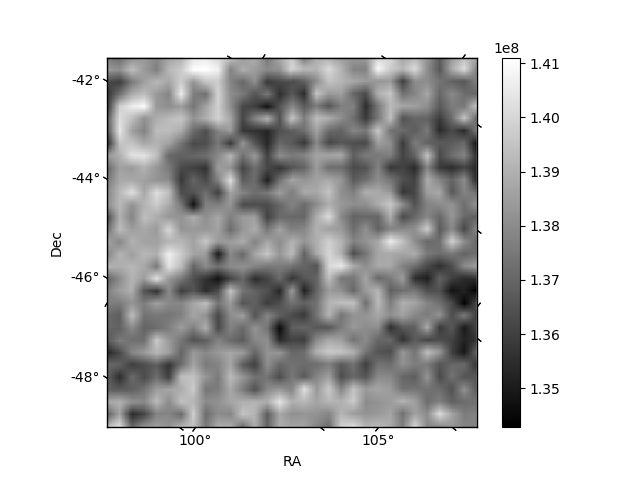
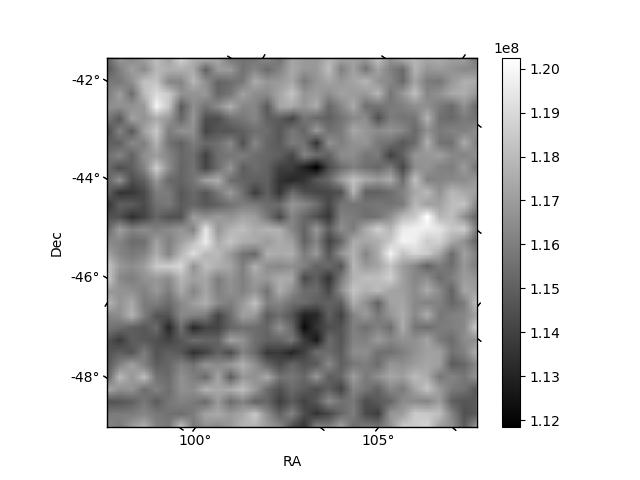
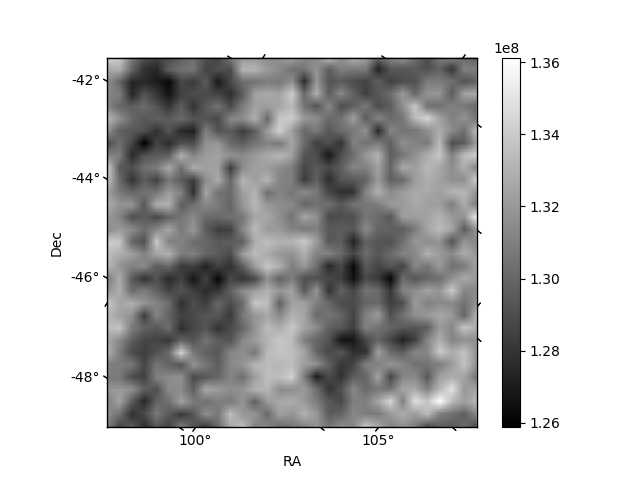
Histogram calculated using DETX and DETY for each event in the final _common_clean file
| Quadrant A | 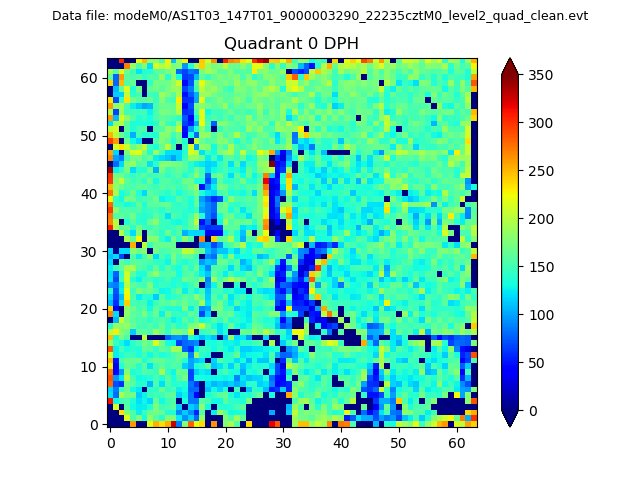 |
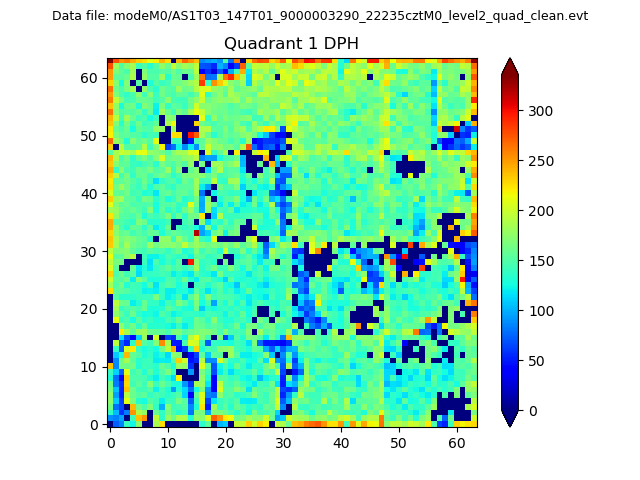 |
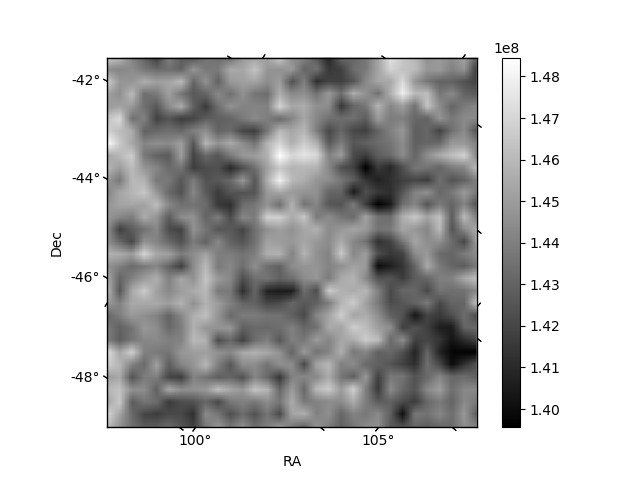
Quadrant B |
|---|---|---|---|
| Quadrant D | 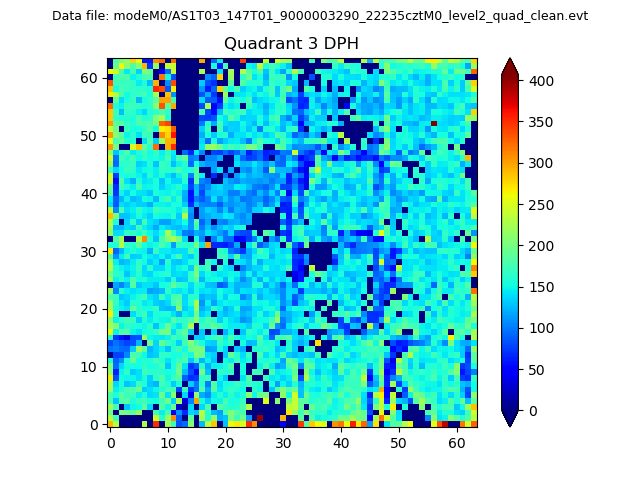 |
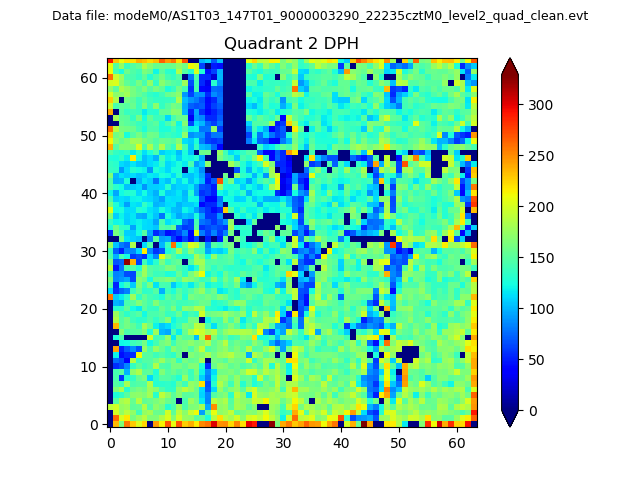 |
Quadrant C |
| Plot type | Count rate plots | Images |
|---|---|---|
| Comparison with Poisson distribution Blue bars denote a histogram of data divided into 1 sec bins. Red curve is a Poisson curve with rate = median count rate of data. |
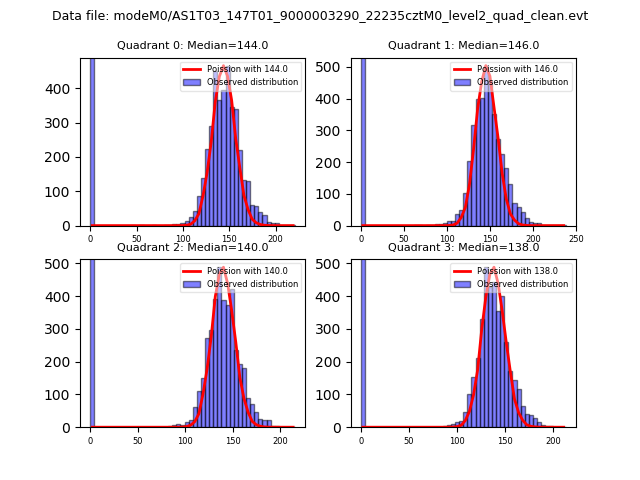 |
 |
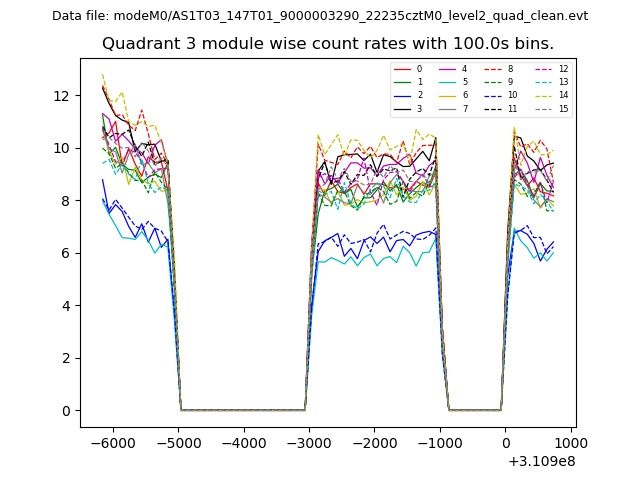
| Quadrant-wise count rates Data is divided into 100 sec bins |
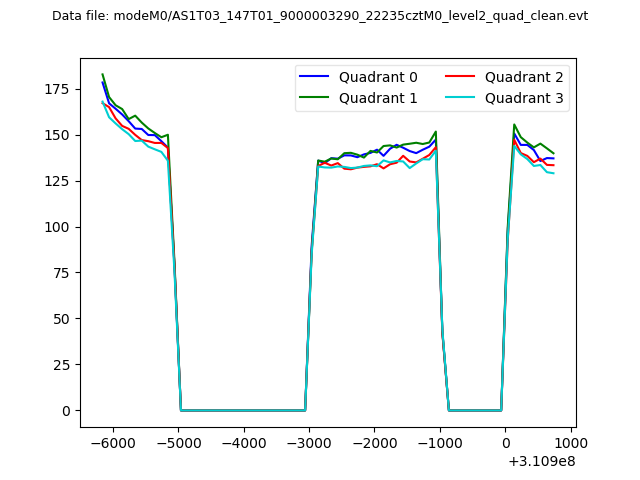 |
|
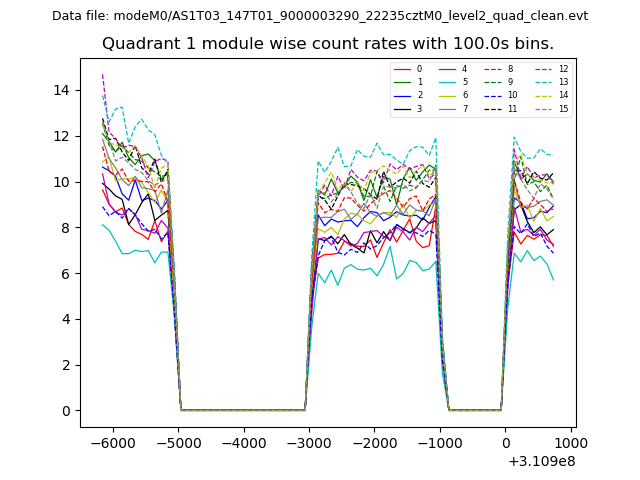
| Module-wise count rates for Quadrant A Data is divided into 100 sec bins |
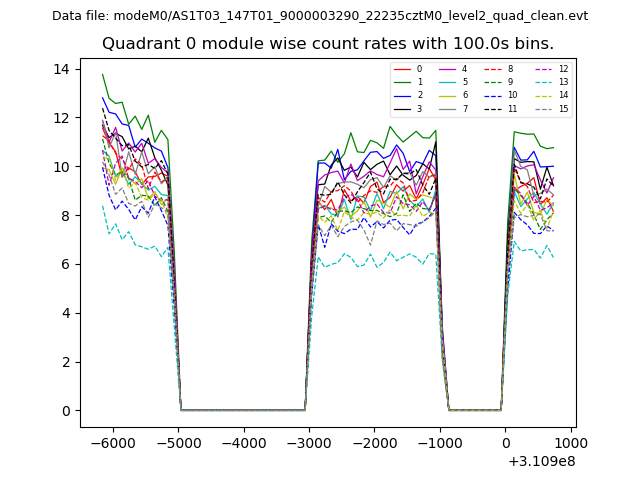 |
 |
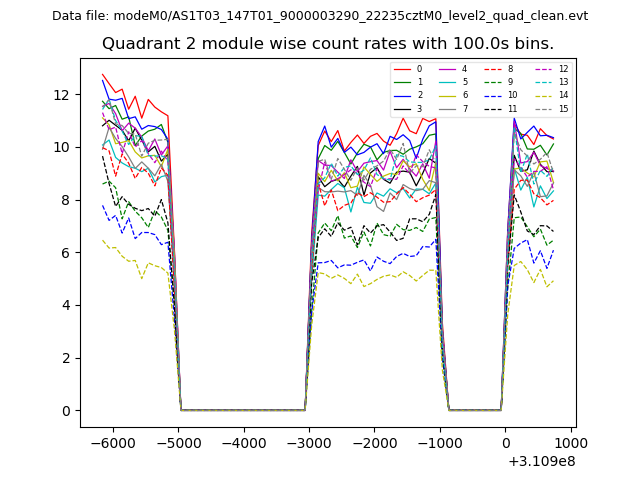
| Module-wise count rates for Quadrant B Data is divided into 100 sec bins |
 |
 |
| Module-wise count rates for Quadrant C Data is divided into 100 sec bins |
 |
 |
| Module-wise count rates for Quadrant D Data is divided into 100 sec bins |
 |
 |
| Parameter | Plot |
|---|---|
| CZT HV Monitor | 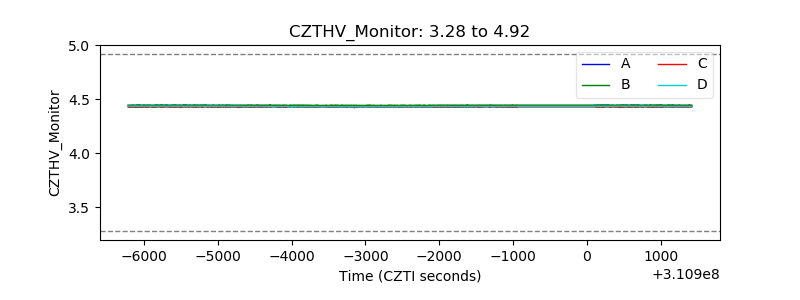 |
| D_VDD | 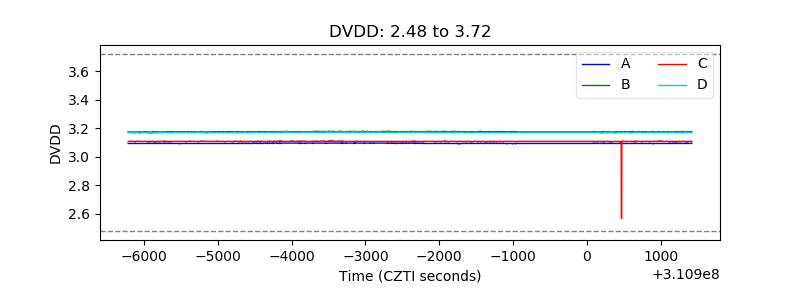 |
| Temperature 1 | 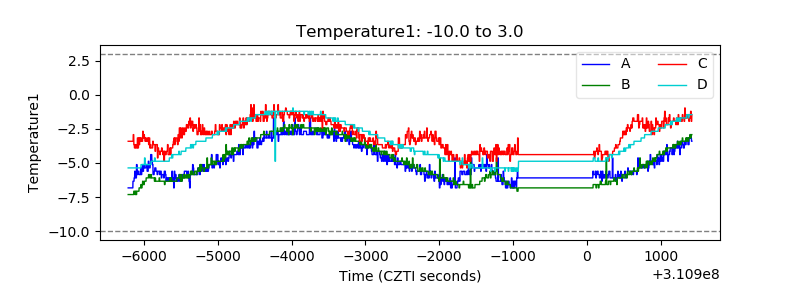 |
| Veto HV Monitor | 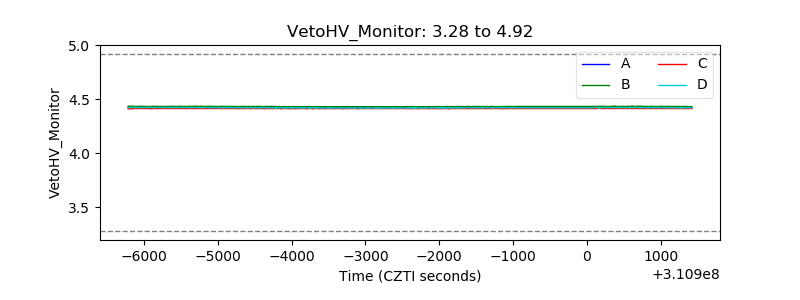 |
| Veto LLD | 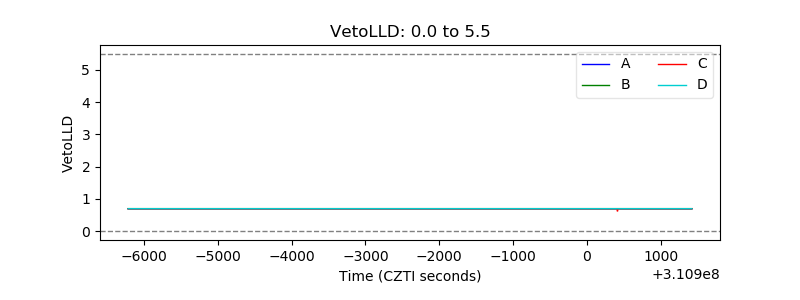 |
| Alpha Counter | 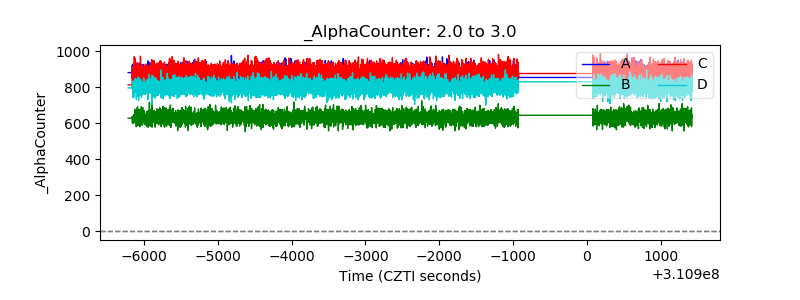 |
| _CPM_Rate | 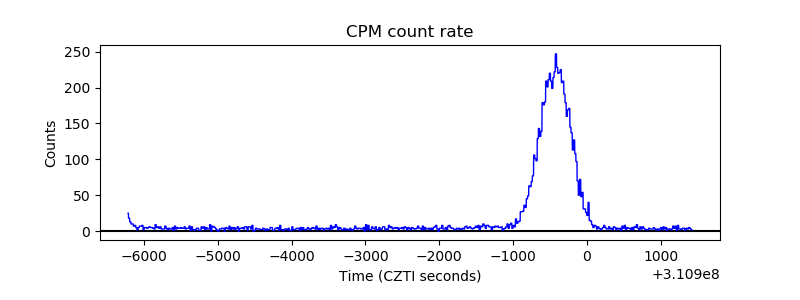 |
| CZT Counter | 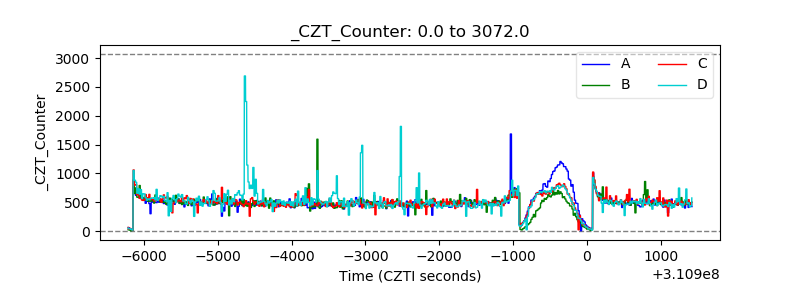 |
| +2.5 Volts monitor |  |
| +5 Volts monitor |  |
| _ROLL_ROT | 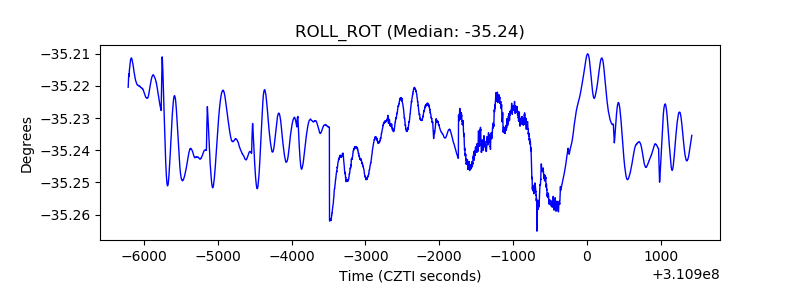 |
| _Roll_DEC | 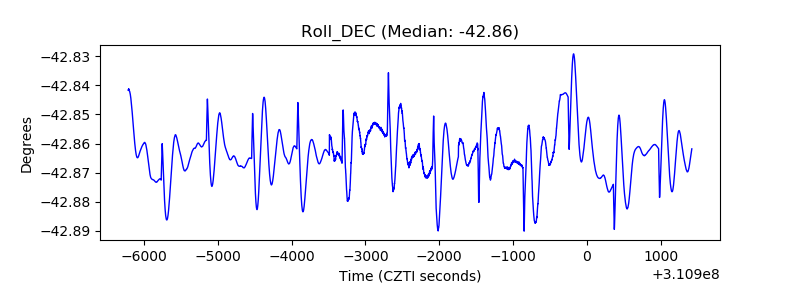 |
| _Roll_RA | 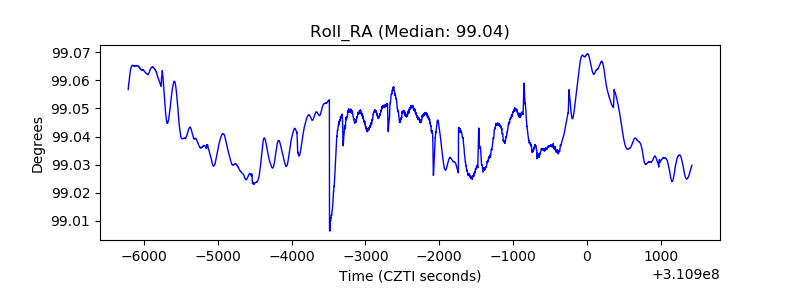 |
| Veto Counter | 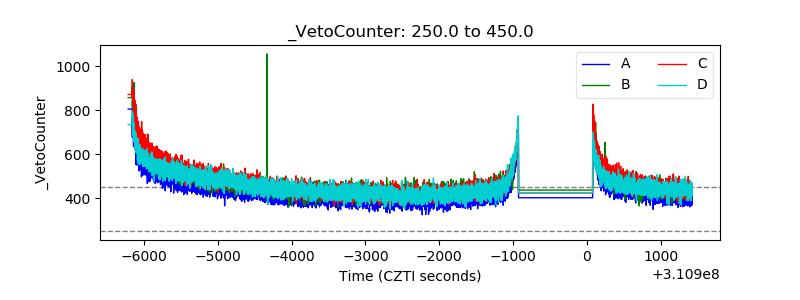 |