| Param | Original file | Final file |
|---|---|---|
| Filename | modeM0/AS1T03_147T01_9000003290_22236cztM0_level2.evt | modeM0/AS1T03_147T01_9000003290_22236cztM0_level2_quad_clean.evt |
| Size (bytes) | 475,041,600 | 86,094,720 |
| Size | 453.0 MB | 82.1 MB |
| Events in quadrant A | 3,461,625 | 537,138 |
| Events in quadrant B | 3,487,405 | 547,482 |
| Events in quadrant C | 3,465,270 | 519,564 |
| Events in quadrant D | 3,494,793 | 513,442 |
| Mode SS | |||
|---|---|---|---|
| Quadrant | BADHDUFLAG | Total packets | Discarded packets |
| A | 0 | 142 | 0 |
| B | 0 | 142 | 0 |
| C | 0 | 142 | 0 |
| D | 0 | 142 | 0 |
| Mode M9 | |||
|---|---|---|---|
| Quadrant | BADHDUFLAG | Total packets | Discarded packets |
| A | 0 | 6 | 0 |
| B | 0 | 7 | 0 |
| C | 0 | 7 | 0 |
| D | 0 | 7 | 0 |
| Mode M0 | |||
|---|---|---|---|
| Quadrant | BADHDUFLAG | Total packets | Discarded packets |
| A | 0 | 14743 | 2 |
| B | 0 | 14700 | 3 |
| C | 0 | 14598 | 2 |
| D | 0 | 14901 | 2 |
| Quadrant | Total seconds | Saturated seconds | Saturation percentage |
|---|---|---|---|
| A | 7027 | 140 | 1.992315% |
| B | 7026 | 154 | 2.191859% |
| C | 7026 | 164 | 2.334187% |
| D | 7026 | 120 | 1.707942% |
Noise dominated data is calculated using 1-second bins in cleaned event files. If a bin has >2000 counts, and if more than 50% of those come from <1% of pixels, then it is considered to be noise-dominated and hence unusable.
| Quadrant | # 1 sec bins | Bins with >0 counts | Bins with >2000 counts | High rate bins dominated by noise | Noise dominated (total time) | Noise dominated (detector-on time) | Marked lightcurve |
|---|---|---|---|---|---|---|---|
| A | 7597 | 7028 | 0 | 0 | 0.00% | 0.00% | 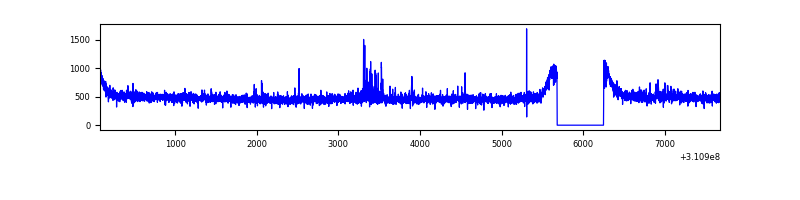 |
| B | 7596 | 7027 | 3 | 3 | 0.04% | 0.04% | 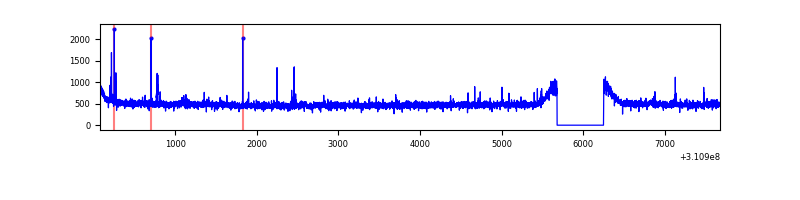 |
| C | 7596 | 7027 | 0 | 0 | 0.00% | 0.00% |  |
| D | 7596 | 7027 | 7 | 7 | 0.09% | 0.10% | 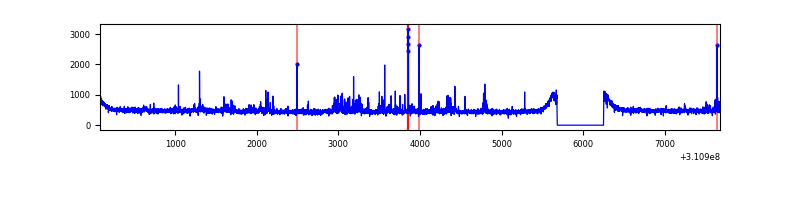 |
Top three noisy pixels from each quadrant. If the there are fewer than three noisy pixels in the level2.evt file, extra rows are filled as -1
| Pixel properties | Quadrant properties | ||||||
|---|---|---|---|---|---|---|---|
| Quadrant | DetID | PixID | Counts | Sigma | Mean | Median | Sigma |
| A | 2 | 79 | 41513 | 228.09 | 882 | 864 | 178.2 |
| A | 15 | 192 | 18516 | 99.05 | 882 | 864 | 178.2 |
| A | 13 | 254 | 10250 | 52.67 | 882 | 864 | 178.2 |
| B | 4 | 173 | 26856 | 154.56 | 875 | 851 | 168.3 |
| B | 12 | 111 | 20371 | 116.02 | 875 | 851 | 168.3 |
| B | 11 | 111 | 18039 | 102.16 | 875 | 851 | 168.3 |
| C | 14 | 238 | 133129 | 665.54 | 852 | 858 | 198.7 |
| C | 0 | 10 | 8949 | 40.71 | 852 | 858 | 198.7 |
| C | 13 | 61 | 5835 | 25.04 | 852 | 858 | 198.7 |
| D | 1 | 52 | 145268 | 688.15 | 868 | 844 | 209.9 |
| D | 2 | 136 | 38176 | 177.88 | 868 | 844 | 209.9 |
| D | 2 | 234 | 27791 | 128.4 | 868 | 844 | 209.9 |
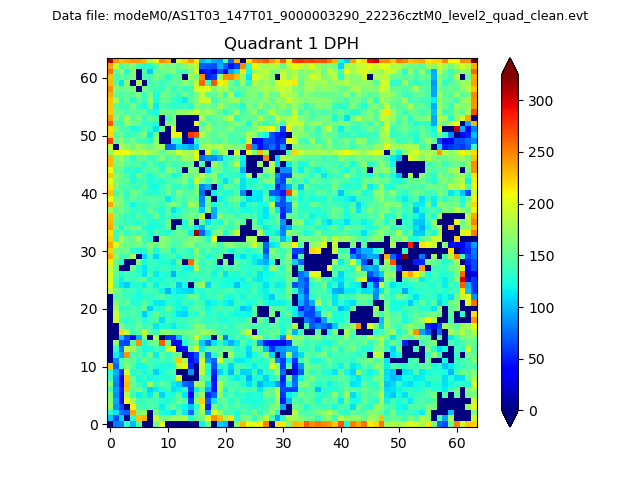
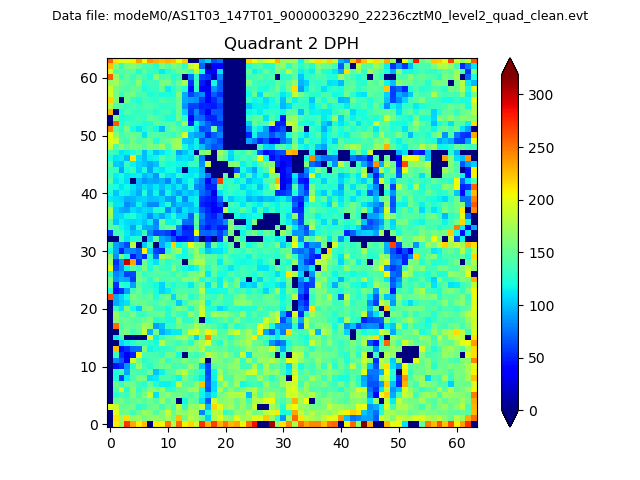
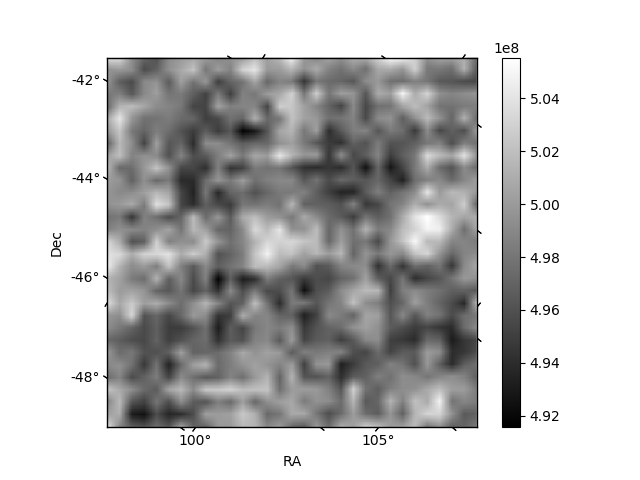
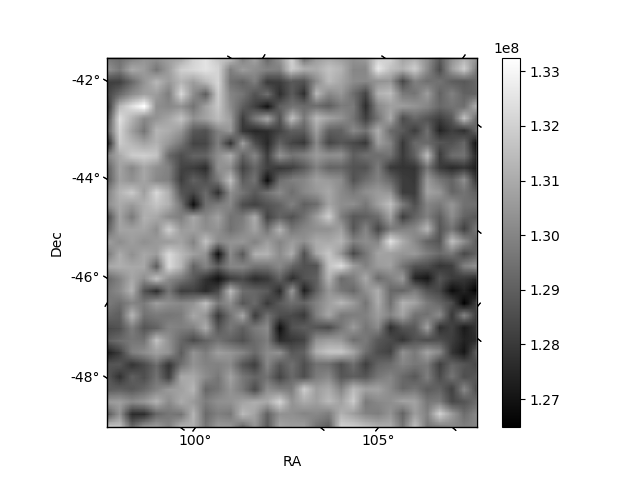
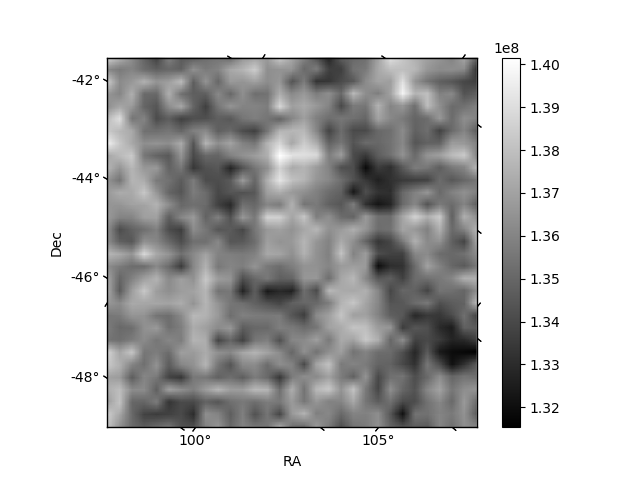
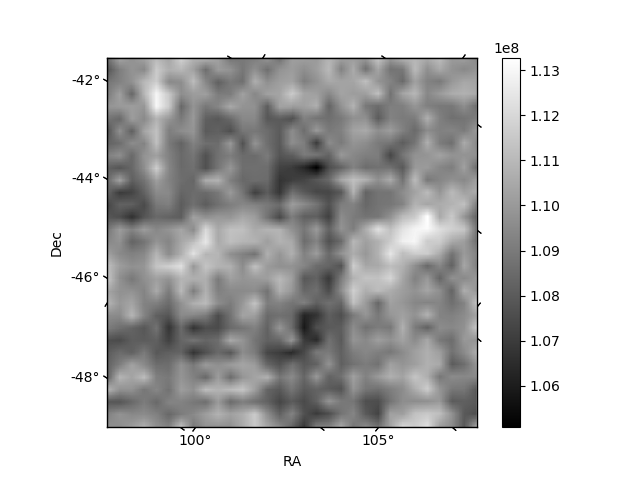
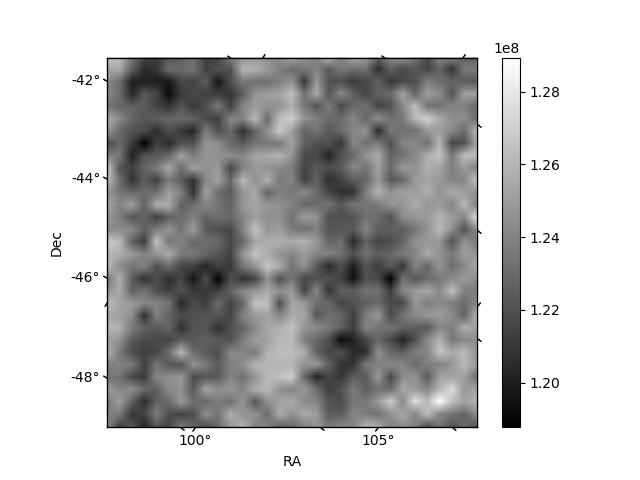
Histogram calculated using DETX and DETY for each event in the final _common_clean file
| Quadrant A | 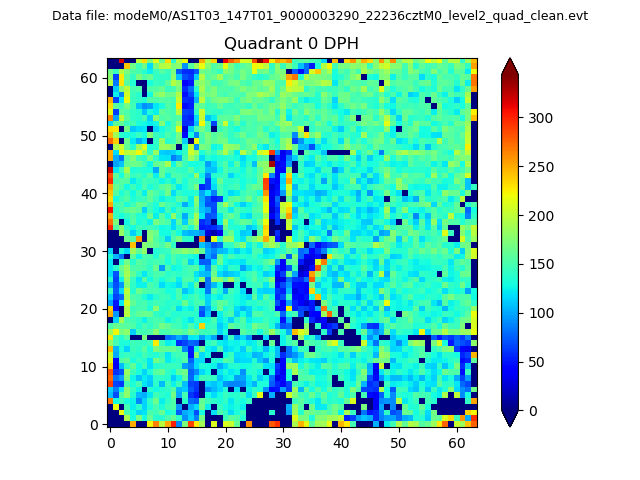 |
 |
Quadrant B |
|---|---|---|---|
| Quadrant D | 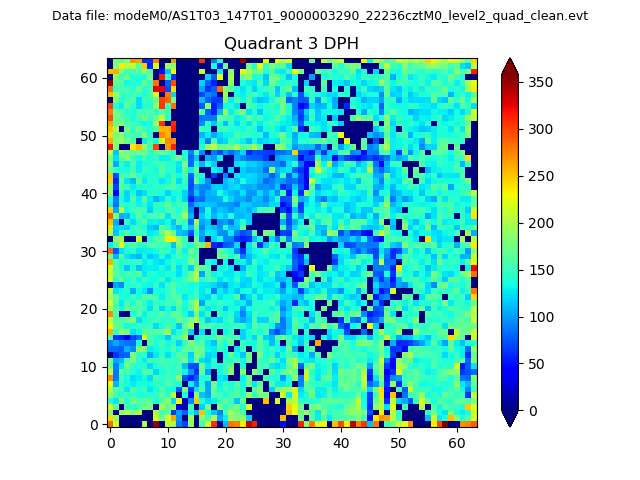 |
 |
Quadrant C |
| Plot type | Count rate plots | Images |
|---|---|---|
| Comparison with Poisson distribution Blue bars denote a histogram of data divided into 1 sec bins. Red curve is a Poisson curve with rate = median count rate of data. |
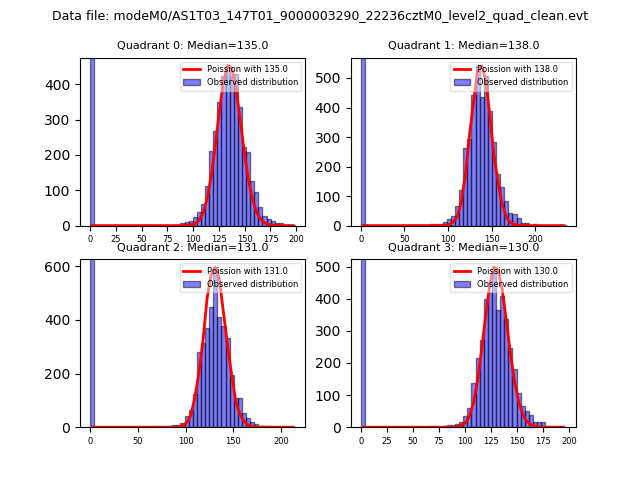 |
 |
| Quadrant-wise count rates Data is divided into 100 sec bins |
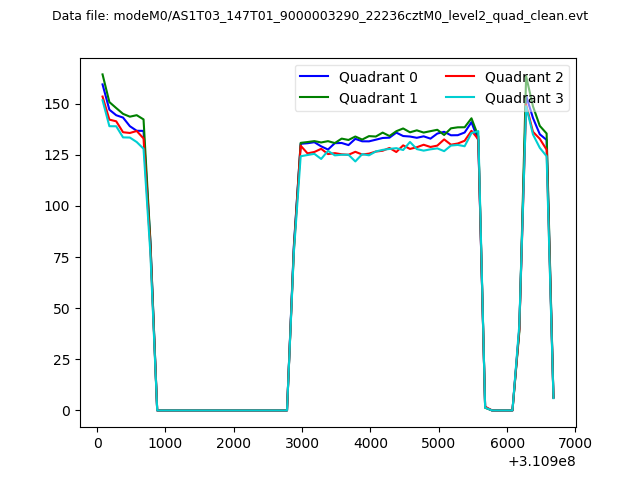 |
|
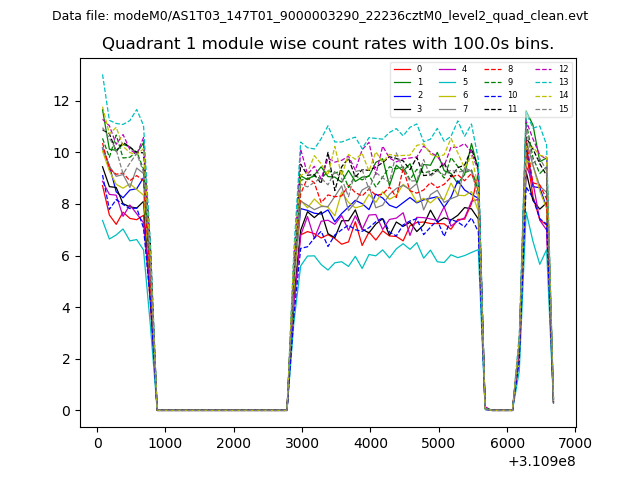
| Module-wise count rates for Quadrant A Data is divided into 100 sec bins |
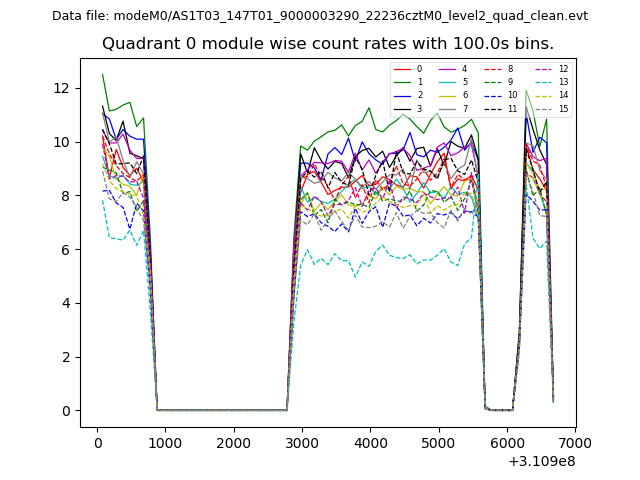 |
 |
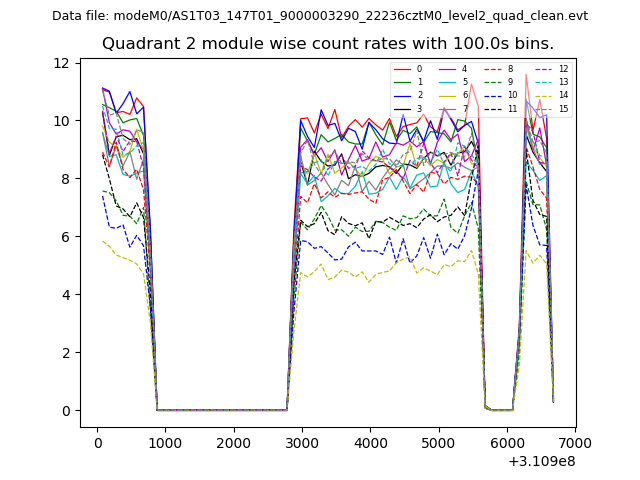
| Module-wise count rates for Quadrant B Data is divided into 100 sec bins |
 |
 |
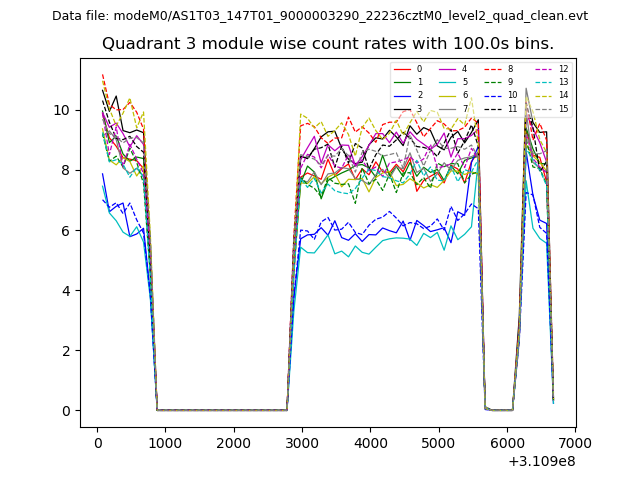
| Module-wise count rates for Quadrant C Data is divided into 100 sec bins |
 |
 |
| Module-wise count rates for Quadrant D Data is divided into 100 sec bins |
 |
 |
| Parameter | Plot |
|---|---|
| CZT HV Monitor | 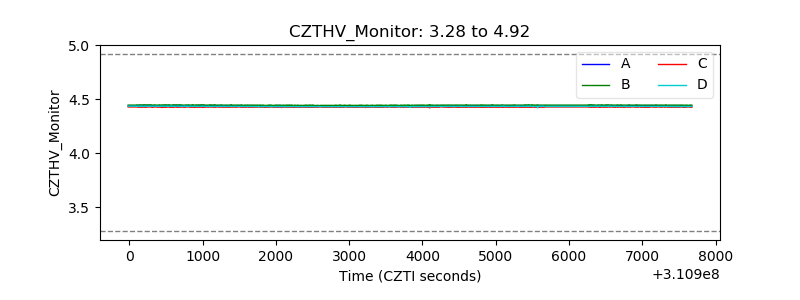 |
| D_VDD | 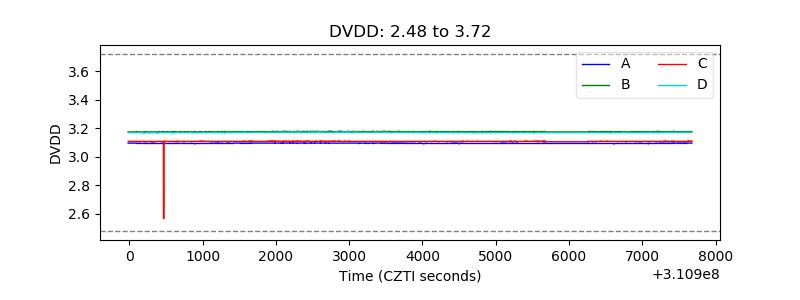 |
| Temperature 1 | 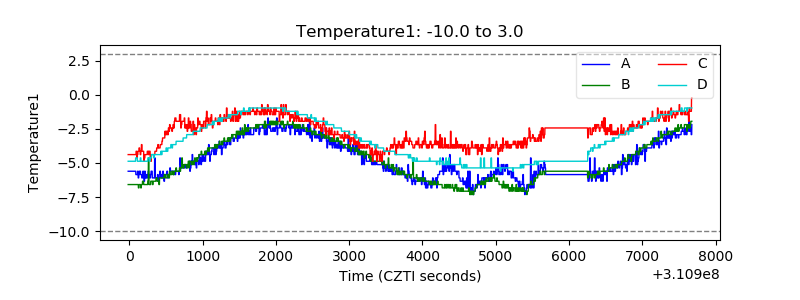 |
| Veto HV Monitor | 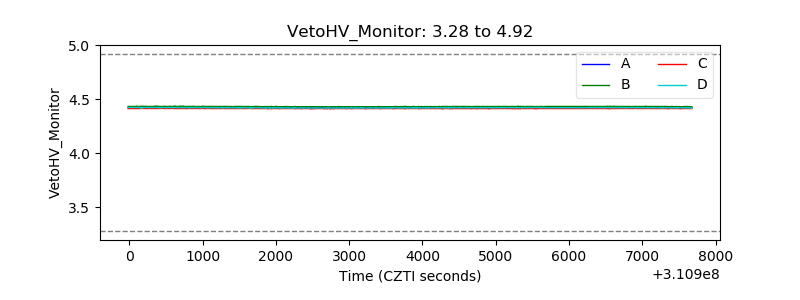 |
| Veto LLD | 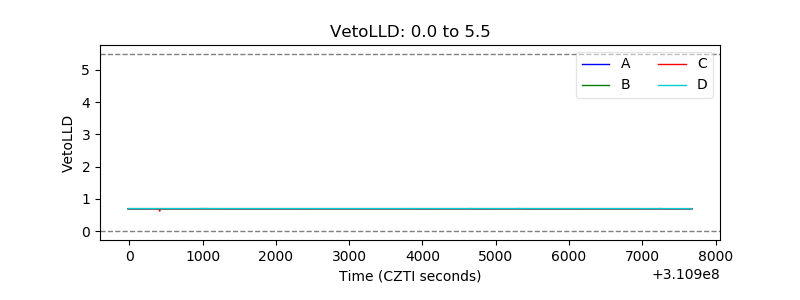 |
| Alpha Counter | 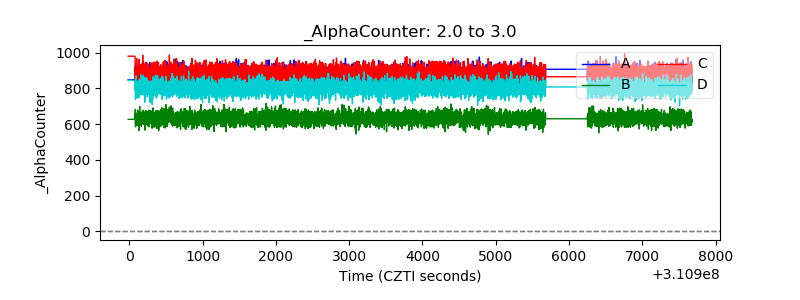 |
| _CPM_Rate | 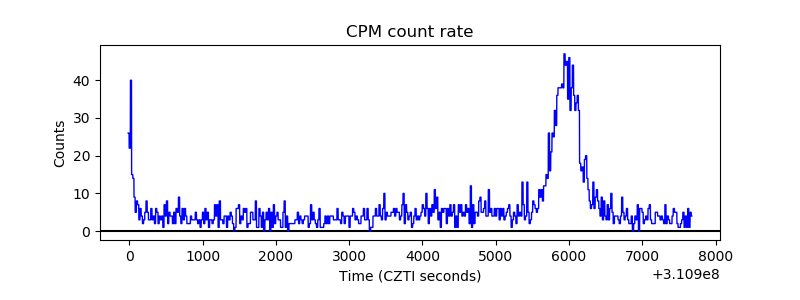 |
| CZT Counter | 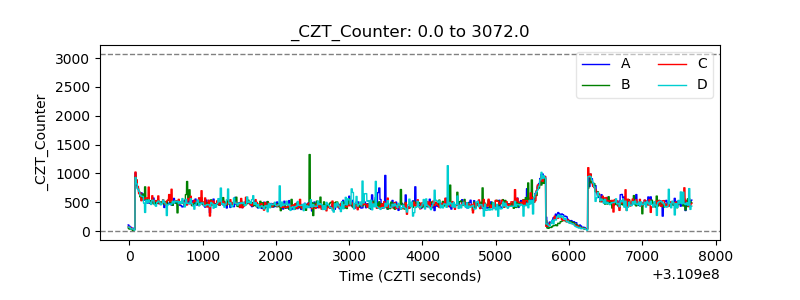 |
| +2.5 Volts monitor |  |
| +5 Volts monitor |  |
| _ROLL_ROT | 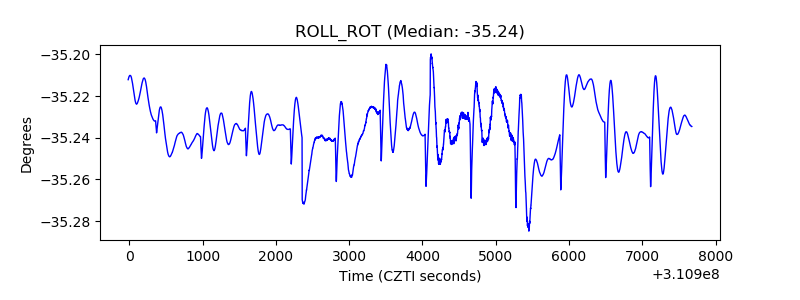 |
| _Roll_DEC | 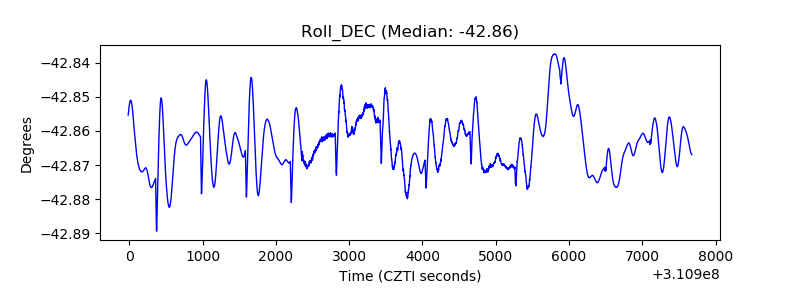 |
| _Roll_RA | 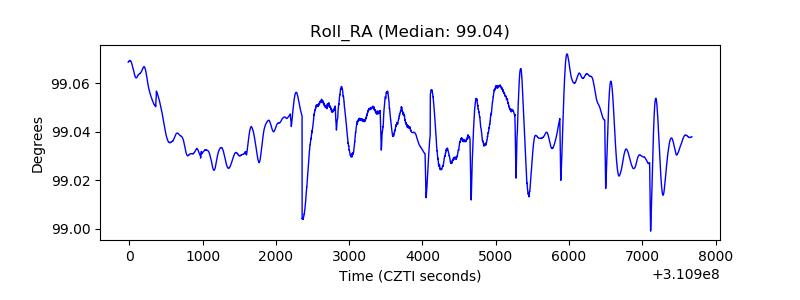 |
| Veto Counter | 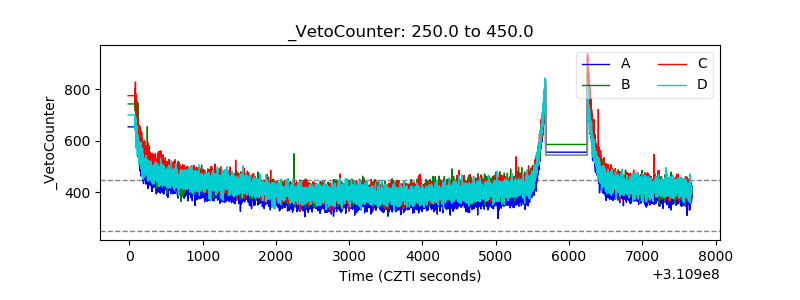 |