| Param | Original file | Final file |
|---|---|---|
| Filename | modeM0/AS1T03_147T01_9000003290_22237cztM0_level2.evt | modeM0/AS1T03_147T01_9000003290_22237cztM0_level2_quad_clean.evt |
| Size (bytes) | 576,181,440 | 86,388,480 |
| Size | 549.5 MB | 82.4 MB |
| Events in quadrant A | 3,877,462 | 525,611 |
| Events in quadrant B | 3,936,671 | 533,692 |
| Events in quadrant C | 3,909,655 | 509,500 |
| Events in quadrant D | 5,187,219 | 494,952 |
| Mode SS | |||
|---|---|---|---|
| Quadrant | BADHDUFLAG | Total packets | Discarded packets |
| A | 0 | 162 | 0 |
| B | 0 | 162 | 0 |
| C | 0 | 162 | 0 |
| D | 0 | 162 | 0 |
| Mode M9 | |||
|---|---|---|---|
| Quadrant | BADHDUFLAG | Total packets | Discarded packets |
| A | 0 | 3 | 0 |
| B | 0 | 4 | 0 |
| C | 0 | 4 | 0 |
| D | 0 | 4 | 0 |
| Mode M0 | |||
|---|---|---|---|
| Quadrant | BADHDUFLAG | Total packets | Discarded packets |
| A | 0 | 16744 | 2 |
| B | 0 | 16699 | 2 |
| C | 0 | 16659 | 3 |
| D | 0 | 20704 | 2 |
| Quadrant | Total seconds | Saturated seconds | Saturation percentage |
|---|---|---|---|
| A | 7939 | 258 | 3.249780% |
| B | 7939 | 266 | 3.350548% |
| C | 7938 | 247 | 3.111615% |
| D | 7938 | 577 | 7.268833% |
Noise dominated data is calculated using 1-second bins in cleaned event files. If a bin has >2000 counts, and if more than 50% of those come from <1% of pixels, then it is considered to be noise-dominated and hence unusable.
| Quadrant | # 1 sec bins | Bins with >0 counts | Bins with >2000 counts | High rate bins dominated by noise | Noise dominated (total time) | Noise dominated (detector-on time) | Marked lightcurve |
|---|---|---|---|---|---|---|---|
| A | 8124 | 7941 | 0 | 0 | 0.00% | 0.00% | 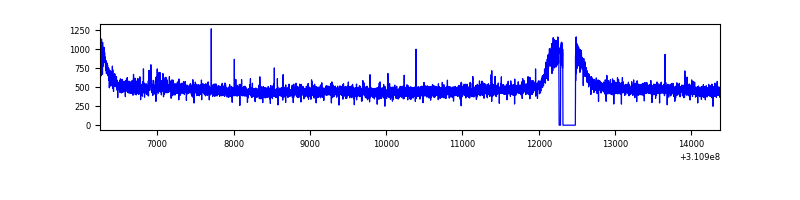 |
| B | 8124 | 7941 | 0 | 0 | 0.00% | 0.00% | 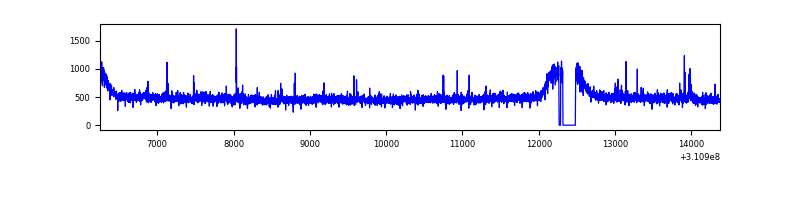 |
| C | 8123 | 7940 | 0 | 0 | 0.00% | 0.00% | 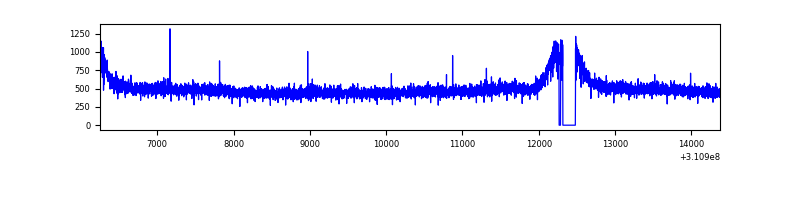 |
| D | 8123 | 7940 | 362 | 362 | 4.46% | 4.56% | 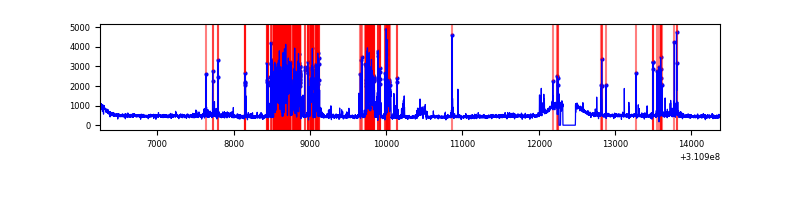 |
Top three noisy pixels from each quadrant. If the there are fewer than three noisy pixels in the level2.evt file, extra rows are filled as -1
| Pixel properties | Quadrant properties | ||||||
|---|---|---|---|---|---|---|---|
| Quadrant | DetID | PixID | Counts | Sigma | Mean | Median | Sigma |
| A | 15 | 192 | 19564 | 92.01 | 1000 | 976 | 202.0 |
| A | 13 | 254 | 11675 | 52.96 | 1000 | 976 | 202.0 |
| A | 3 | 137 | 8982 | 39.63 | 1000 | 976 | 202.0 |
| B | 0 | 190 | 27226 | 136.83 | 989 | 960 | 192.0 |
| B | 12 | 111 | 23709 | 118.51 | 989 | 960 | 192.0 |
| B | 11 | 111 | 21145 | 105.15 | 989 | 960 | 192.0 |
| C | 14 | 238 | 149278 | 648.72 | 963 | 966 | 228.6 |
| C | 13 | 61 | 6655 | 24.88 | 963 | 966 | 228.6 |
| C | 8 | 128 | 5628 | 20.39 | 963 | 966 | 228.6 |
| D | 12 | 235 | 787206 | 3326.84 | 968 | 939 | 236.3 |
| D | 1 | 52 | 549800 | 2322.33 | 968 | 939 | 236.3 |
| D | 2 | 136 | 117665 | 493.89 | 968 | 939 | 236.3 |
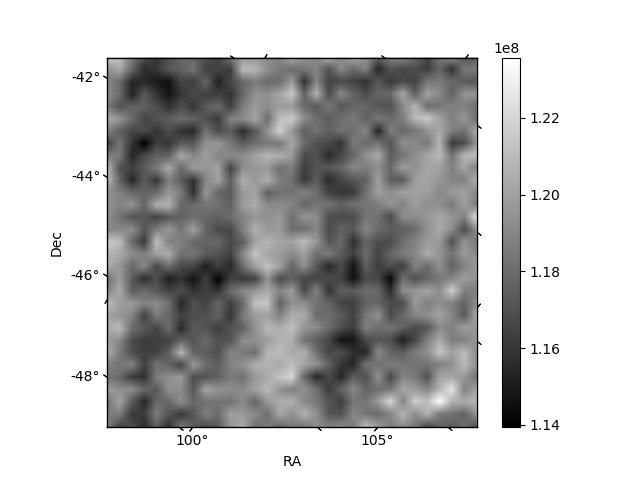
Histogram calculated using DETX and DETY for each event in the final _common_clean file
| Quadrant A | 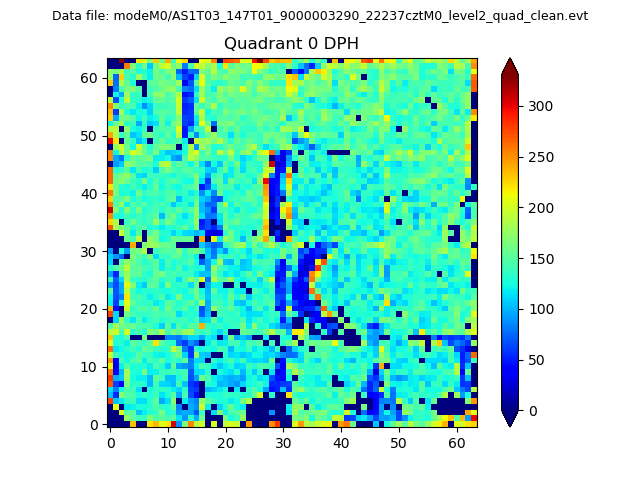 |
 |
Quadrant B |
|---|---|---|---|
| Quadrant D | 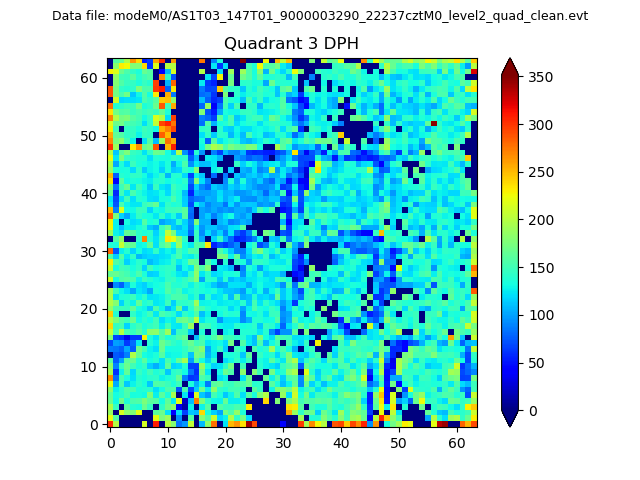 |
 |
Quadrant C |
| Plot type | Count rate plots | Images |
|---|---|---|
| Comparison with Poisson distribution Blue bars denote a histogram of data divided into 1 sec bins. Red curve is a Poisson curve with rate = median count rate of data. |
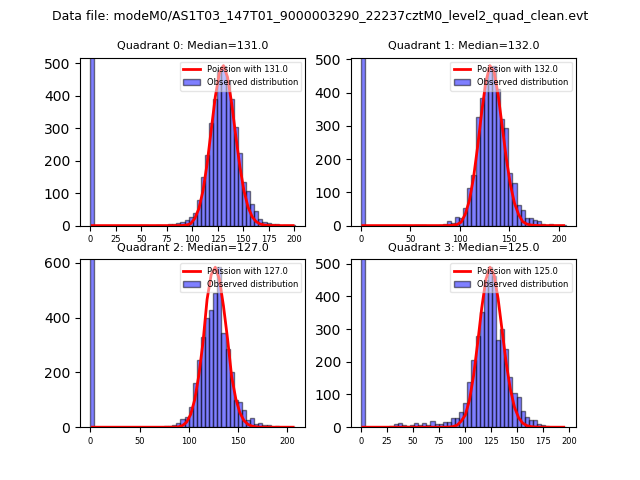 |
 |
| Quadrant-wise count rates Data is divided into 100 sec bins |
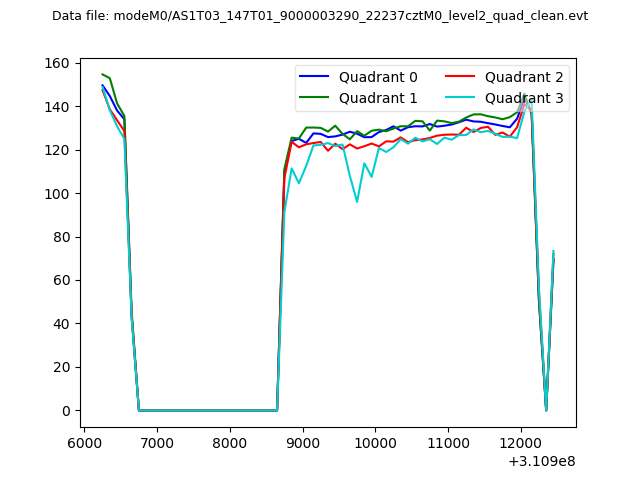 |
|
| Module-wise count rates for Quadrant A Data is divided into 100 sec bins |
 |
 |
| Module-wise count rates for Quadrant B Data is divided into 100 sec bins |
 |
 |
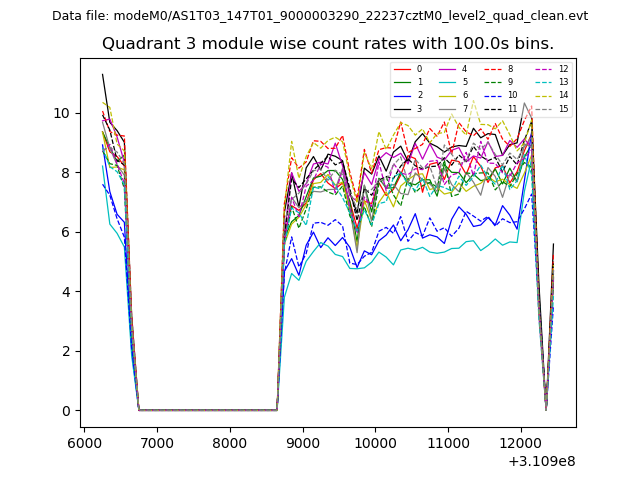
| Module-wise count rates for Quadrant C Data is divided into 100 sec bins |
 |
 |
| Module-wise count rates for Quadrant D Data is divided into 100 sec bins |
 |
 |
| Parameter | Plot |
|---|---|
| CZT HV Monitor |  |
| D_VDD | 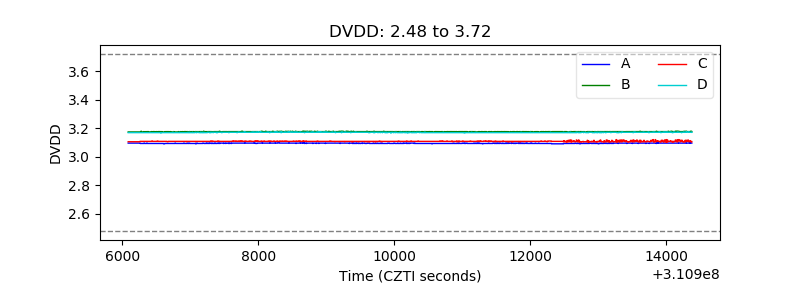 |
| Temperature 1 | 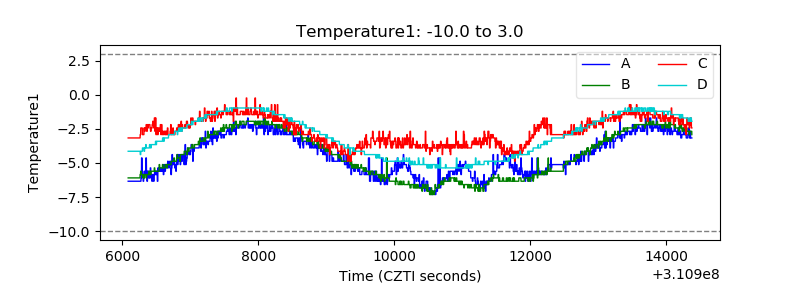 |
| Veto HV Monitor | 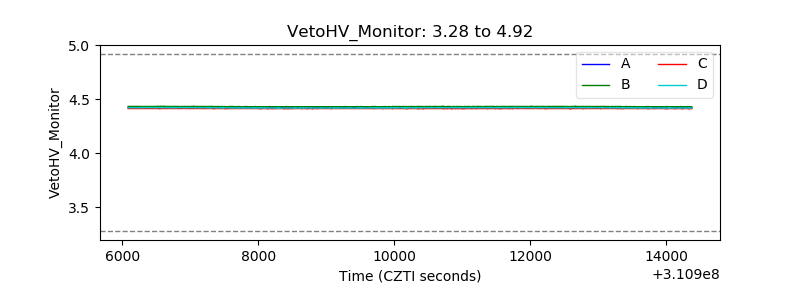 |
| Veto LLD | 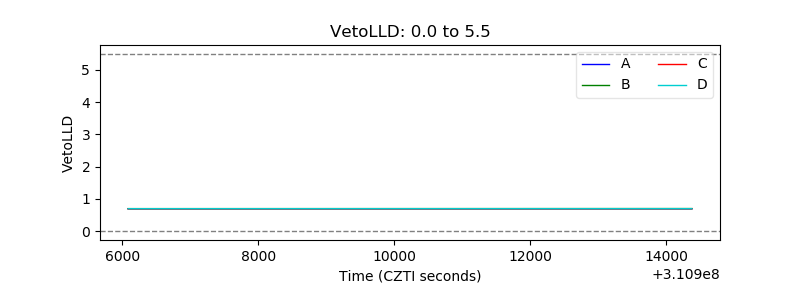 |
| Alpha Counter |  |
| _CPM_Rate | 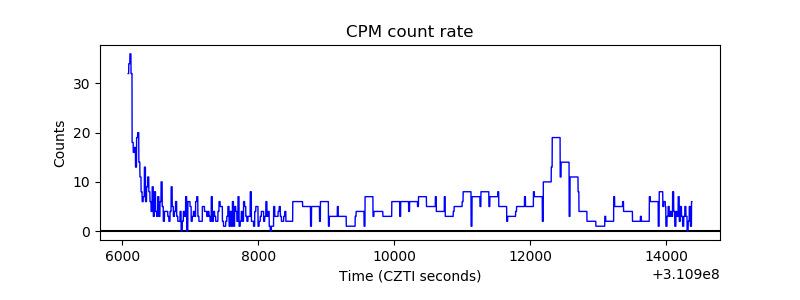 |
| CZT Counter |  |
| +2.5 Volts monitor | 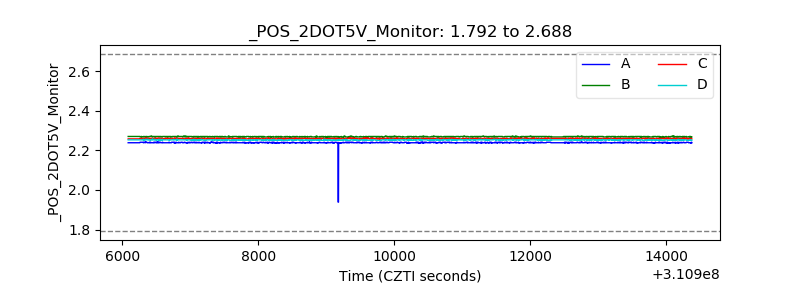 |
| +5 Volts monitor |  |
| _ROLL_ROT | 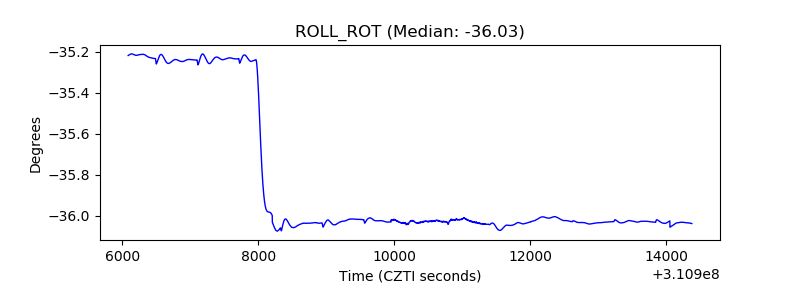 |
| _Roll_DEC | 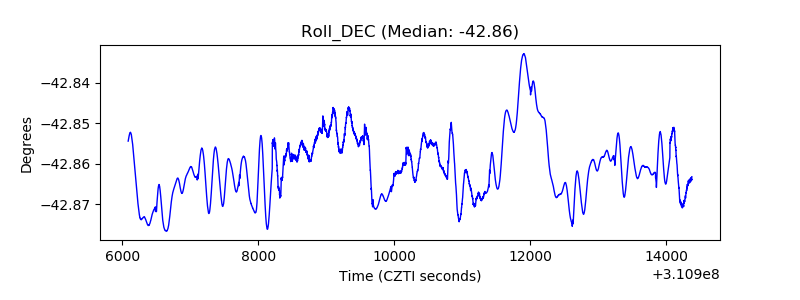 |
| _Roll_RA | 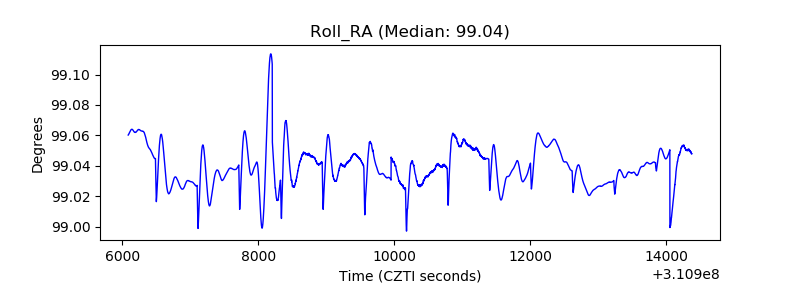 |
| Veto Counter | 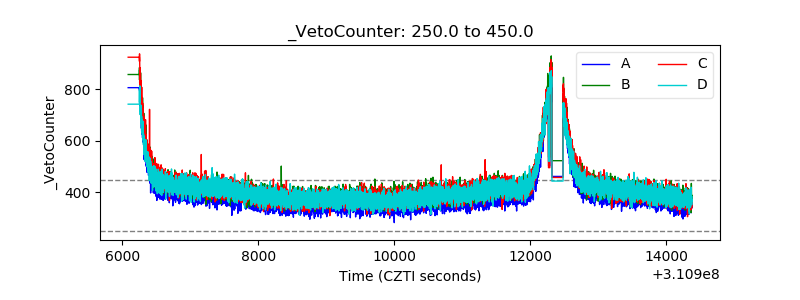 |