| Param | Original file | Final file |
|---|---|---|
| Filename | modeM0/AS1T03_147T01_9000003290_22246cztM0_level2.evt | modeM0/AS1T03_147T01_9000003290_22246cztM0_level2_quad_clean.evt |
| Size (bytes) | 662,955,840 | 99,907,200 |
| Size | 632.2 MB | 95.3 MB |
| Events in quadrant A | 3,177,373 | 666,806 |
| Events in quadrant B | 3,290,431 | 696,878 |
| Events in quadrant C | 3,888,032 | 652,698 |
| Events in quadrant D | 9,295,932 | 569,942 |
| Mode SS | |||
|---|---|---|---|
| Quadrant | BADHDUFLAG | Total packets | Discarded packets |
| A | 0 | 126 | 0 |
| B | 0 | 126 | 0 |
| C | 0 | 126 | 0 |
| D | 0 | 126 | 0 |
| Mode M9 | |||
|---|---|---|---|
| Quadrant | BADHDUFLAG | Total packets | Discarded packets |
| A | 0 | 21 | 0 |
| B | 0 | 22 | 0 |
| C | 0 | 22 | 0 |
| D | 0 | 22 | 0 |
| Mode M0 | |||
|---|---|---|---|
| Quadrant | BADHDUFLAG | Total packets | Discarded packets |
| A | 0 | 13237 | 2 |
| B | 0 | 13537 | 2 |
| C | 0 | 15330 | 2 |
| D | 0 | 31807 | 2 |
| Quadrant | Total seconds | Saturated seconds | Saturation percentage |
|---|---|---|---|
| A | 6293 | 10 | 0.158907% |
| B | 6293 | 31 | 0.492611% |
| C | 6293 | 214 | 3.400604% |
| D | 6293 | 2749 | 43.683458% |
Noise dominated data is calculated using 1-second bins in cleaned event files. If a bin has >2000 counts, and if more than 50% of those come from <1% of pixels, then it is considered to be noise-dominated and hence unusable.
| Quadrant | # 1 sec bins | Bins with >0 counts | Bins with >2000 counts | High rate bins dominated by noise | Noise dominated (total time) | Noise dominated (detector-on time) | Marked lightcurve |
|---|---|---|---|---|---|---|---|
| A | 7603 | 6294 | 0 | 0 | 0.00% | 0.00% | 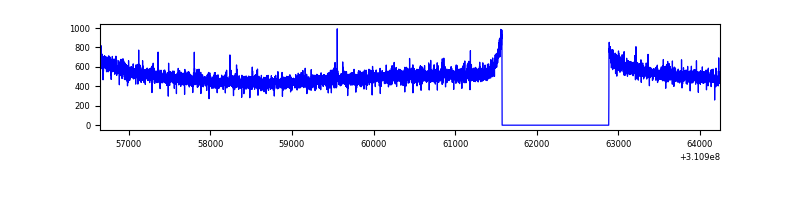 |
| B | 7603 | 6294 | 2 | 2 | 0.03% | 0.03% | 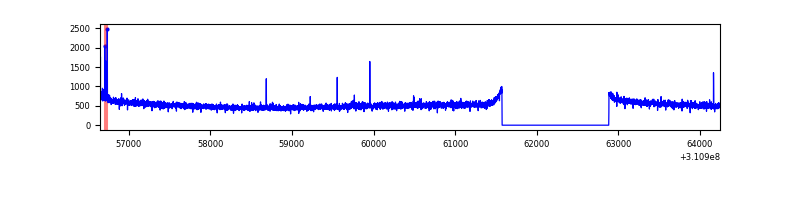 |
| C | 7603 | 6294 | 110 | 110 | 1.45% | 1.75% | 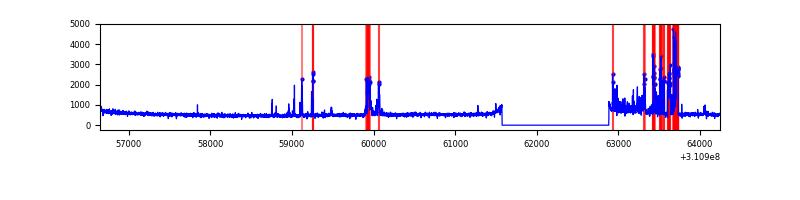 |
| D | 7603 | 6294 | 2387 | 2387 | 31.40% | 37.93% | 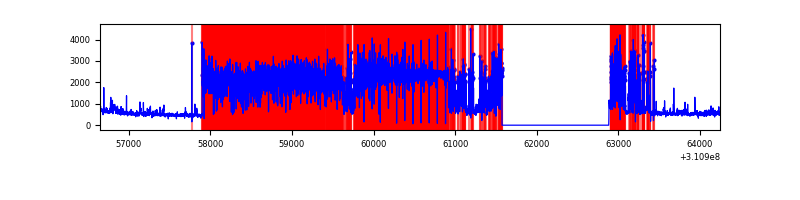 |
Top three noisy pixels from each quadrant. If the there are fewer than three noisy pixels in the level2.evt file, extra rows are filled as -1
| Pixel properties | Quadrant properties | ||||||
|---|---|---|---|---|---|---|---|
| Quadrant | DetID | PixID | Counts | Sigma | Mean | Median | Sigma |
| A | 13 | 254 | 8598 | 47.26 | 824 | 808 | 164.8 |
| A | 0 | 226 | 7085 | 38.08 | 824 | 808 | 164.8 |
| A | 3 | 137 | 6688 | 35.67 | 824 | 808 | 164.8 |
| B | 12 | 111 | 18500 | 114.42 | 835 | 814 | 154.6 |
| B | 0 | 197 | 16622 | 102.27 | 835 | 814 | 154.6 |
| B | 11 | 111 | 16083 | 98.78 | 835 | 814 | 154.6 |
| C | 10 | 22 | 584413 | 3078.75 | 813 | 820 | 189.6 |
| C | 14 | 238 | 128792 | 675.12 | 813 | 820 | 189.6 |
| C | 0 | 10 | 6063 | 27.66 | 813 | 820 | 189.6 |
| D | 1 | 52 | 6558251 | 42468.75 | 648 | 634 | 154.4 |
| D | 12 | 235 | 190670 | 1230.72 | 648 | 634 | 154.4 |
| D | 2 | 136 | 55939 | 358.17 | 648 | 634 | 154.4 |
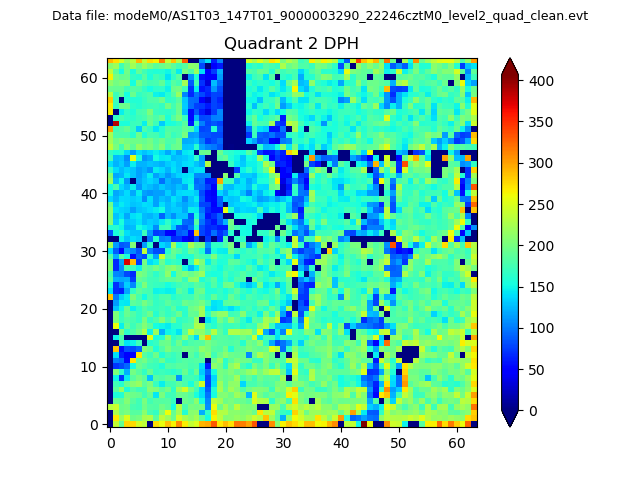
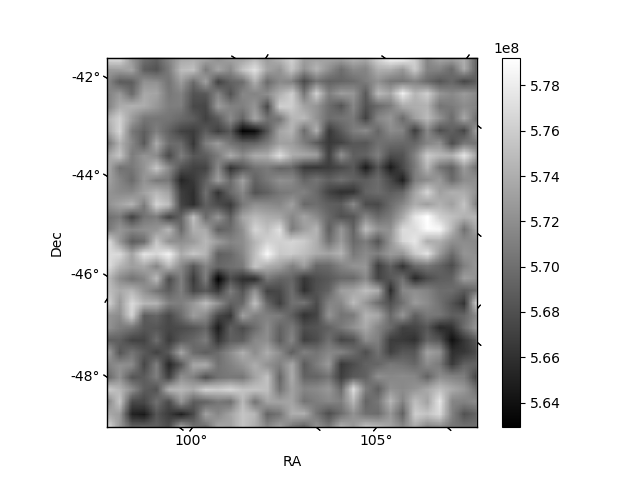
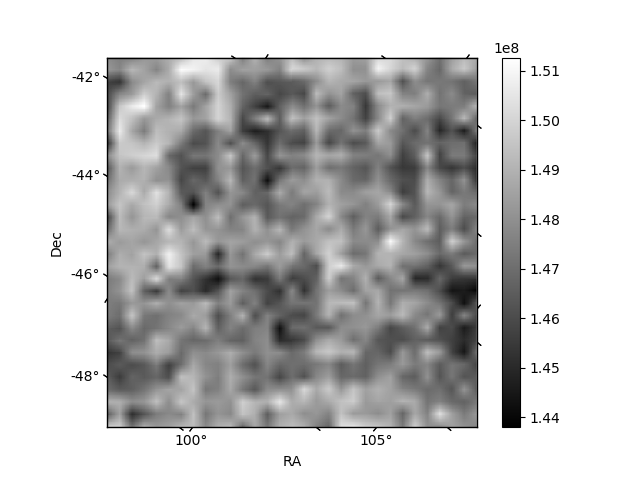
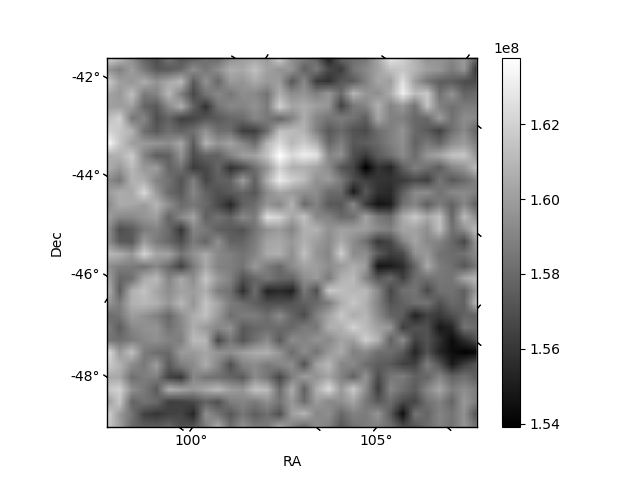
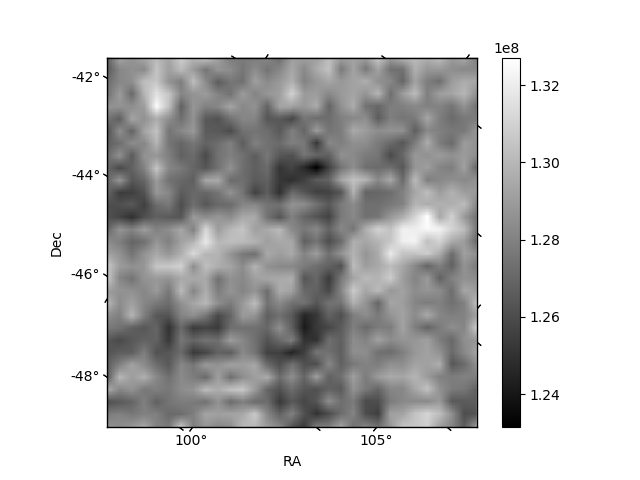
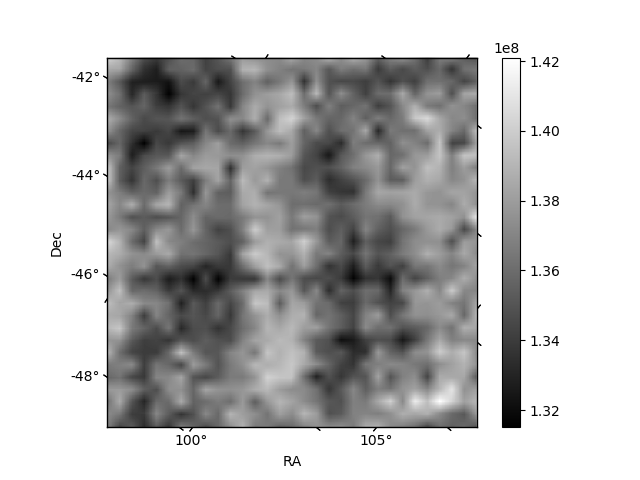
Histogram calculated using DETX and DETY for each event in the final _common_clean file
| Quadrant A | 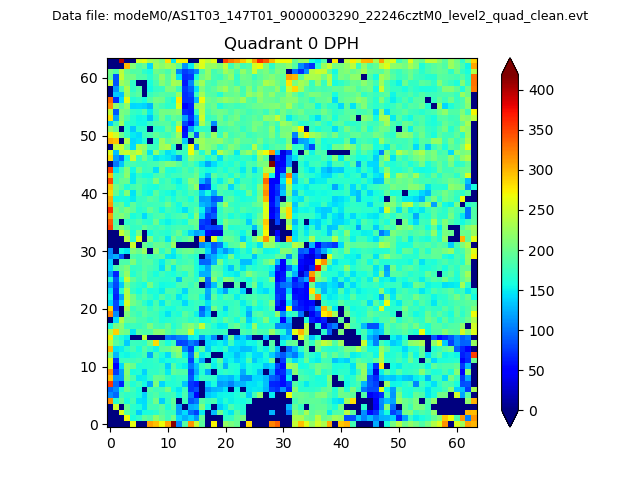 |
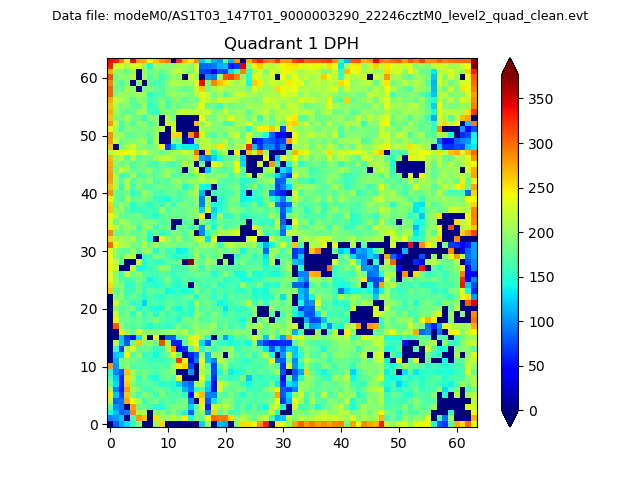 |
Quadrant B |
|---|---|---|---|
| Quadrant D | 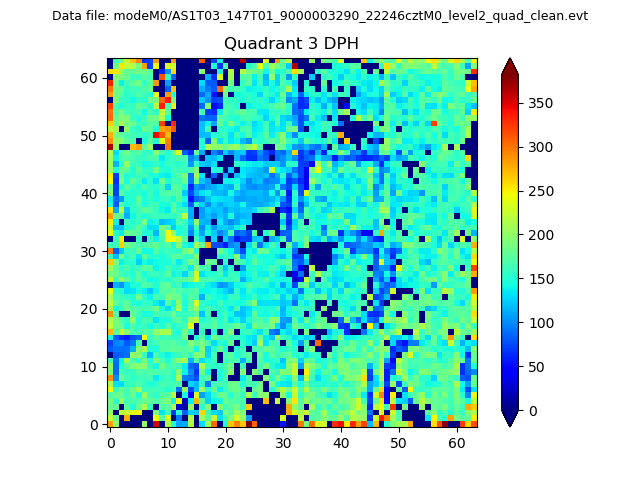 |
 |
Quadrant C |
| Plot type | Count rate plots | Images |
|---|---|---|
| Comparison with Poisson distribution Blue bars denote a histogram of data divided into 1 sec bins. Red curve is a Poisson curve with rate = median count rate of data. |
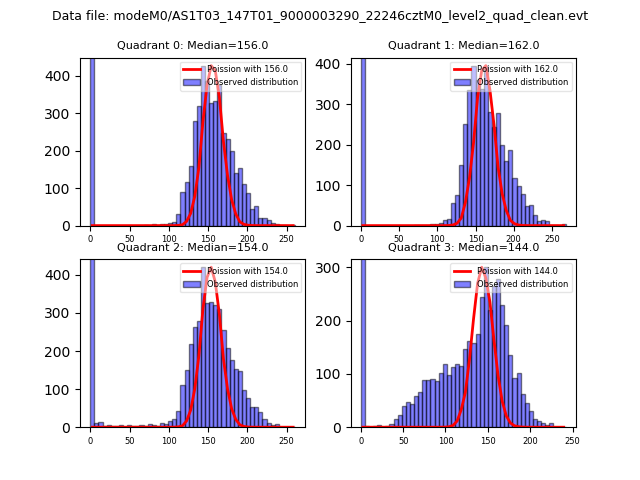 |
 |
| Quadrant-wise count rates Data is divided into 100 sec bins |
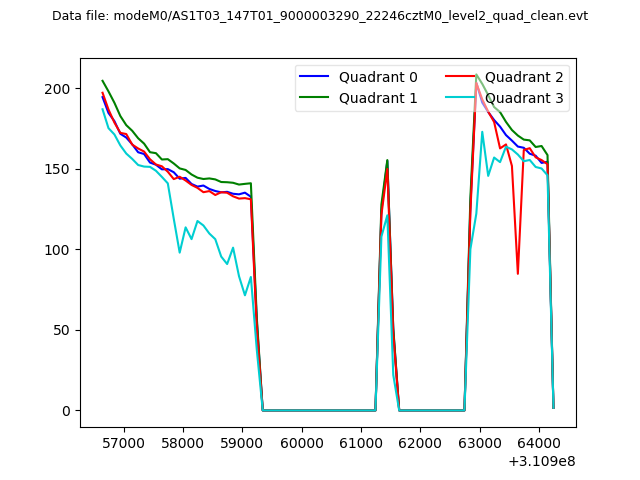 |
|
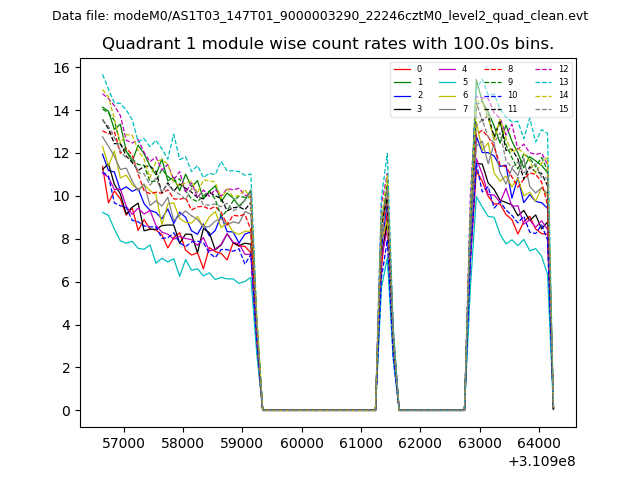
| Module-wise count rates for Quadrant A Data is divided into 100 sec bins |
 |
 |
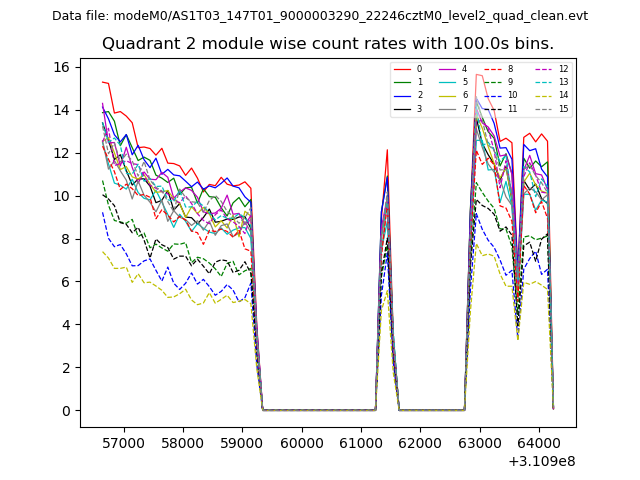
| Module-wise count rates for Quadrant B Data is divided into 100 sec bins |
 |
 |
| Module-wise count rates for Quadrant C Data is divided into 100 sec bins |
 |
 |
| Module-wise count rates for Quadrant D Data is divided into 100 sec bins |
 |
 |
| Parameter | Plot |
|---|---|
| CZT HV Monitor |  |
| D_VDD | 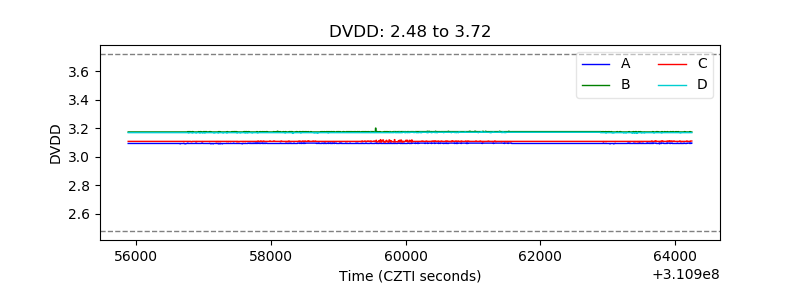 |
| Temperature 1 | 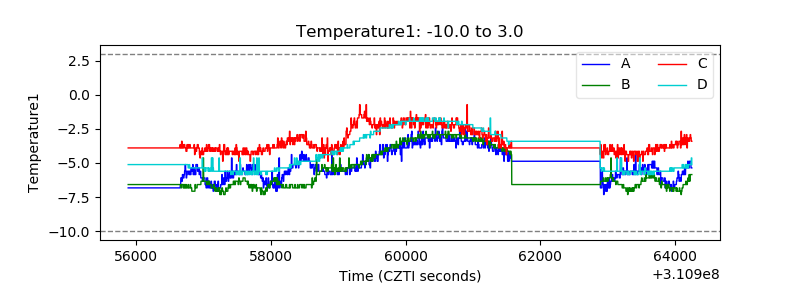 |
| Veto HV Monitor | 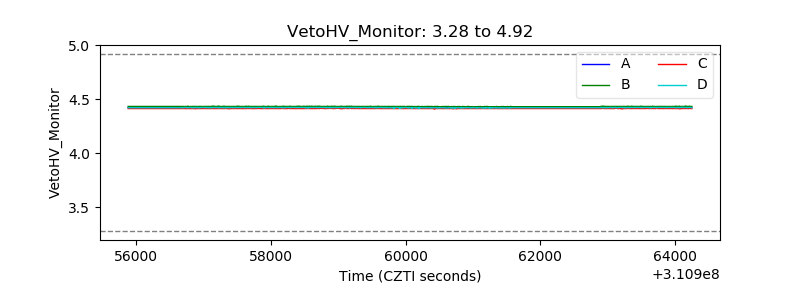 |
| Veto LLD | 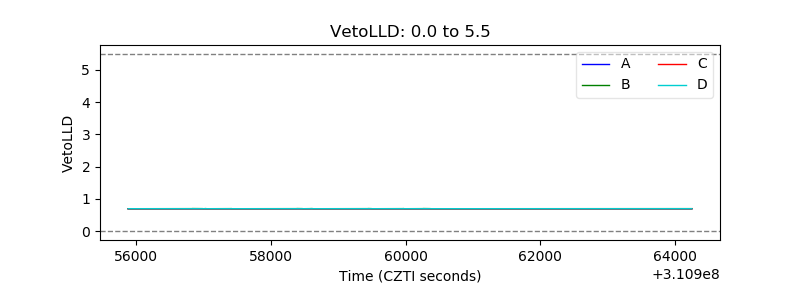 |
| Alpha Counter | 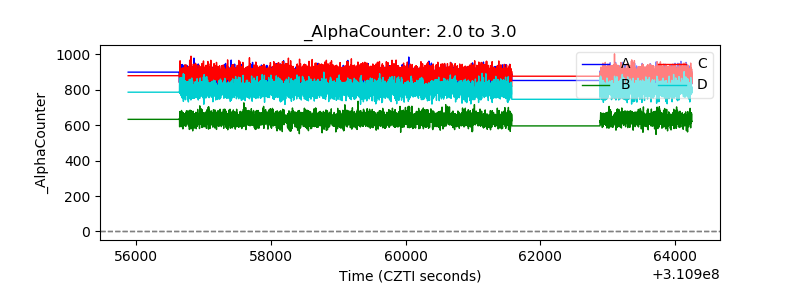 |
| _CPM_Rate | 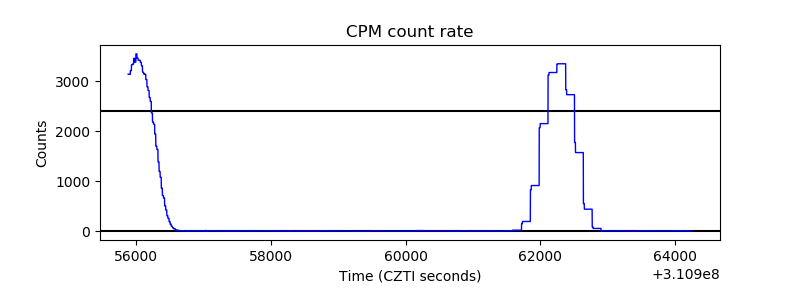 |
| CZT Counter | 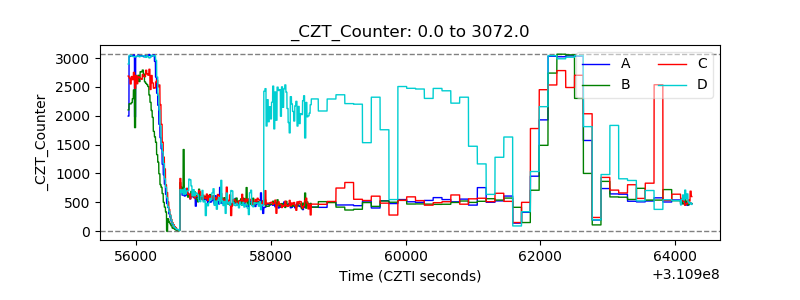 |
| +2.5 Volts monitor |  |
| +5 Volts monitor |  |
| _ROLL_ROT |  |
| _Roll_DEC | 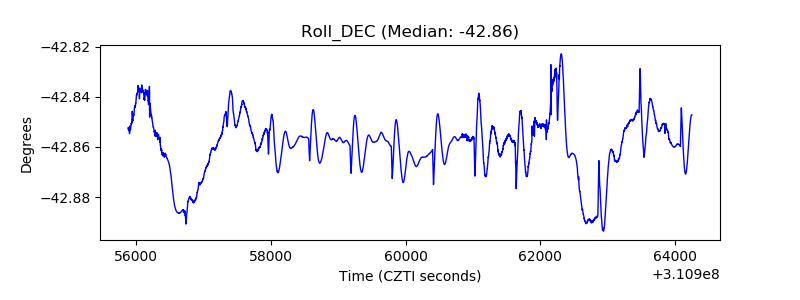 |
| _Roll_RA | 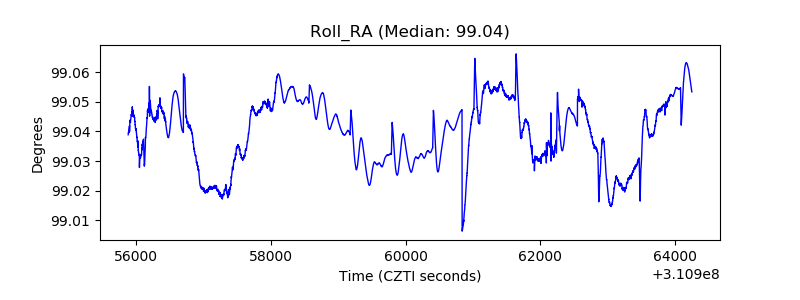 |
| Veto Counter | 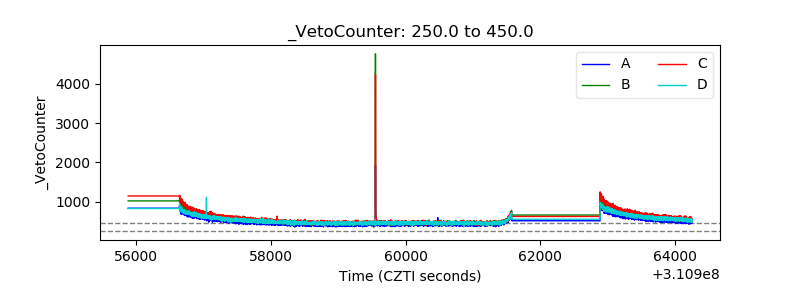 |