| Param | Original file | Final file |
|---|---|---|
| Filename | modeM0/AS1T03_147T01_9000003290_22247cztM0_level2.evt | modeM0/AS1T03_147T01_9000003290_22247cztM0_level2_quad_clean.evt |
| Size (bytes) | 195,289,920 | 47,505,600 |
| Size | 186.2 MB | 45.3 MB |
| Events in quadrant A | 1,046,352 | 333,352 |
| Events in quadrant B | 1,080,955 | 346,992 |
| Events in quadrant C | 1,577,459 | 320,550 |
| Events in quadrant D | 2,069,608 | 290,115 |
| Mode SS | |||
|---|---|---|---|
| Quadrant | BADHDUFLAG | Total packets | Discarded packets |
| A | 0 | 40 | 0 |
| B | 0 | 40 | 0 |
| C | 0 | 40 | 0 |
| D | 0 | 40 | 0 |
| Mode M9 | |||
|---|---|---|---|
| Quadrant | BADHDUFLAG | Total packets | Discarded packets |
| A | 0 | 6 | 0 |
| B | 0 | 7 | 0 |
| C | 0 | 7 | 0 |
| D | 0 | 7 | 0 |
| Mode M0 | |||
|---|---|---|---|
| Quadrant | BADHDUFLAG | Total packets | Discarded packets |
| A | 0 | 4328 | 1 |
| B | 0 | 4448 | 1 |
| C | 0 | 5957 | 1 |
| D | 0 | 7433 | 1 |
| Quadrant | Total seconds | Saturated seconds | Saturation percentage |
|---|---|---|---|
| A | 2030 | 1 | 0.049261% |
| B | 2030 | 2 | 0.098522% |
| C | 2030 | 150 | 7.389163% |
| D | 2030 | 421 | 20.738916% |
Noise dominated data is calculated using 1-second bins in cleaned event files. If a bin has >2000 counts, and if more than 50% of those come from <1% of pixels, then it is considered to be noise-dominated and hence unusable.
| Quadrant | # 1 sec bins | Bins with >0 counts | Bins with >2000 counts | High rate bins dominated by noise | Noise dominated (total time) | Noise dominated (detector-on time) | Marked lightcurve |
|---|---|---|---|---|---|---|---|
| A | 2030 | 2030 | 0 | 0 | 0.00% | 0.00% | 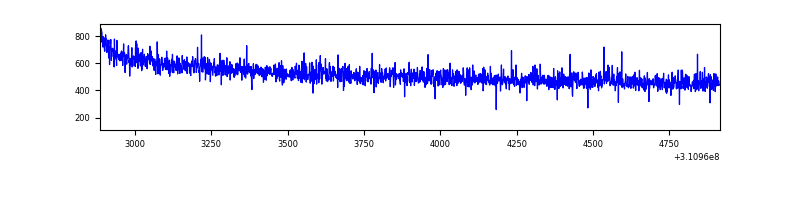 |
| B | 2030 | 2030 | 0 | 0 | 0.00% | 0.00% | 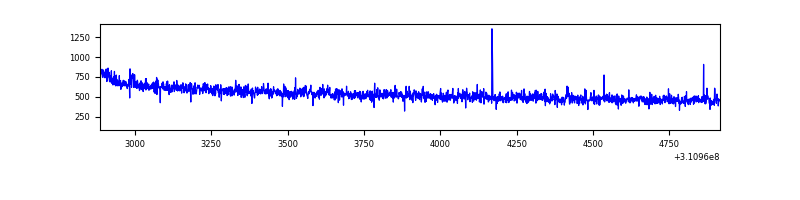 |
| C | 2030 | 2030 | 96 | 96 | 4.73% | 4.73% | 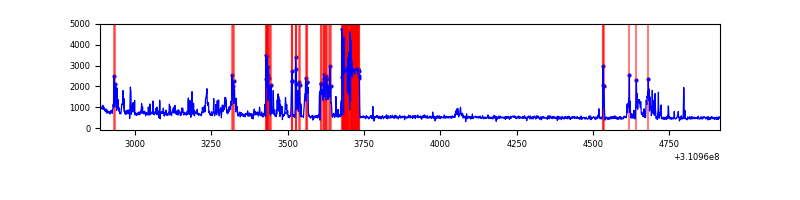 |
| D | 2030 | 2030 | 363 | 363 | 17.88% | 17.88% | 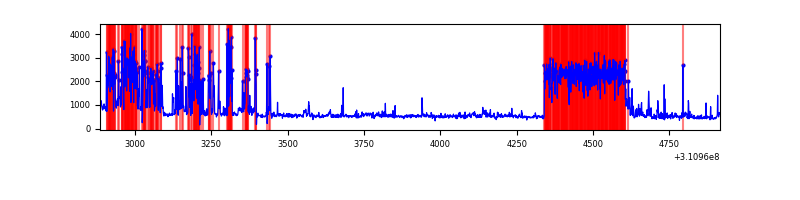 |
Top three noisy pixels from each quadrant. If the there are fewer than three noisy pixels in the level2.evt file, extra rows are filled as -1
| Pixel properties | Quadrant properties | ||||||
|---|---|---|---|---|---|---|---|
| Quadrant | DetID | PixID | Counts | Sigma | Mean | Median | Sigma |
| A | 13 | 254 | 2970 | 48.71 | 271 | 268 | 55.5 |
| A | 0 | 226 | 2299 | 36.61 | 271 | 268 | 55.5 |
| A | 3 | 137 | 2075 | 32.57 | 271 | 268 | 55.5 |
| B | 12 | 111 | 5676 | 103.93 | 275 | 269 | 52.0 |
| B | 11 | 111 | 4977 | 90.49 | 275 | 269 | 52.0 |
| B | 14 | 111 | 4711 | 85.38 | 275 | 269 | 52.0 |
| C | 10 | 22 | 493623 | 7785.44 | 266 | 270 | 63.4 |
| C | 14 | 238 | 42612 | 668.19 | 266 | 270 | 63.4 |
| C | 0 | 10 | 2263 | 31.45 | 266 | 270 | 63.4 |
| D | 1 | 52 | 1089360 | 18147.19 | 249 | 243 | 60.0 |
| D | 13 | 104 | 38256 | 633.38 | 249 | 243 | 60.0 |
| D | 2 | 234 | 6230 | 99.76 | 249 | 243 | 60.0 |
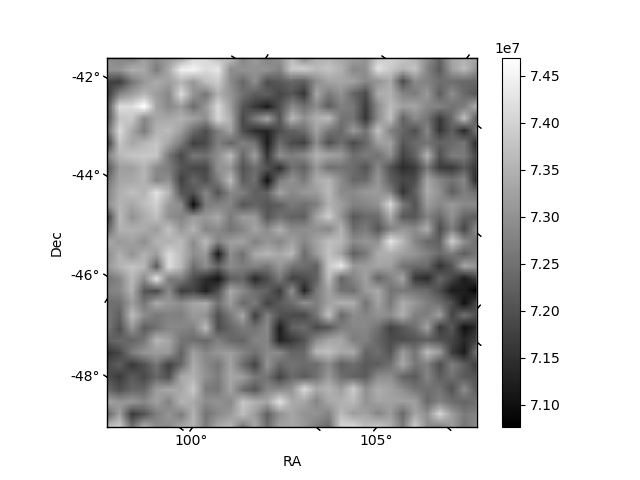
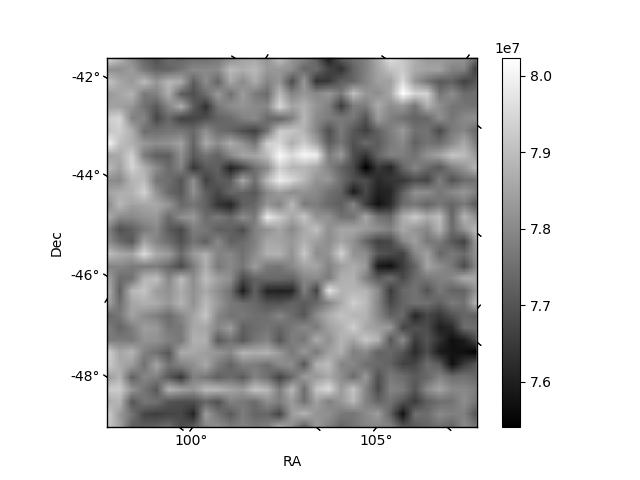
Histogram calculated using DETX and DETY for each event in the final _common_clean file
| Quadrant A | 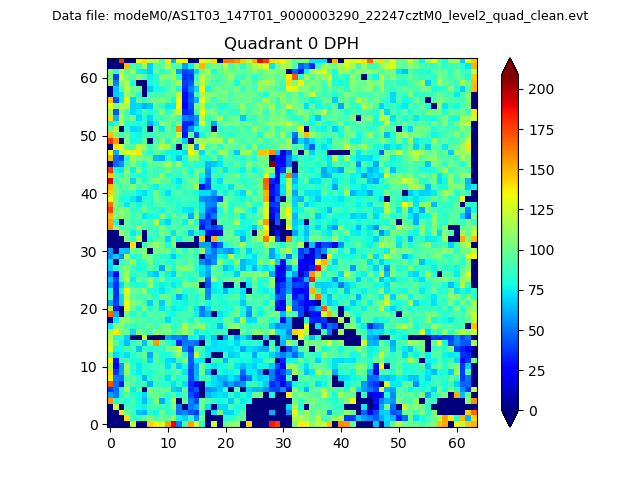 |
 |
Quadrant B |
|---|---|---|---|
| Quadrant D | 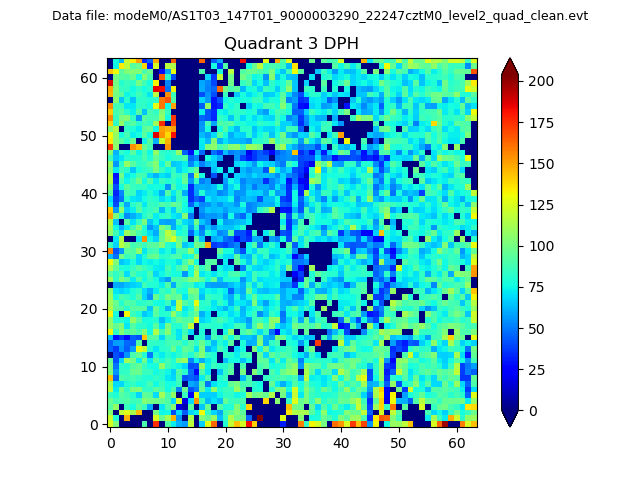 |
 |
Quadrant C |
| Plot type | Count rate plots | Images |
|---|---|---|
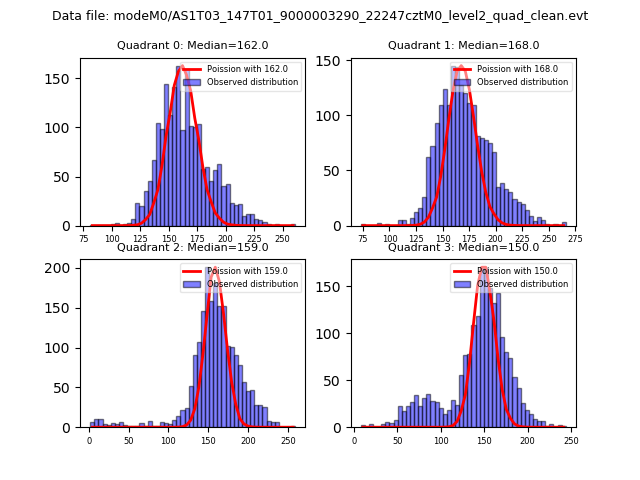
| Comparison with Poisson distribution Blue bars denote a histogram of data divided into 1 sec bins. Red curve is a Poisson curve with rate = median count rate of data. |
 |
 |
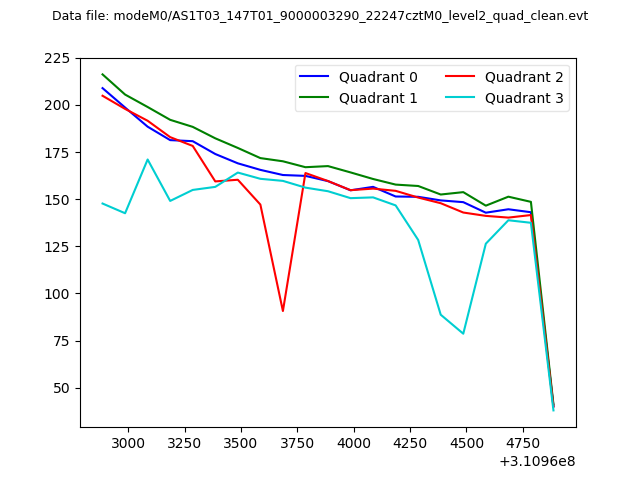
| Quadrant-wise count rates Data is divided into 100 sec bins |
 |
|
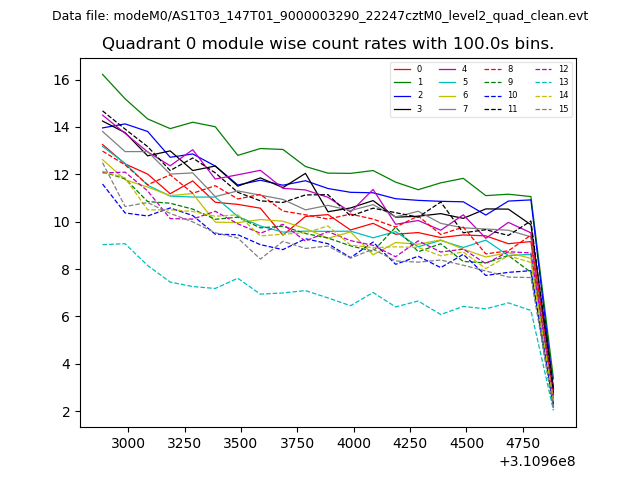
| Module-wise count rates for Quadrant A Data is divided into 100 sec bins |
 |
 |
| Module-wise count rates for Quadrant B Data is divided into 100 sec bins |
 |
 |
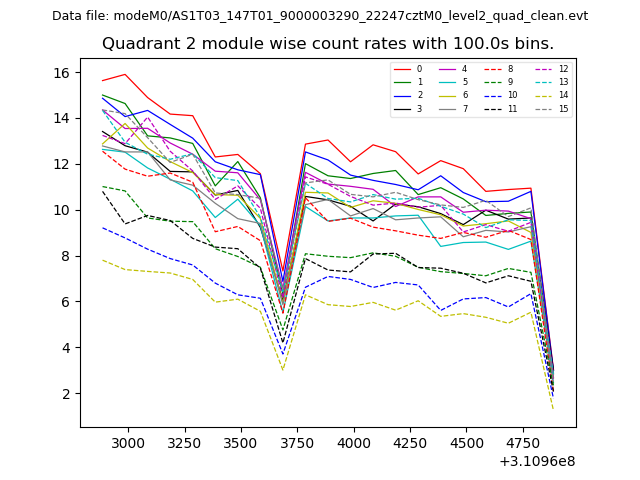
| Module-wise count rates for Quadrant C Data is divided into 100 sec bins |
 |
 |
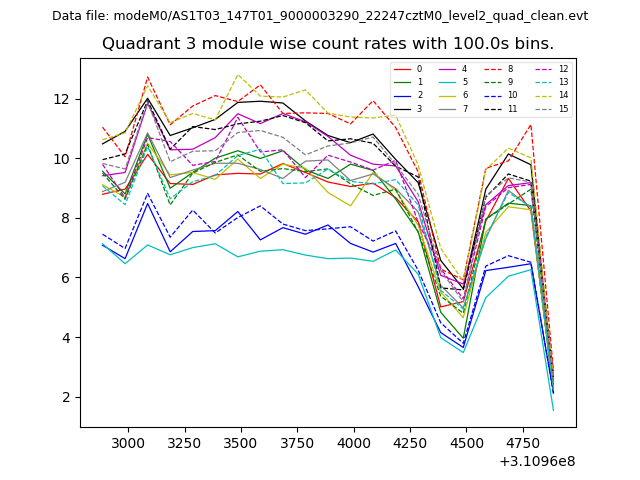
| Module-wise count rates for Quadrant D Data is divided into 100 sec bins |
 |
 |
| Parameter | Plot |
|---|---|
| CZT HV Monitor | 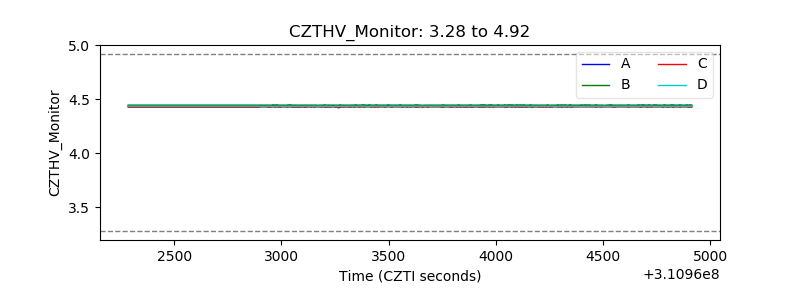 |
| D_VDD | 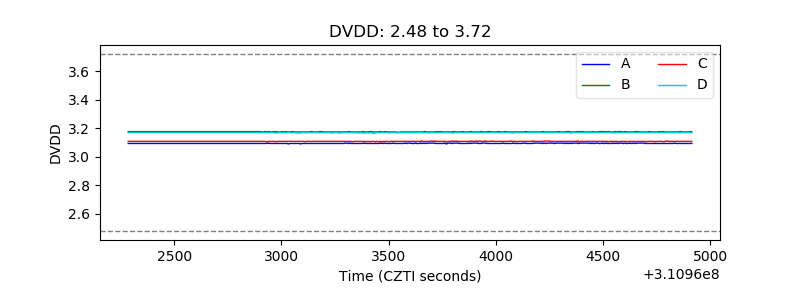 |
| Temperature 1 | 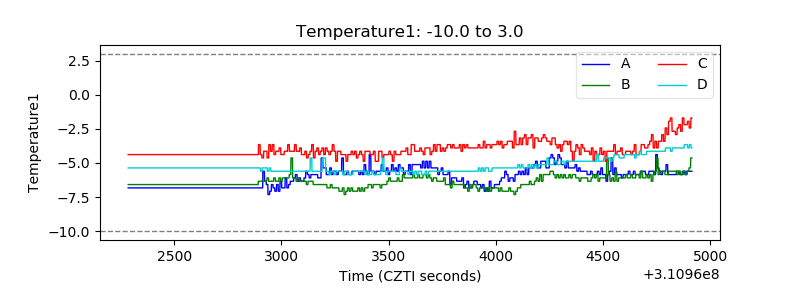 |
| Veto HV Monitor | 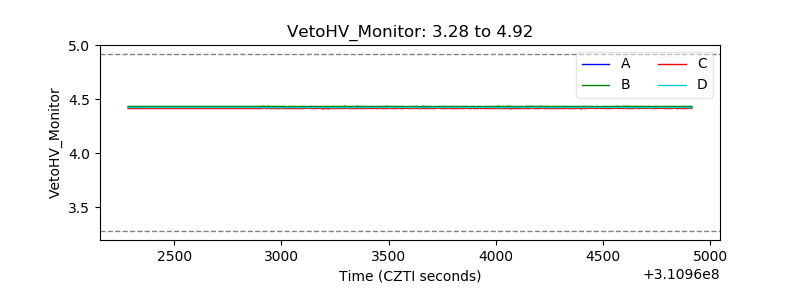 |
| Veto LLD |  |
| Alpha Counter | 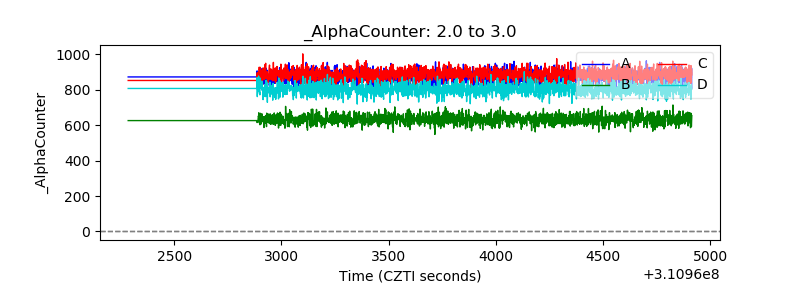 |
| _CPM_Rate | 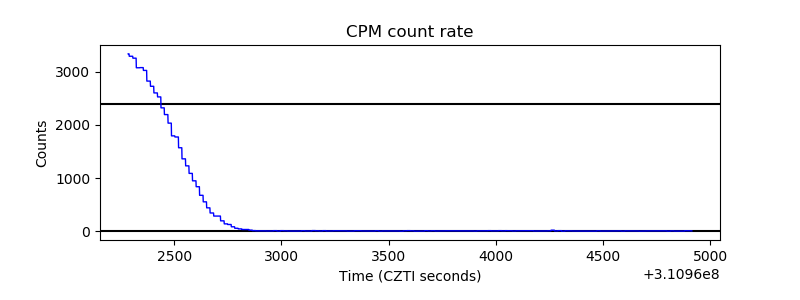 |
| CZT Counter |  |
| +2.5 Volts monitor | 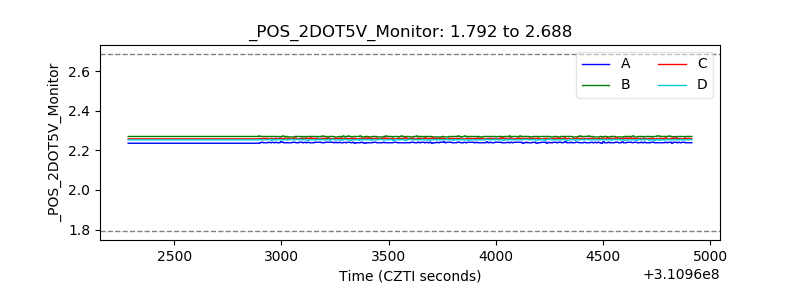 |
| +5 Volts monitor |  |
| _ROLL_ROT | 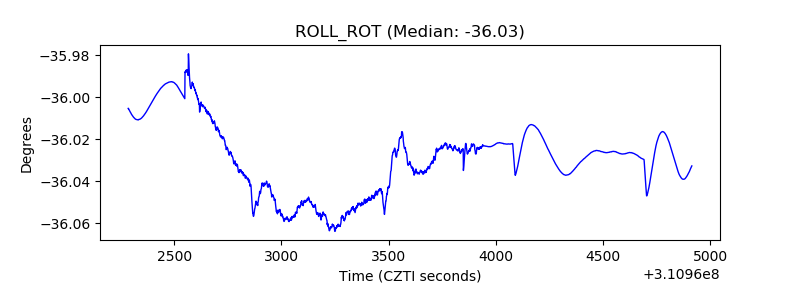 |
| _Roll_DEC | 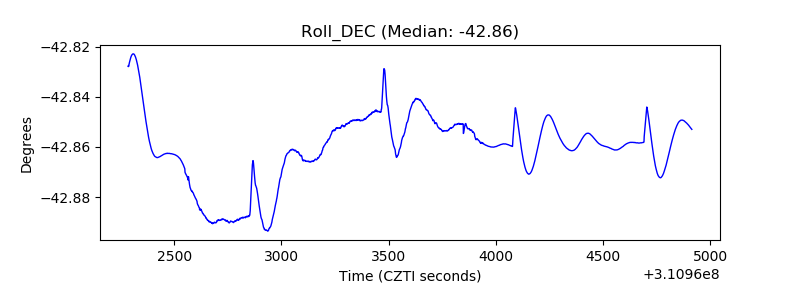 |
| _Roll_RA |  |
| Veto Counter | 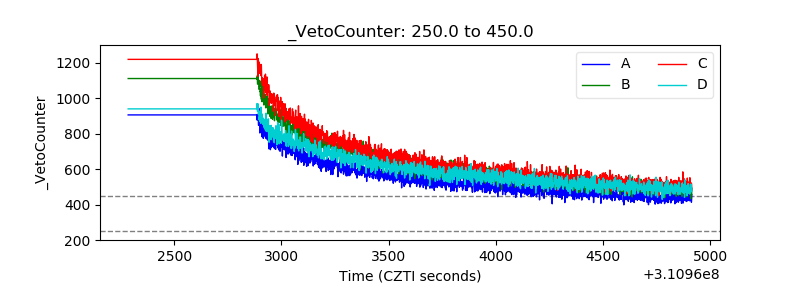 |