| Param | Original file | Final file |
|---|---|---|
| Filename | modeM0/AS1A07_018T02_9000003292cztM0_level2.fits | modeM0/AS1A07_018T02_9000003292cztM0_level2_quad_clean.evt |
| Size (bytes) | 264,591,360 | 241,522,560 |
| Size | 252.3 MB | 230.3 MB |
| Events in quadrant A | 1,671,132 | 1,476,367 |
| Events in quadrant B | 1,596,826 | 1,480,330 |
| Events in quadrant C | 1,602,440 | 1,390,806 |
| Events in quadrant D | 1,374,960 | 1,198,253 |
| Mode M0 | |||
|---|---|---|---|
| Quadrant | BADHDUFLAG | Total packets | Discarded packets |
| A | 0 | 53912 | 0 |
| B | 0 | 54842 | 0 |
| C | 0 | 55207 | 0 |
| D | 0 | 69706 | 0 |
| Mode M9 | |||
|---|---|---|---|
| Quadrant | BADHDUFLAG | Total packets | Discarded packets |
| A | 0 | 51 | 0 |
| B | 0 | 51 | 0 |
| C | 0 | 51 | 0 |
| D | 0 | 51 | 0 |
| Mode SS | |||
|---|---|---|---|
| Quadrant | BADHDUFLAG | Total packets | Discarded packets |
| A | 0 | 524 | 0 |
| B | 0 | 524 | 0 |
| C | 0 | 524 | 0 |
| D | 0 | 524 | 0 |
| Quadrant | Total seconds | Saturated seconds | Saturation percentage |
|---|---|---|---|
| A | 25705 | 447 | 1.738961% |
| B | 25705 | 582 | 2.264151% |
| C | 25705 | 589 | 2.291383% |
| D | 25705 | 1499 | 5.831550% |
Noise dominated data is calculated using 1-second bins in cleaned event files. If a bin has >2000 counts, and if more than 50% of those come from <1% of pixels, then it is considered to be noise-dominated and hence unusable.
| Quadrant | # 1 sec bins | Bins with >0 counts | Bins with >2000 counts | High rate bins dominated by noise | Noise dominated (total time) | Noise dominated (detector-on time) | Marked lightcurve |
|---|---|---|---|---|---|---|---|
| A | 30676 | 25705 | 0 | 0 | 0.00% | 0.00% |  |
| B | 30676 | 25705 | 0 | 0 | 0.00% | 0.00% |  |
| C | 30676 | 25705 | 0 | 0 | 0.00% | 0.00% |  |
| D | 30676 | 25689 | 0 | 0 | 0.00% | 0.00% | 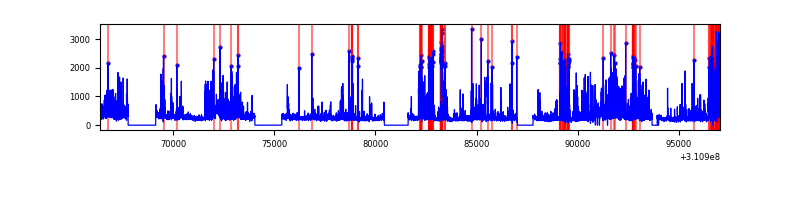 |
Top three noisy pixels from each quadrant. If the there are fewer than three noisy pixels in the level2.evt file, extra rows are filled as -1
| Pixel properties | Quadrant properties | ||||||
|---|---|---|---|---|---|---|---|
| Quadrant | DetID | PixID | Counts | Sigma | Mean | Median | Sigma |
| A | 0 | 29 | 1535 | 10.41 | 434 | 408 | 108.2 |
| A | 7 | 110 | 1299 | 8.23 | 434 | 408 | 108.2 |
| A | 9 | 19 | 1207 | 7.38 | 434 | 408 | 108.2 |
| B | 2 | 9 | 1271 | 10.14 | 422 | 403 | 85.6 |
| B | 5 | 128 | 1073 | 7.83 | 422 | 403 | 85.6 |
| B | 5 | 255 | 1052 | 7.58 | 422 | 403 | 85.6 |
| C | 12 | 241 | 1164 | 7.07 | 422 | 396 | 108.7 |
| C | 9 | 233 | 1088 | 6.37 | 422 | 396 | 108.7 |
| C | 9 | 242 | 1063 | 6.14 | 422 | 396 | 108.7 |
| D | 7 | 3 | 994 | 6.01 | 392 | 359 | 105.7 |
| D | 10 | 189 | 989 | 5.96 | 392 | 359 | 105.7 |
| D | 3 | 14 | 986 | 5.93 | 392 | 359 | 105.7 |
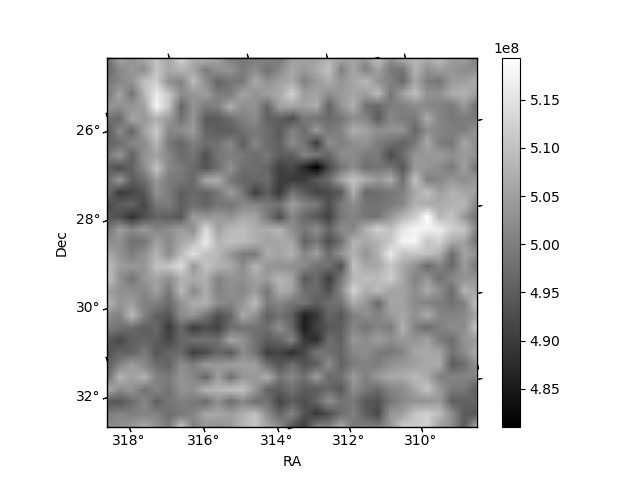
Histogram calculated using DETX and DETY for each event in the final _common_clean file
| Quadrant A |  |
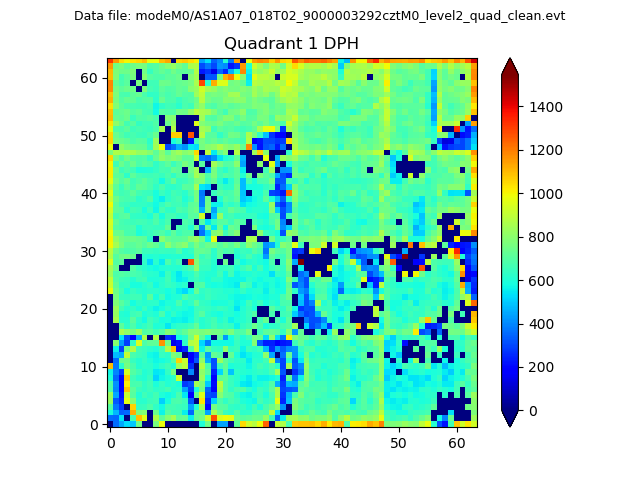 |
Quadrant B |
|---|---|---|---|
| Quadrant D |  |
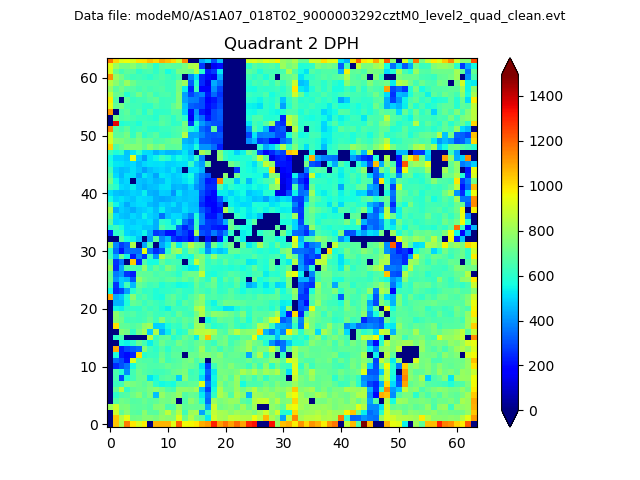 |
Quadrant C |
| Plot type | Count rate plots | Images |
|---|---|---|
| Comparison with Poisson distribution Blue bars denote a histogram of data divided into 1 sec bins. Red curve is a Poisson curve with rate = median count rate of data. |
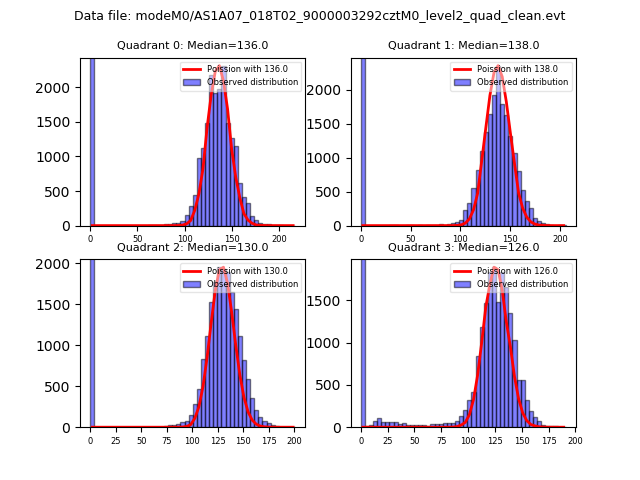 |
 |
| Quadrant-wise count rates Data is divided into 100 sec bins |
 |
|
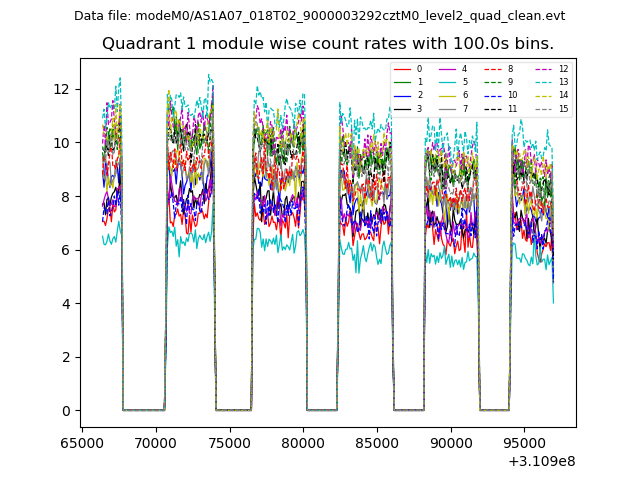
| Module-wise count rates for Quadrant A Data is divided into 100 sec bins |
 |
 |
| Module-wise count rates for Quadrant B Data is divided into 100 sec bins |
 |
 |
| Module-wise count rates for Quadrant C Data is divided into 100 sec bins |
 |
 |
| Module-wise count rates for Quadrant D Data is divided into 100 sec bins |
 |
 |
| Parameter | Plot |
|---|---|
| CZT HV Monitor |  |
| D_VDD | 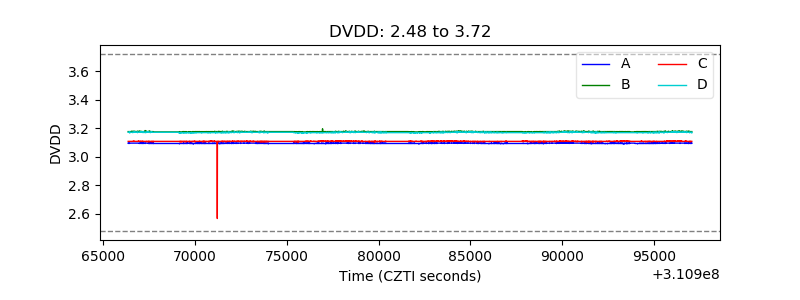 |
| Temperature 1 |  |
| Veto HV Monitor |  |
| Veto LLD |  |
| Alpha Counter |  |
| _CPM_Rate | 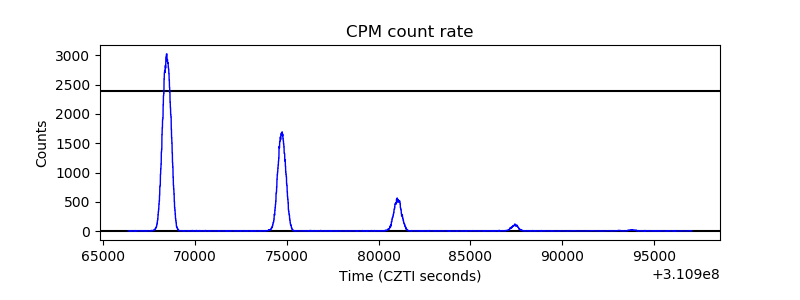 |
| CZT Counter |  |
| +2.5 Volts monitor |  |
| +5 Volts monitor |  |
| _ROLL_ROT |  |
| _Roll_DEC |  |
| _Roll_RA |  |
| Veto Counter |  |