| Param | Original file | Final file |
|---|---|---|
| Filename | modeM0/AS1A07_018T02_9000003292_22247cztM0_level2.evt | modeM0/AS1A07_018T02_9000003292_22247cztM0_level2_quad_clean.evt |
| Size (bytes) | 226,393,920 | 32,512,320 |
| Size | 215.9 MB | 31.0 MB |
| Events in quadrant A | 1,504,957 | 200,192 |
| Events in quadrant B | 1,527,086 | 205,351 |
| Events in quadrant C | 1,649,862 | 195,740 |
| Events in quadrant D | 1,989,169 | 189,303 |
| Mode M0 | |||
|---|---|---|---|
| Quadrant | BADHDUFLAG | Total packets | Discarded packets |
| A | 0 | 6098 | 1 |
| B | 0 | 6227 | 1 |
| C | 0 | 6605 | 1 |
| D | 0 | 7787 | 1 |
| Mode M9 | |||
|---|---|---|---|
| Quadrant | BADHDUFLAG | Total packets | Discarded packets |
| A | 0 | 14 | 0 |
| B | 0 | 14 | 0 |
| C | 0 | 14 | 0 |
| D | 0 | 14 | 0 |
| Mode SS | |||
|---|---|---|---|
| Quadrant | BADHDUFLAG | Total packets | Discarded packets |
| A | 0 | 56 | 0 |
| B | 0 | 56 | 0 |
| C | 0 | 56 | 0 |
| D | 0 | 56 | 0 |
| Quadrant | Total seconds | Saturated seconds | Saturation percentage |
|---|---|---|---|
| A | 2703 | 40 | 1.479837% |
| B | 2703 | 55 | 2.034776% |
| C | 2703 | 102 | 3.773585% |
| D | 2703 | 81 | 2.996670% |
Noise dominated data is calculated using 1-second bins in cleaned event files. If a bin has >2000 counts, and if more than 50% of those come from <1% of pixels, then it is considered to be noise-dominated and hence unusable.
| Quadrant | # 1 sec bins | Bins with >0 counts | Bins with >2000 counts | High rate bins dominated by noise | Noise dominated (total time) | Noise dominated (detector-on time) | Marked lightcurve |
|---|---|---|---|---|---|---|---|
| A | 4068 | 2704 | 0 | 0 | 0.00% | 0.00% | 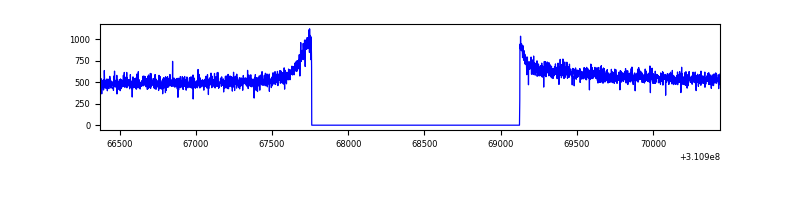 |
| B | 4068 | 2704 | 0 | 0 | 0.00% | 0.00% | 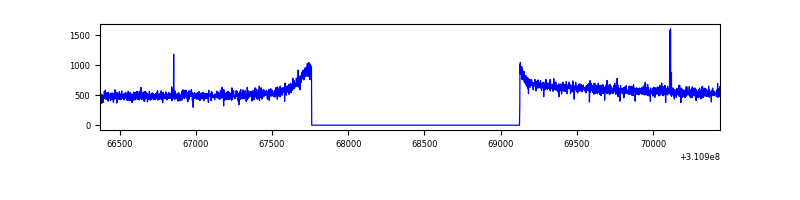 |
| C | 4068 | 2704 | 14 | 14 | 0.34% | 0.52% | 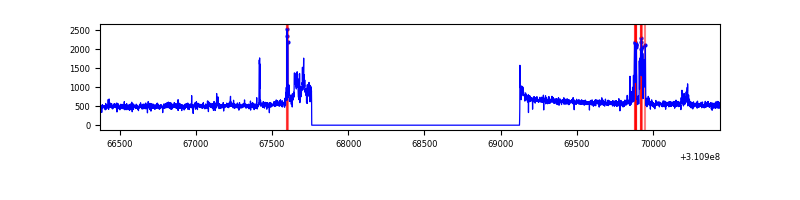 |
| D | 4068 | 2704 | 30 | 30 | 0.74% | 1.11% | 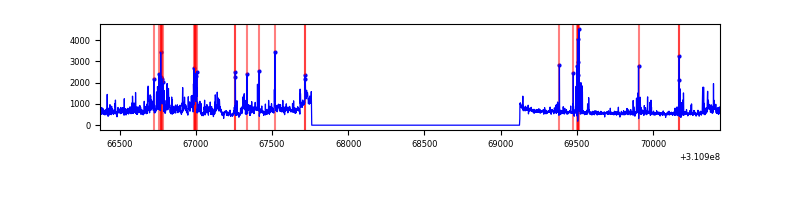 |
Top three noisy pixels from each quadrant. If the there are fewer than three noisy pixels in the level2.evt file, extra rows are filled as -1
| Pixel properties | Quadrant properties | ||||||
|---|---|---|---|---|---|---|---|
| Quadrant | DetID | PixID | Counts | Sigma | Mean | Median | Sigma |
| A | 13 | 254 | 3812 | 43.37 | 390 | 383 | 79.1 |
| A | 0 | 226 | 3350 | 37.53 | 390 | 383 | 79.1 |
| A | 3 | 137 | 3119 | 34.6 | 390 | 383 | 79.1 |
| B | 12 | 111 | 8651 | 111.48 | 389 | 380 | 74.2 |
| B | 4 | 216 | 7611 | 97.46 | 389 | 380 | 74.2 |
| B | 11 | 111 | 7549 | 96.62 | 389 | 380 | 74.2 |
| C | 10 | 22 | 137461 | 1560.39 | 372 | 376 | 87.9 |
| C | 14 | 238 | 60415 | 683.4 | 372 | 376 | 87.9 |
| C | 0 | 10 | 3362 | 33.99 | 372 | 376 | 87.9 |
| D | 1 | 52 | 514475 | 5585.87 | 375 | 365 | 92.0 |
| D | 13 | 104 | 28858 | 309.58 | 375 | 365 | 92.0 |
| D | 13 | 172 | 24750 | 264.95 | 375 | 365 | 92.0 |
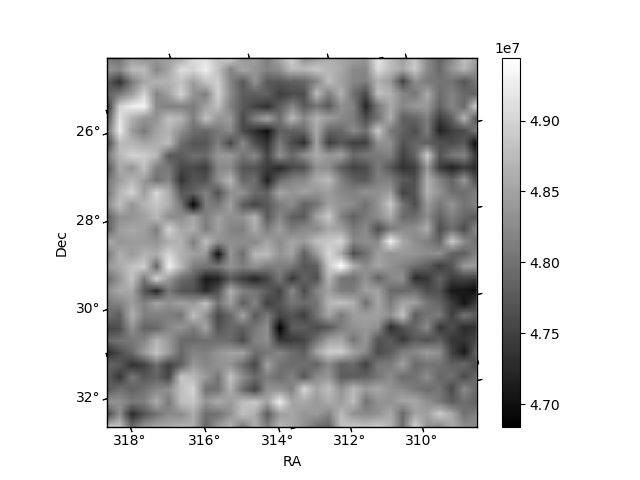
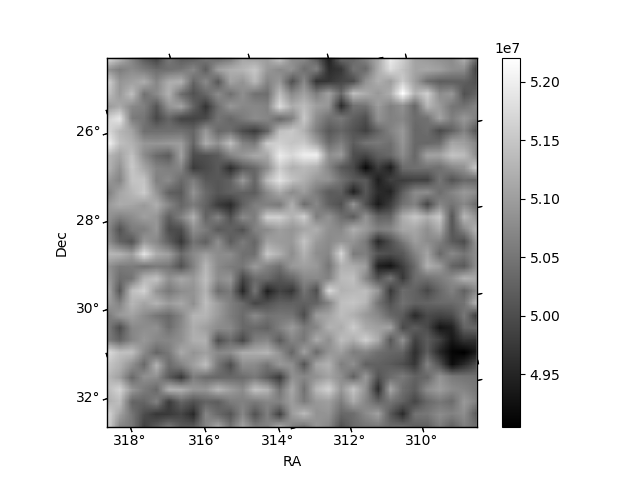
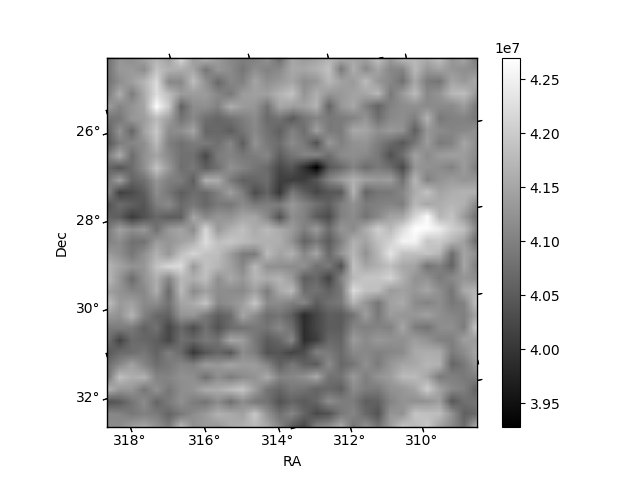
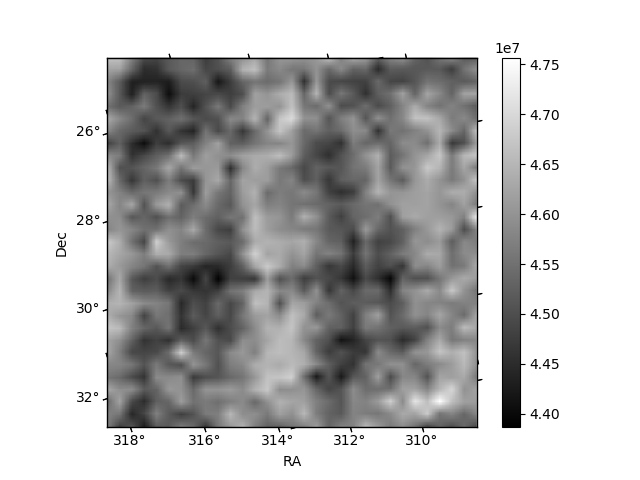
Histogram calculated using DETX and DETY for each event in the final _common_clean file
| Quadrant A | 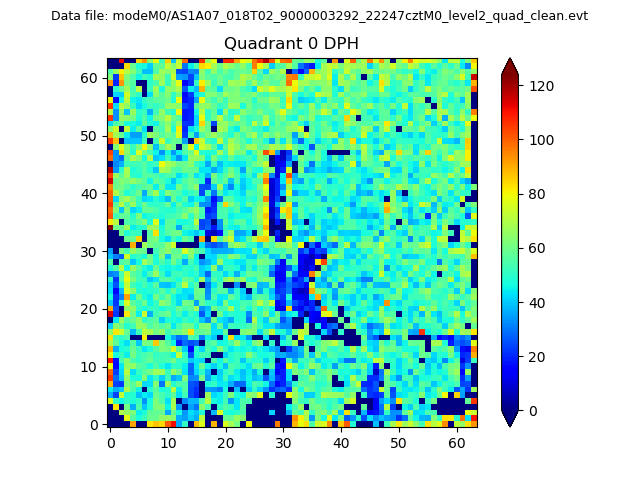 |
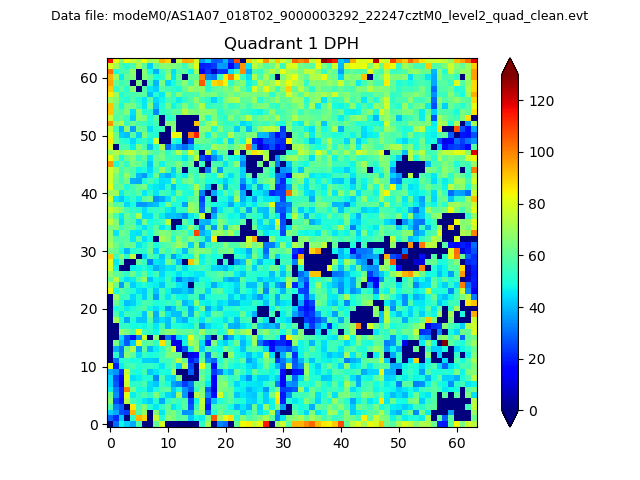 |
Quadrant B |
|---|---|---|---|
| Quadrant D | 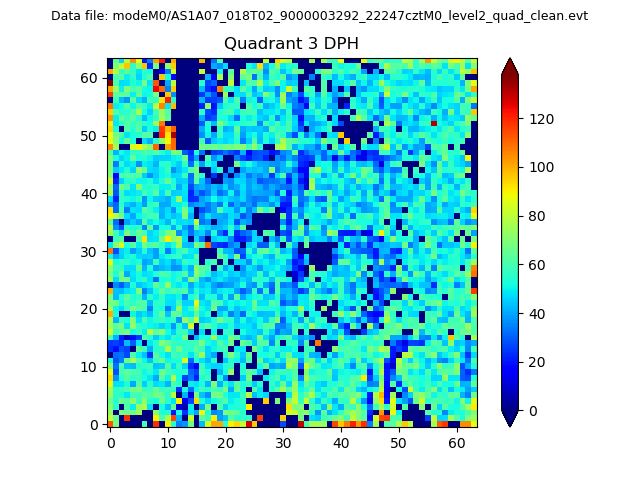 |
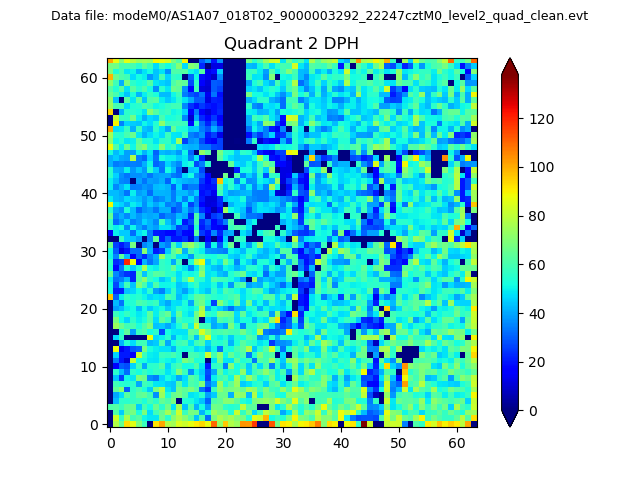 |
Quadrant C |
| Plot type | Count rate plots | Images |
|---|---|---|
| Comparison with Poisson distribution Blue bars denote a histogram of data divided into 1 sec bins. Red curve is a Poisson curve with rate = median count rate of data. |
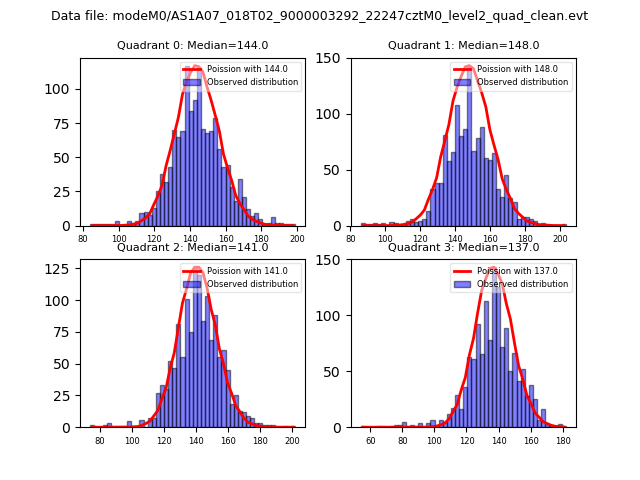 |
 |
| Quadrant-wise count rates Data is divided into 100 sec bins |
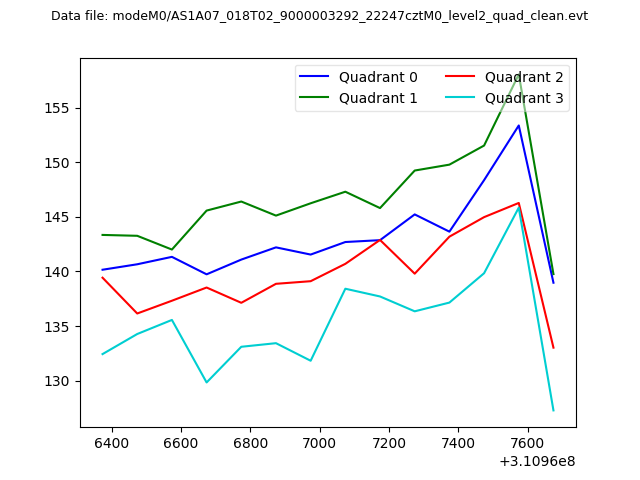 |
|
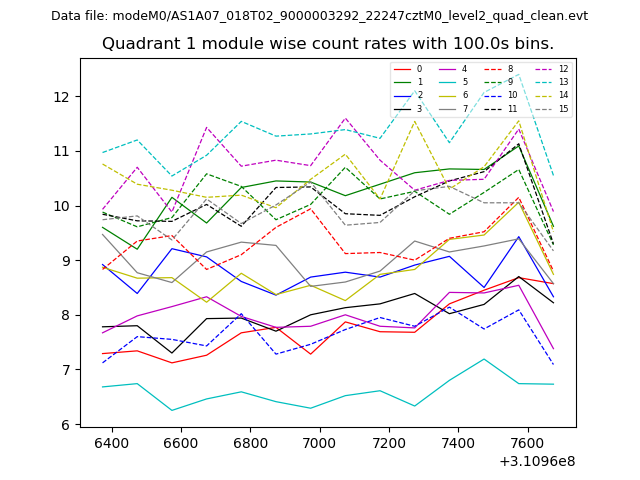
| Module-wise count rates for Quadrant A Data is divided into 100 sec bins |
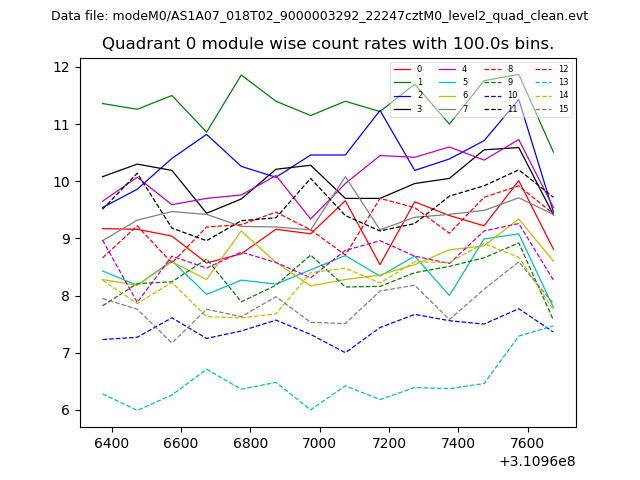 |
 |
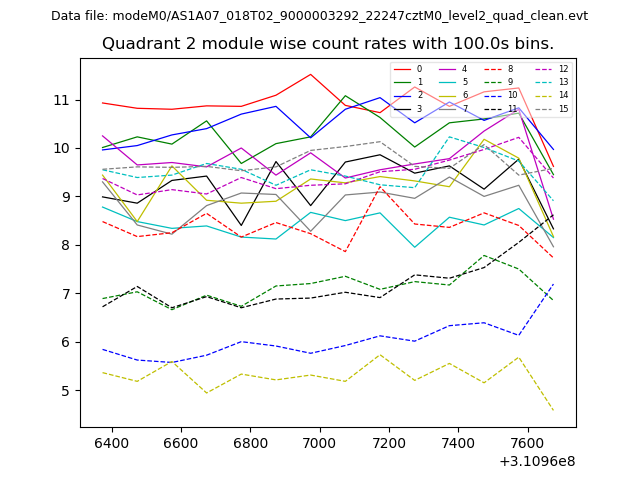
| Module-wise count rates for Quadrant B Data is divided into 100 sec bins |
 |
 |
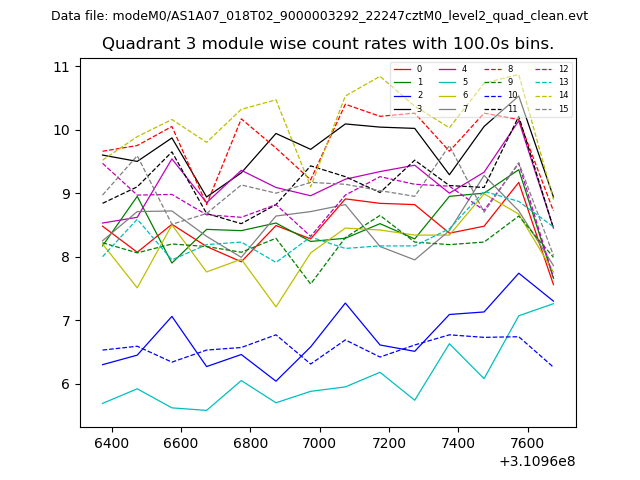
| Module-wise count rates for Quadrant C Data is divided into 100 sec bins |
 |
 |
| Module-wise count rates for Quadrant D Data is divided into 100 sec bins |
 |
 |
| Parameter | Plot |
|---|---|
| CZT HV Monitor | 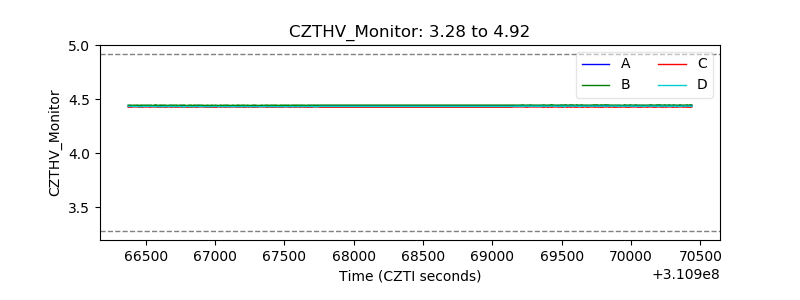 |
| D_VDD | 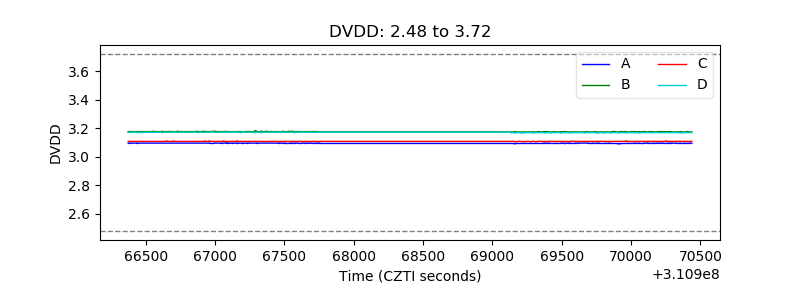 |
| Temperature 1 | 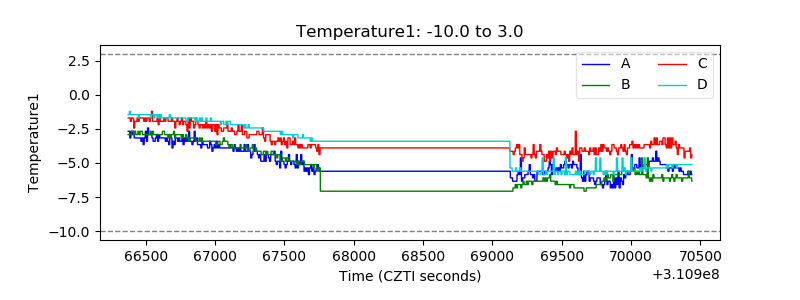 |
| Veto HV Monitor | 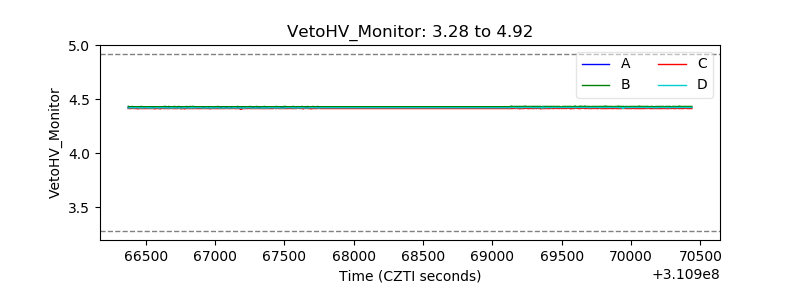 |
| Veto LLD | 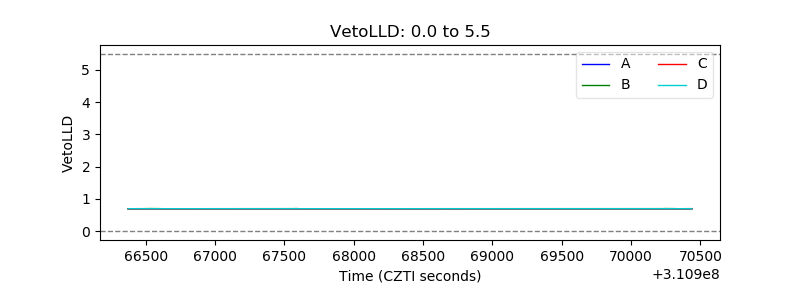 |
| Alpha Counter | 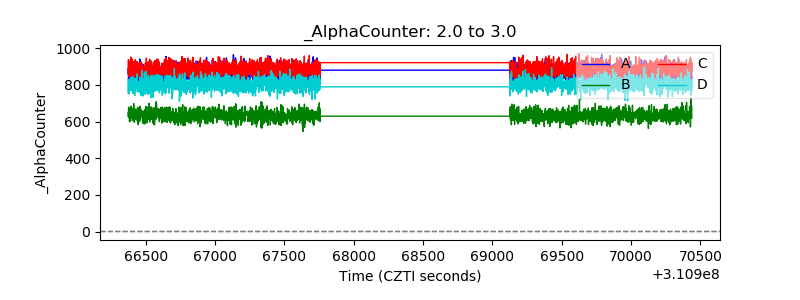 |
| _CPM_Rate | 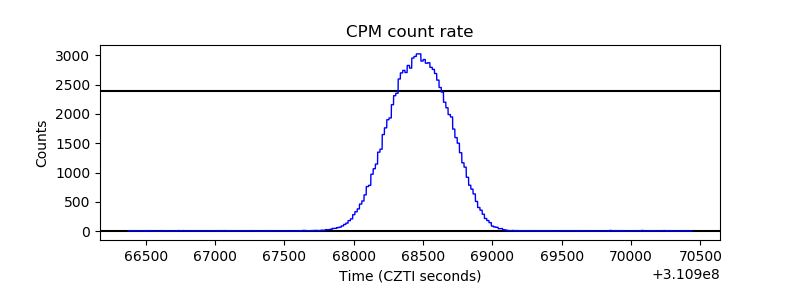 |
| CZT Counter | 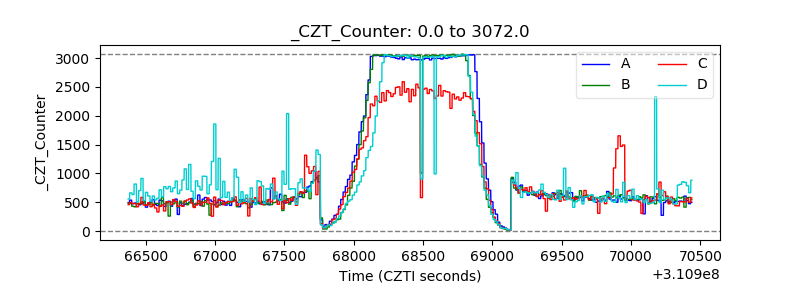 |
| +2.5 Volts monitor | 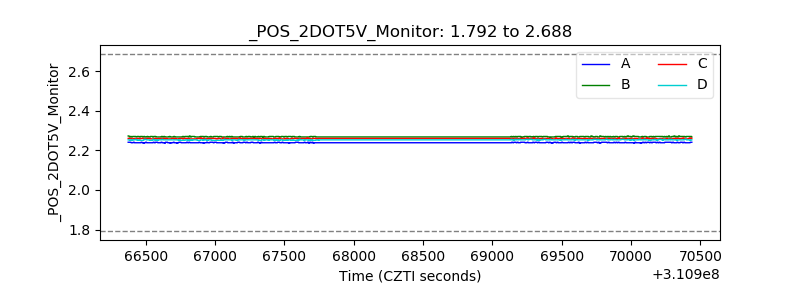 |
| +5 Volts monitor |  |
| _ROLL_ROT | 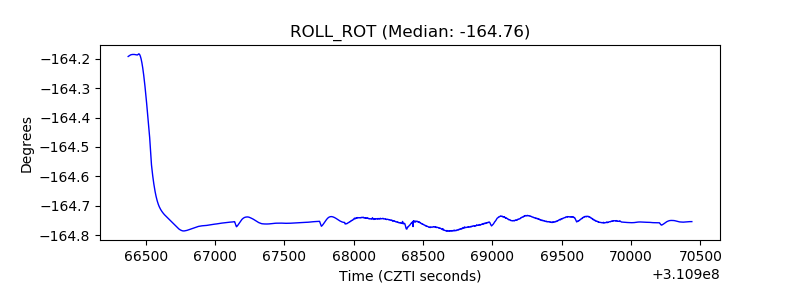 |
| _Roll_DEC | 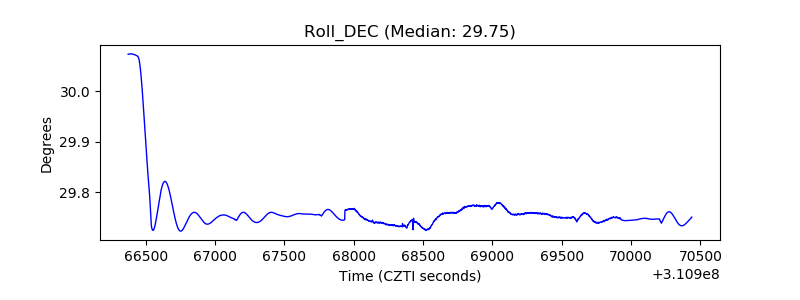 |
| _Roll_RA |  |
| Veto Counter | 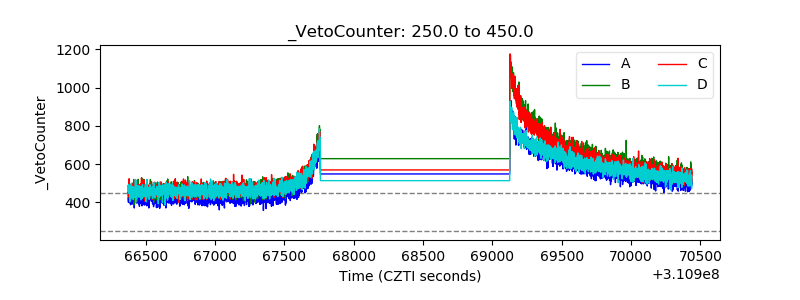 |