| Param | Original file | Final file |
|---|---|---|
| Filename | modeM0/AS1A07_018T02_9000003292_22248cztM0_level2.evt | modeM0/AS1A07_018T02_9000003292_22248cztM0_level2_quad_clean.evt |
| Size (bytes) | 485,009,280 | 78,480,000 |
| Size | 462.5 MB | 74.8 MB |
| Events in quadrant A | 3,350,954 | 496,044 |
| Events in quadrant B | 3,423,290 | 505,021 |
| Events in quadrant C | 3,534,235 | 478,105 |
| Events in quadrant D | 3,956,614 | 461,771 |
| Mode M0 | |||
|---|---|---|---|
| Quadrant | BADHDUFLAG | Total packets | Discarded packets |
| A | 0 | 13573 | 2 |
| B | 0 | 13902 | 2 |
| C | 0 | 14268 | 2 |
| D | 0 | 15612 | 2 |
| Mode M9 | |||
|---|---|---|---|
| Quadrant | BADHDUFLAG | Total packets | Discarded packets |
| A | 0 | 16 | 0 |
| B | 0 | 17 | 0 |
| C | 0 | 17 | 0 |
| D | 0 | 17 | 0 |
| Mode SS | |||
|---|---|---|---|
| Quadrant | BADHDUFLAG | Total packets | Discarded packets |
| A | 0 | 128 | 0 |
| B | 0 | 128 | 0 |
| C | 0 | 128 | 0 |
| D | 0 | 128 | 0 |
| Quadrant | Total seconds | Saturated seconds | Saturation percentage |
|---|---|---|---|
| A | 6234 | 73 | 1.170998% |
| B | 6234 | 118 | 1.892846% |
| C | 6234 | 136 | 2.181585% |
| D | 6234 | 84 | 1.347449% |
Noise dominated data is calculated using 1-second bins in cleaned event files. If a bin has >2000 counts, and if more than 50% of those come from <1% of pixels, then it is considered to be noise-dominated and hence unusable.
| Quadrant | # 1 sec bins | Bins with >0 counts | Bins with >2000 counts | High rate bins dominated by noise | Noise dominated (total time) | Noise dominated (detector-on time) | Marked lightcurve |
|---|---|---|---|---|---|---|---|
| A | 7569 | 6235 | 0 | 0 | 0.00% | 0.00% | 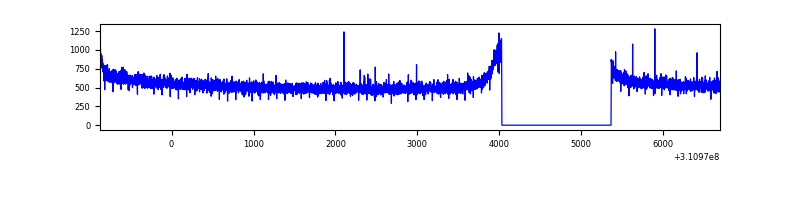 |
| B | 7569 | 6235 | 5 | 5 | 0.07% | 0.08% | 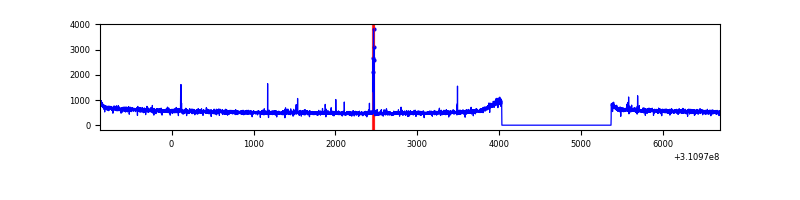 |
| C | 7569 | 6235 | 22 | 22 | 0.29% | 0.35% | 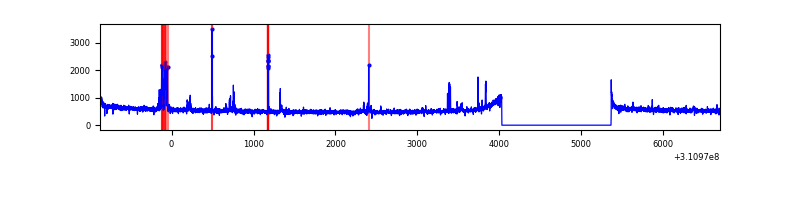 |
| D | 7569 | 6235 | 41 | 41 | 0.54% | 0.66% | 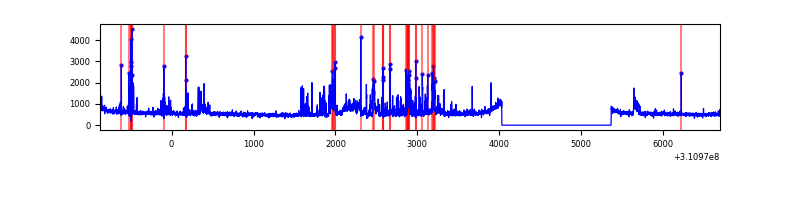 |
Top three noisy pixels from each quadrant. If the there are fewer than three noisy pixels in the level2.evt file, extra rows are filled as -1
| Pixel properties | Quadrant properties | ||||||
|---|---|---|---|---|---|---|---|
| Quadrant | DetID | PixID | Counts | Sigma | Mean | Median | Sigma |
| A | 13 | 254 | 8917 | 46.75 | 870 | 855 | 172.4 |
| A | 0 | 226 | 7555 | 38.86 | 870 | 855 | 172.4 |
| A | 3 | 137 | 7014 | 35.72 | 870 | 855 | 172.4 |
| B | 3 | 64 | 34367 | 207.29 | 865 | 846 | 161.7 |
| B | 12 | 111 | 18855 | 111.37 | 865 | 846 | 161.7 |
| B | 11 | 111 | 17205 | 101.16 | 865 | 846 | 161.7 |
| C | 10 | 22 | 193827 | 1020.81 | 820 | 829 | 189.1 |
| C | 14 | 238 | 133282 | 700.57 | 820 | 829 | 189.1 |
| C | 0 | 10 | 9703 | 46.94 | 820 | 829 | 189.1 |
| D | 1 | 52 | 744885 | 3736.36 | 830 | 808 | 199.1 |
| D | 13 | 172 | 38589 | 189.72 | 830 | 808 | 199.1 |
| D | 13 | 104 | 31972 | 156.49 | 830 | 808 | 199.1 |
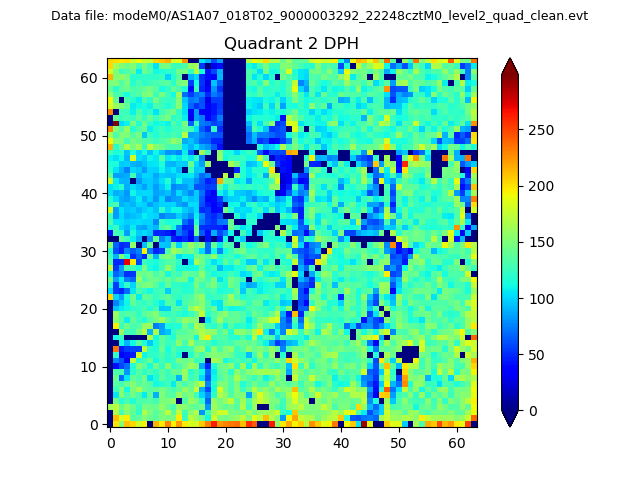
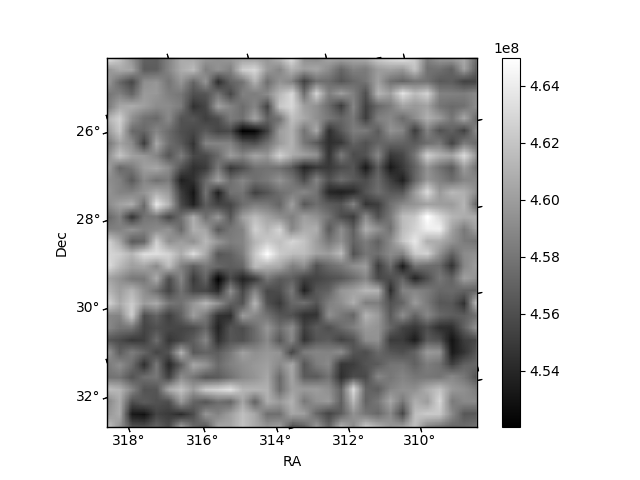
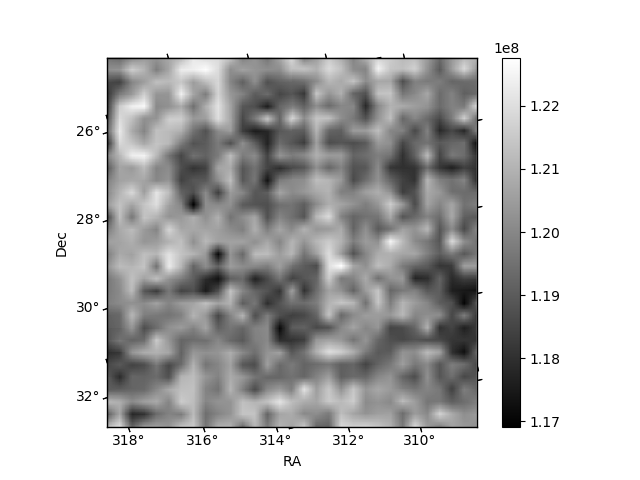
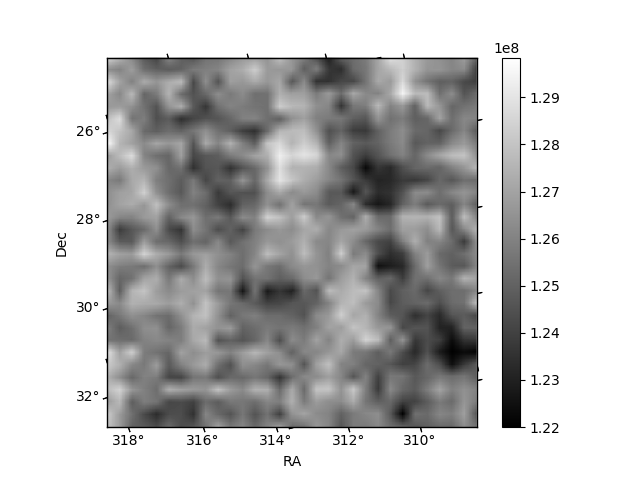
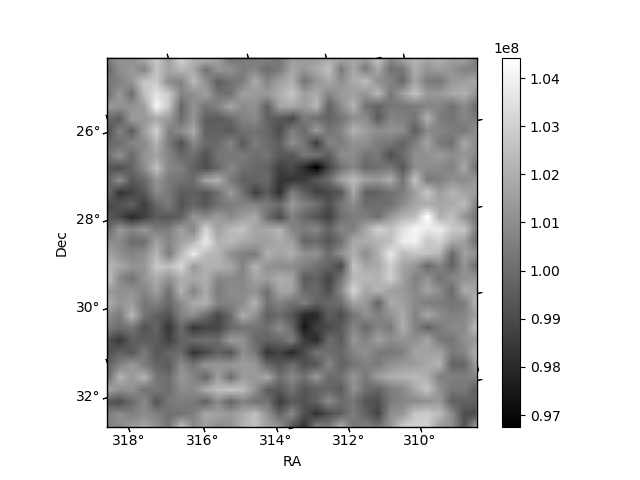
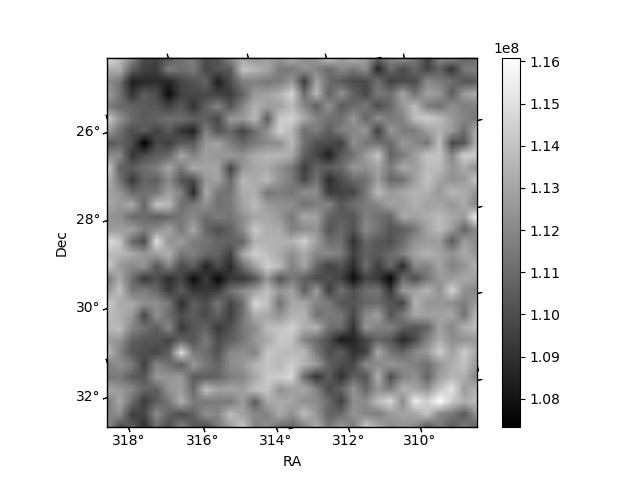
Histogram calculated using DETX and DETY for each event in the final _common_clean file
| Quadrant A | 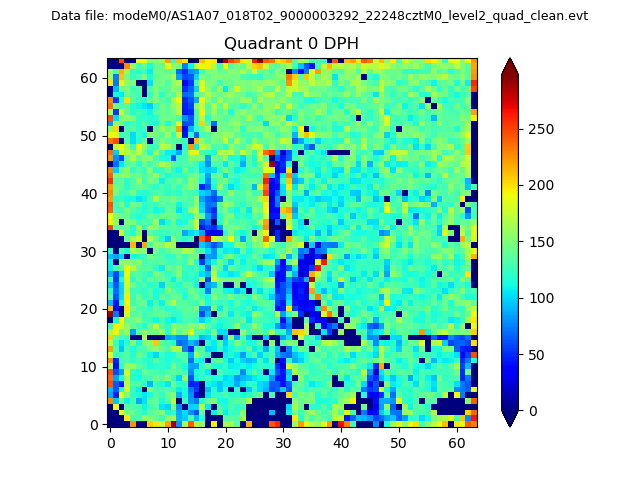 |
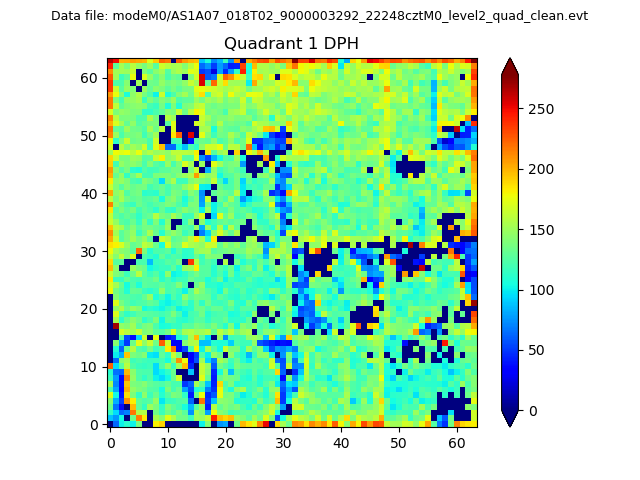 |
Quadrant B |
|---|---|---|---|
| Quadrant D | 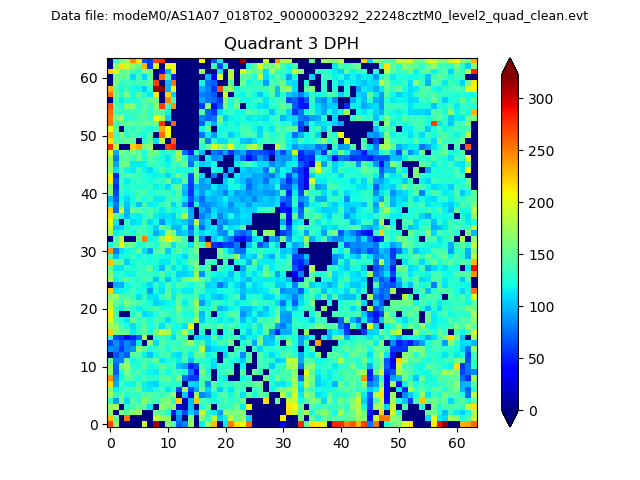 |
 |
Quadrant C |
| Plot type | Count rate plots | Images |
|---|---|---|
| Comparison with Poisson distribution Blue bars denote a histogram of data divided into 1 sec bins. Red curve is a Poisson curve with rate = median count rate of data. |
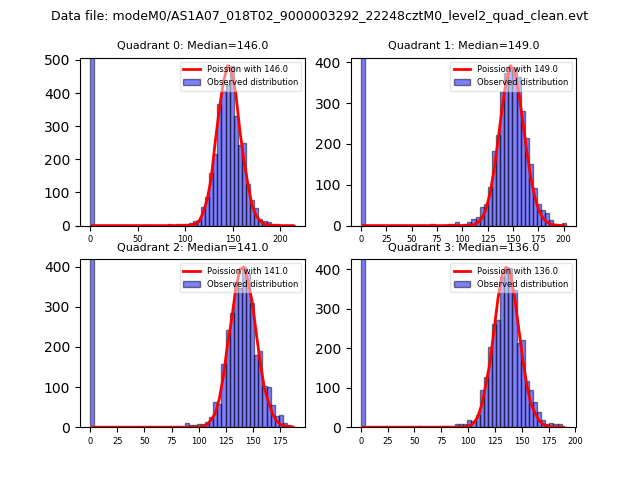 |
 |
| Quadrant-wise count rates Data is divided into 100 sec bins |
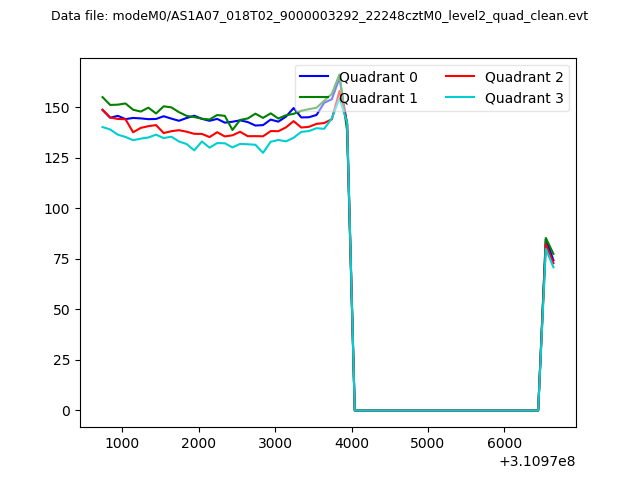 |
|
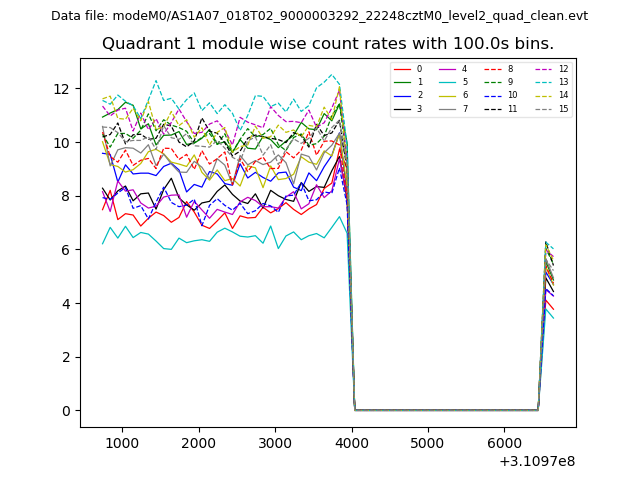
| Module-wise count rates for Quadrant A Data is divided into 100 sec bins |
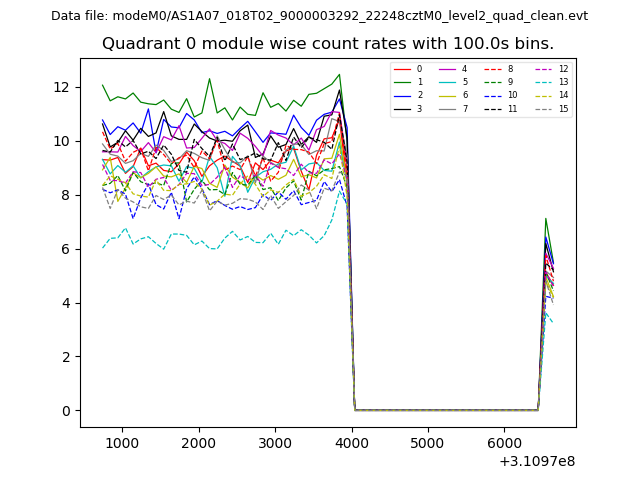 |
 |
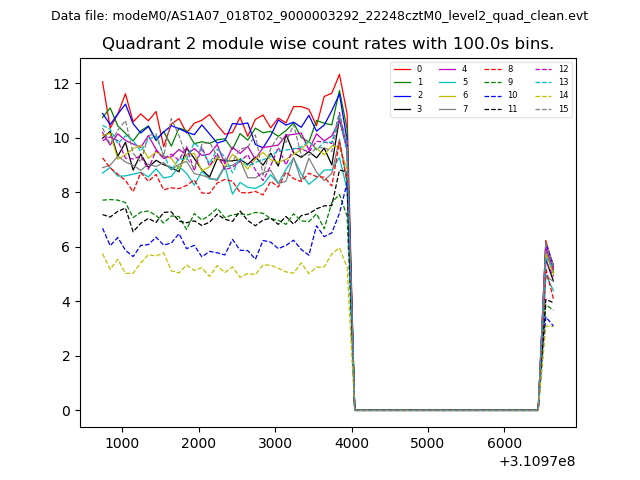
| Module-wise count rates for Quadrant B Data is divided into 100 sec bins |
 |
 |
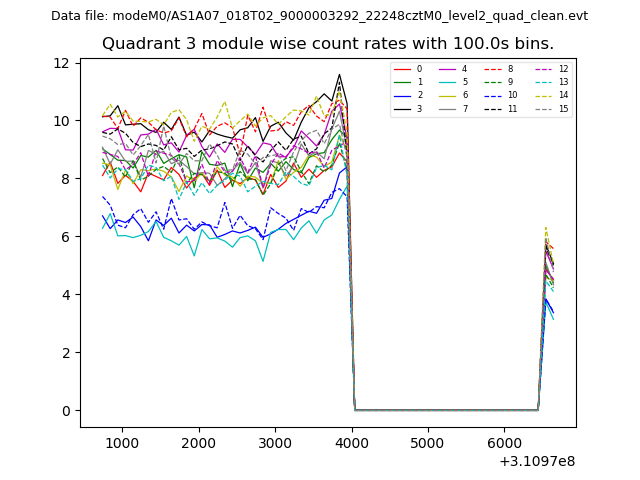
| Module-wise count rates for Quadrant C Data is divided into 100 sec bins |
 |
 |
| Module-wise count rates for Quadrant D Data is divided into 100 sec bins |
 |
 |
| Parameter | Plot |
|---|---|
| CZT HV Monitor | 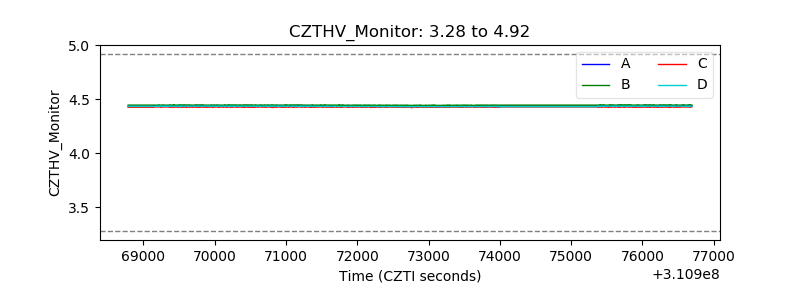 |
| D_VDD | 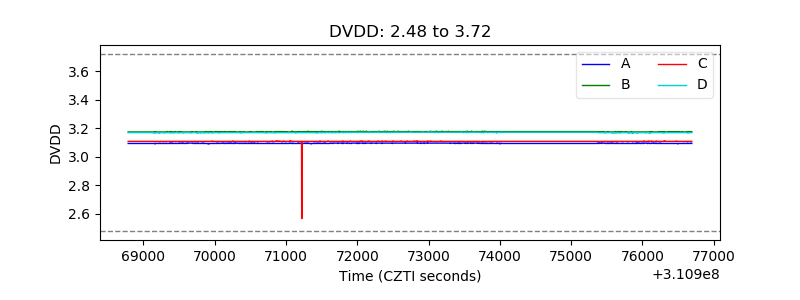 |
| Temperature 1 | 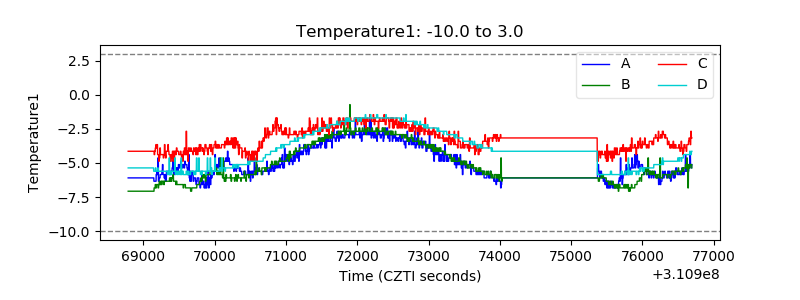 |
| Veto HV Monitor | 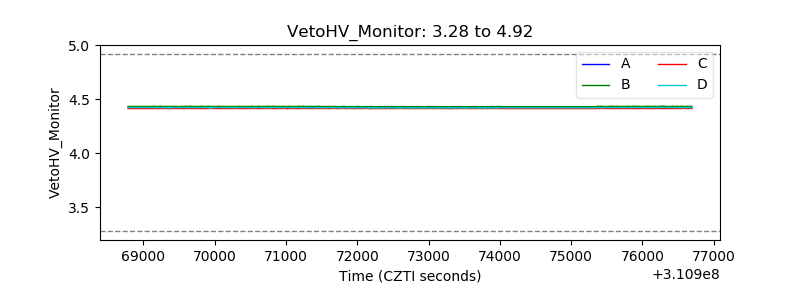 |
| Veto LLD | 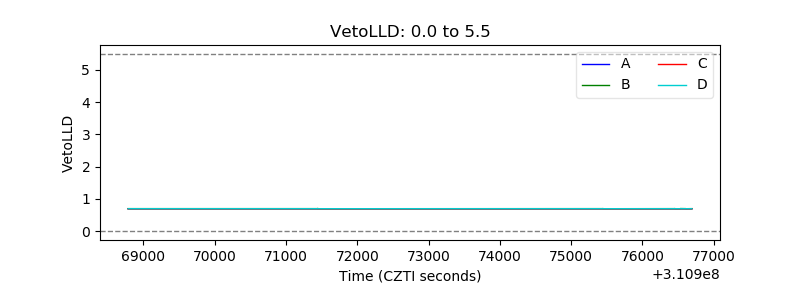 |
| Alpha Counter | 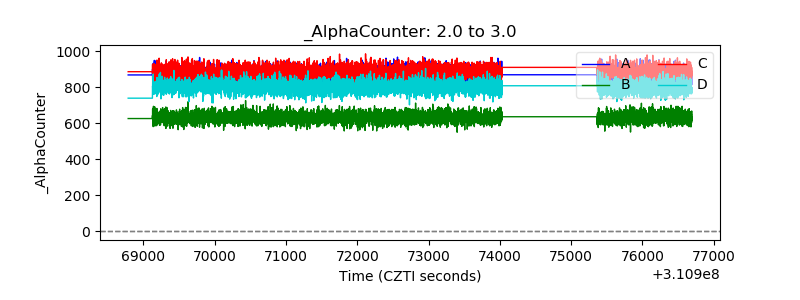 |
| _CPM_Rate | 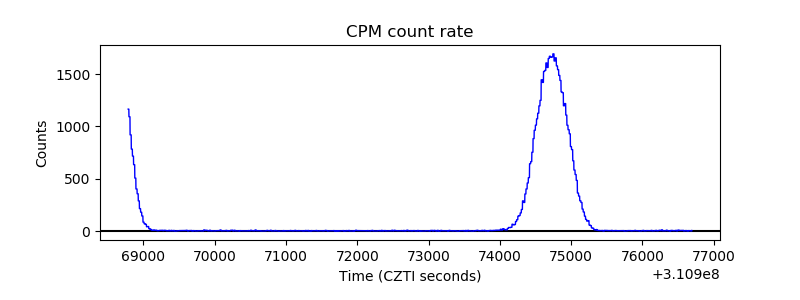 |
| CZT Counter |  |
| +2.5 Volts monitor |  |
| +5 Volts monitor | 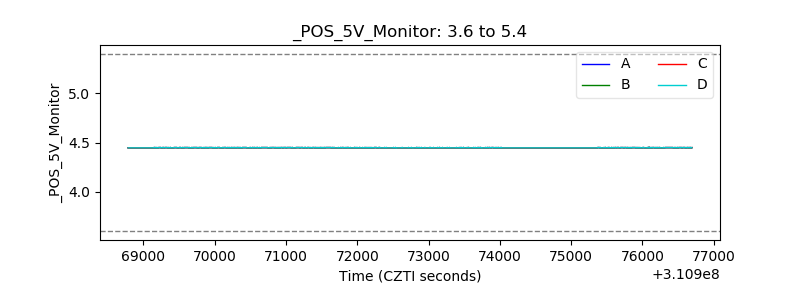 |
| _ROLL_ROT | 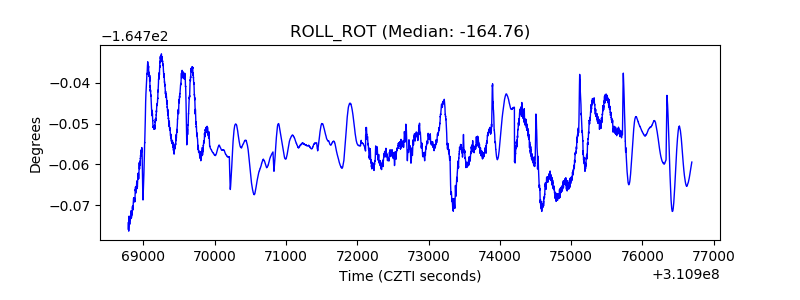 |
| _Roll_DEC | 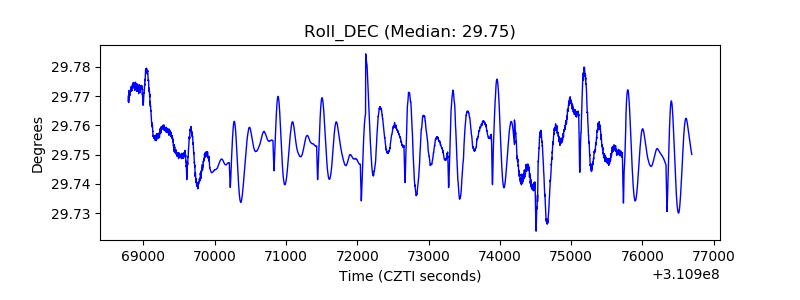 |
| _Roll_RA | 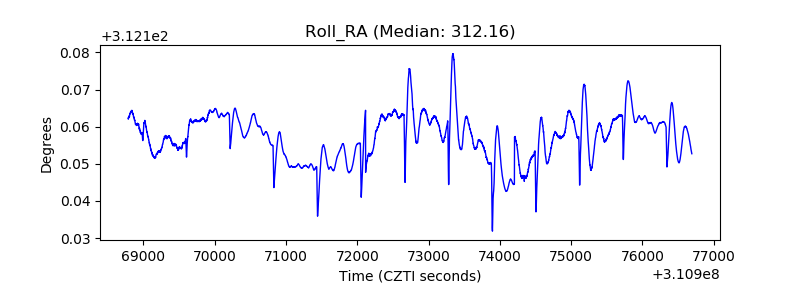 |
| Veto Counter | 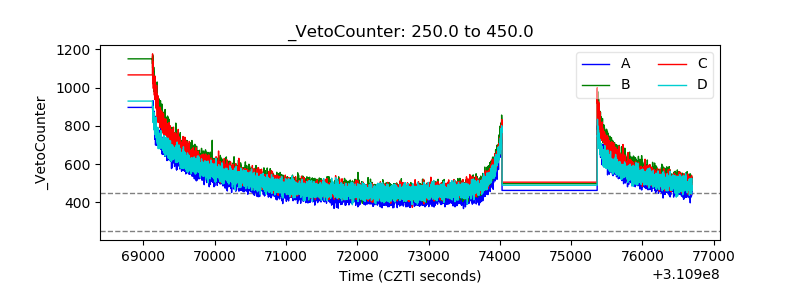 |