| Param | Original file | Final file |
|---|---|---|
| Filename | modeM0/AS1A07_018T02_9000003292_22249cztM0_level2.evt | modeM0/AS1A07_018T02_9000003292_22249cztM0_level2_quad_clean.evt |
| Size (bytes) | 479,479,680 | 92,482,560 |
| Size | 457.3 MB | 88.2 MB |
| Events in quadrant A | 3,334,486 | 600,152 |
| Events in quadrant B | 3,406,207 | 613,536 |
| Events in quadrant C | 3,367,980 | 577,309 |
| Events in quadrant D | 3,973,289 | 558,888 |
| Mode M0 | |||
|---|---|---|---|
| Quadrant | BADHDUFLAG | Total packets | Discarded packets |
| A | 0 | 13663 | 2 |
| B | 0 | 13920 | 2 |
| C | 0 | 13817 | 2 |
| D | 0 | 15779 | 2 |
| Mode M9 | |||
|---|---|---|---|
| Quadrant | BADHDUFLAG | Total packets | Discarded packets |
| A | 0 | 19 | 0 |
| B | 0 | 20 | 0 |
| C | 0 | 20 | 0 |
| D | 0 | 20 | 0 |
| Mode SS | |||
|---|---|---|---|
| Quadrant | BADHDUFLAG | Total packets | Discarded packets |
| A | 0 | 132 | 0 |
| B | 0 | 132 | 0 |
| C | 0 | 132 | 0 |
| D | 0 | 132 | 0 |
| Quadrant | Total seconds | Saturated seconds | Saturation percentage |
|---|---|---|---|
| A | 6462 | 83 | 1.284432% |
| B | 6462 | 120 | 1.857010% |
| C | 6462 | 124 | 1.918911% |
| D | 6462 | 179 | 2.770040% |
Noise dominated data is calculated using 1-second bins in cleaned event files. If a bin has >2000 counts, and if more than 50% of those come from <1% of pixels, then it is considered to be noise-dominated and hence unusable.
| Quadrant | # 1 sec bins | Bins with >0 counts | Bins with >2000 counts | High rate bins dominated by noise | Noise dominated (total time) | Noise dominated (detector-on time) | Marked lightcurve |
|---|---|---|---|---|---|---|---|
| A | 7643 | 6463 | 0 | 0 | 0.00% | 0.00% | 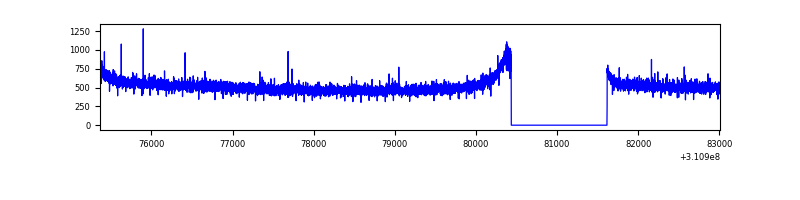 |
| B | 7643 | 6463 | 2 | 2 | 0.03% | 0.03% | 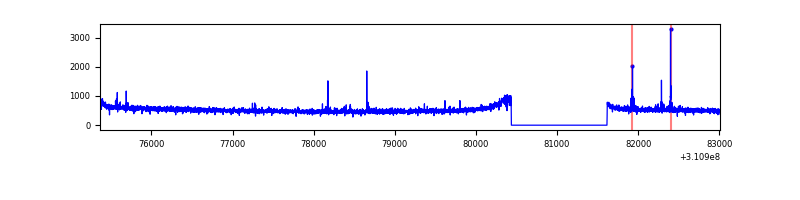 |
| C | 7643 | 6463 | 4 | 4 | 0.05% | 0.06% | 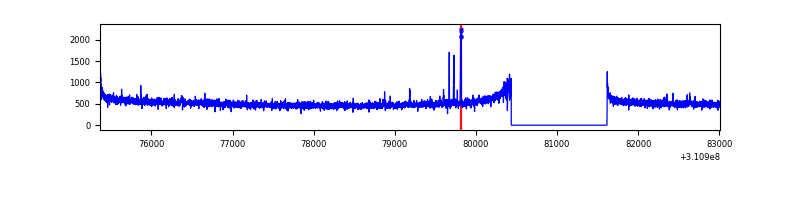 |
| D | 7643 | 6463 | 131 | 131 | 1.71% | 2.03% | 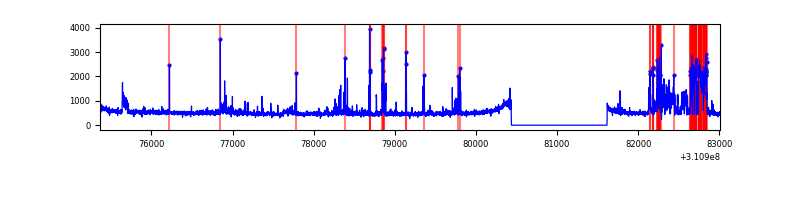 |
Top three noisy pixels from each quadrant. If the there are fewer than three noisy pixels in the level2.evt file, extra rows are filled as -1
| Pixel properties | Quadrant properties | ||||||
|---|---|---|---|---|---|---|---|
| Quadrant | DetID | PixID | Counts | Sigma | Mean | Median | Sigma |
| A | 13 | 254 | 9630 | 50.98 | 865 | 850 | 172.2 |
| A | 0 | 226 | 7505 | 38.64 | 865 | 850 | 172.2 |
| A | 3 | 137 | 7300 | 37.45 | 865 | 850 | 172.2 |
| B | 4 | 173 | 21833 | 129.02 | 860 | 842 | 162.7 |
| B | 12 | 111 | 19743 | 116.17 | 860 | 842 | 162.7 |
| B | 11 | 111 | 17693 | 103.57 | 860 | 842 | 162.7 |
| C | 14 | 238 | 131174 | 687.77 | 817 | 825 | 189.5 |
| C | 10 | 22 | 43224 | 223.71 | 817 | 825 | 189.5 |
| C | 0 | 10 | 10285 | 49.91 | 817 | 825 | 189.5 |
| D | 1 | 52 | 696582 | 3472.85 | 828 | 806 | 200.3 |
| D | 2 | 136 | 88322 | 436.82 | 828 | 806 | 200.3 |
| D | 13 | 172 | 42613 | 208.67 | 828 | 806 | 200.3 |
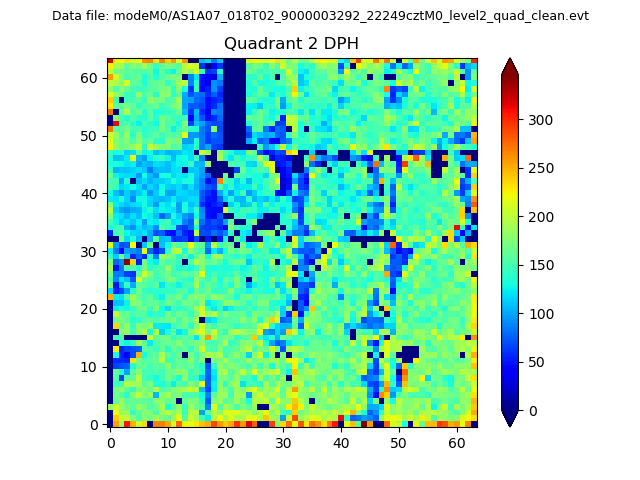
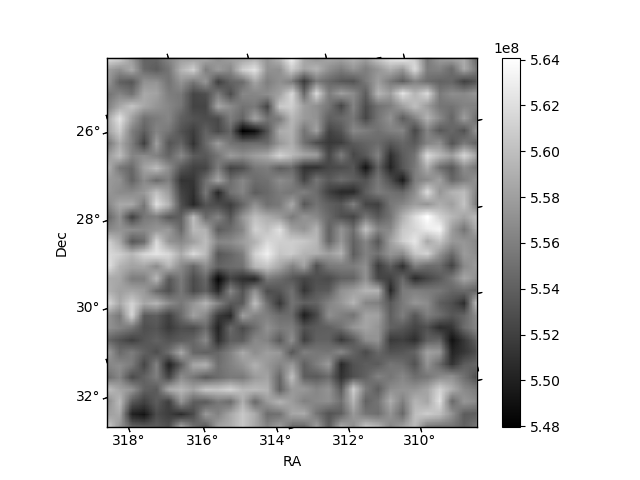
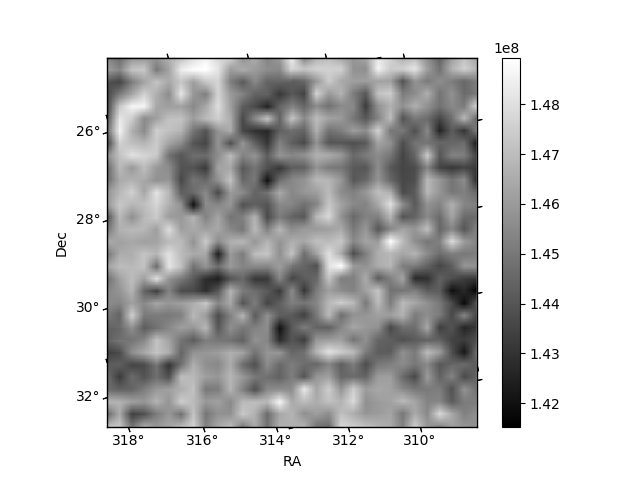
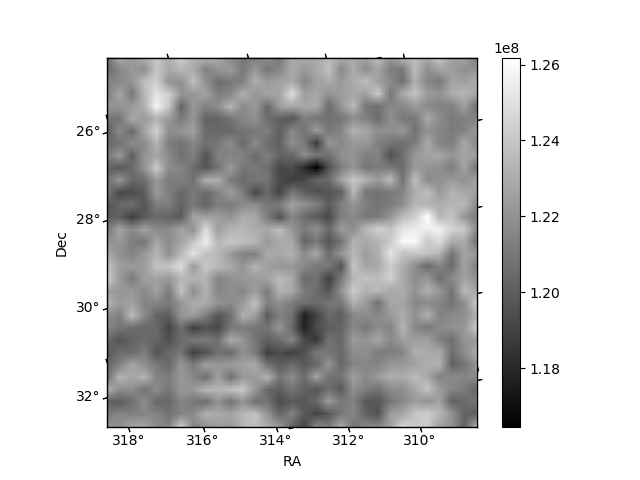
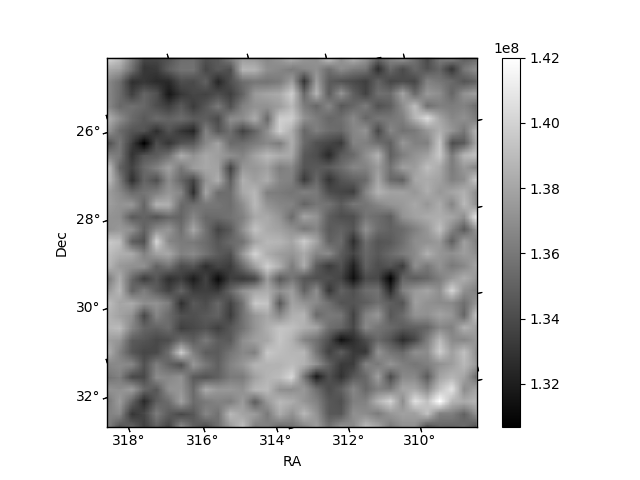
Histogram calculated using DETX and DETY for each event in the final _common_clean file
| Quadrant A | 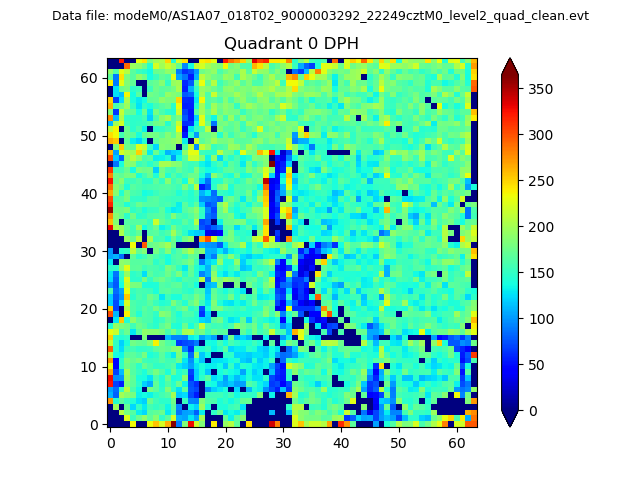 |
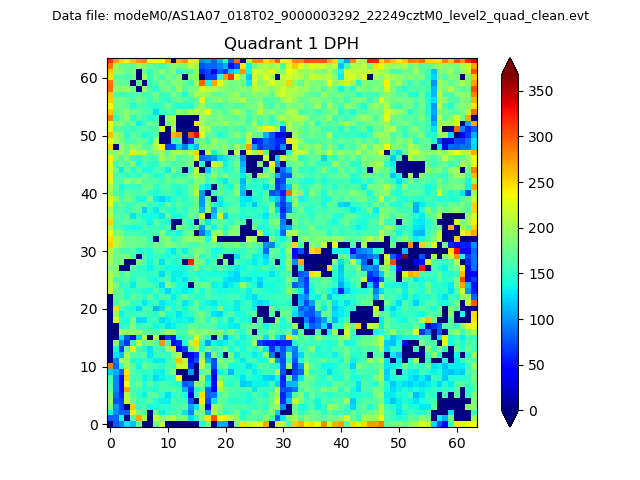 |
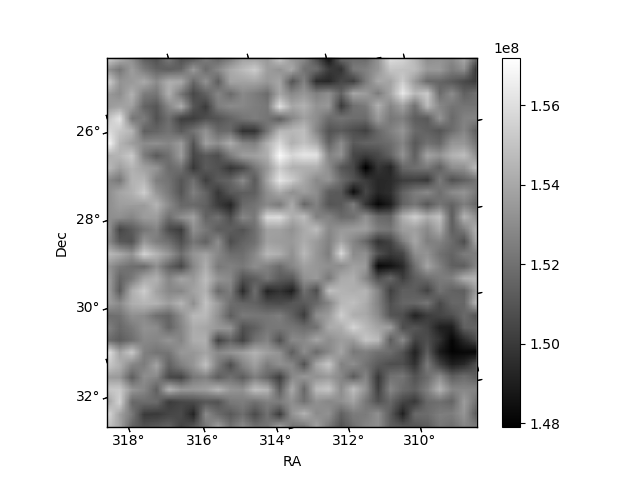
Quadrant B |
|---|---|---|---|
| Quadrant D | 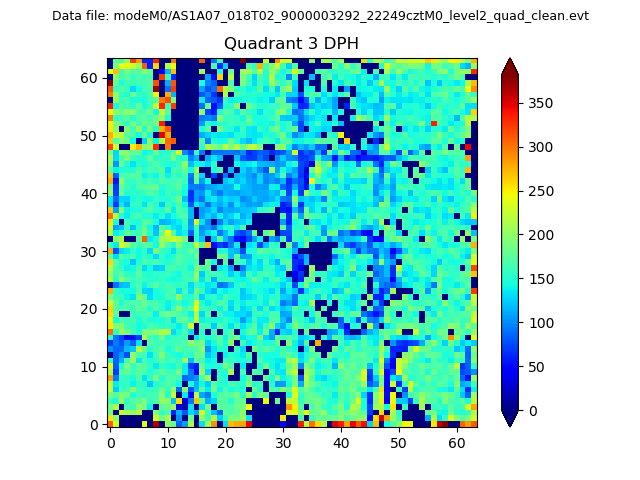 |
 |
Quadrant C |
| Plot type | Count rate plots | Images |
|---|---|---|
| Comparison with Poisson distribution Blue bars denote a histogram of data divided into 1 sec bins. Red curve is a Poisson curve with rate = median count rate of data. |
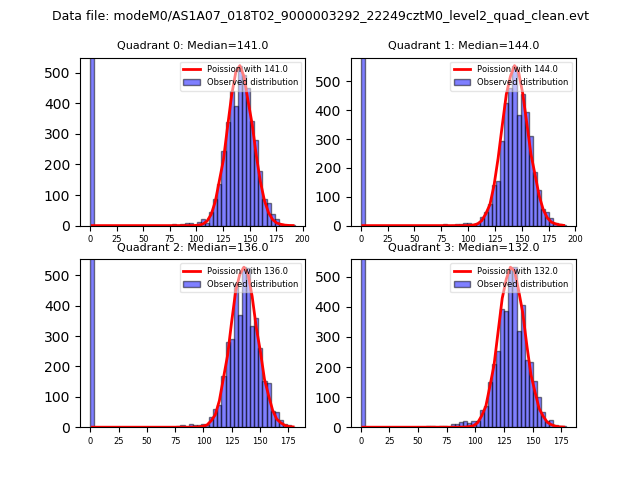 |
 |
| Quadrant-wise count rates Data is divided into 100 sec bins |
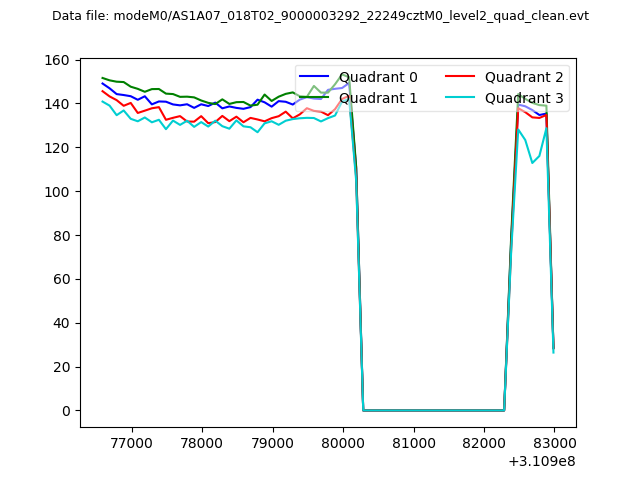 |
|
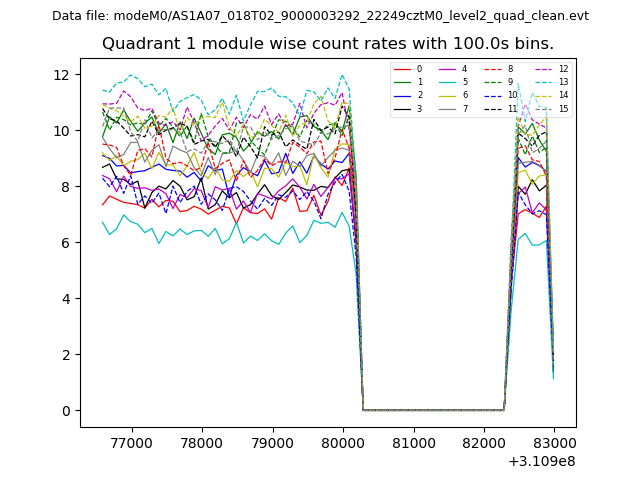
| Module-wise count rates for Quadrant A Data is divided into 100 sec bins |
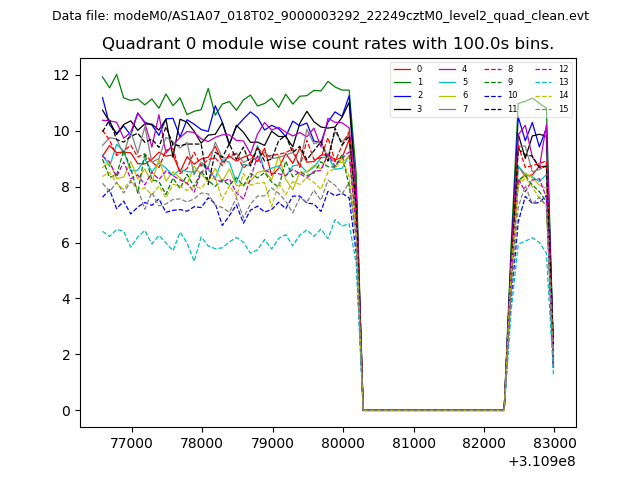 |
 |
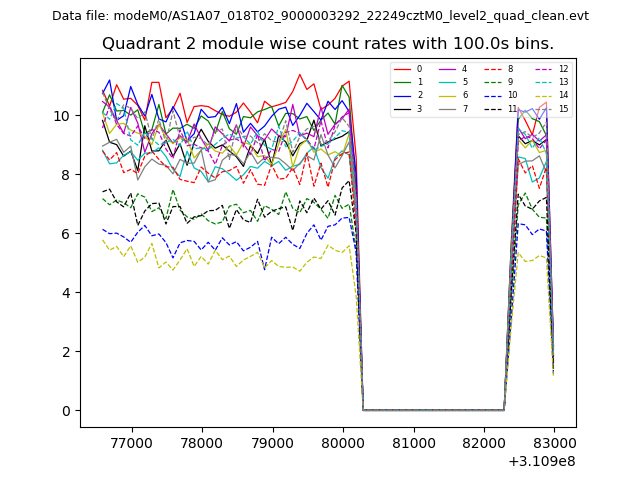
| Module-wise count rates for Quadrant B Data is divided into 100 sec bins |
 |
 |
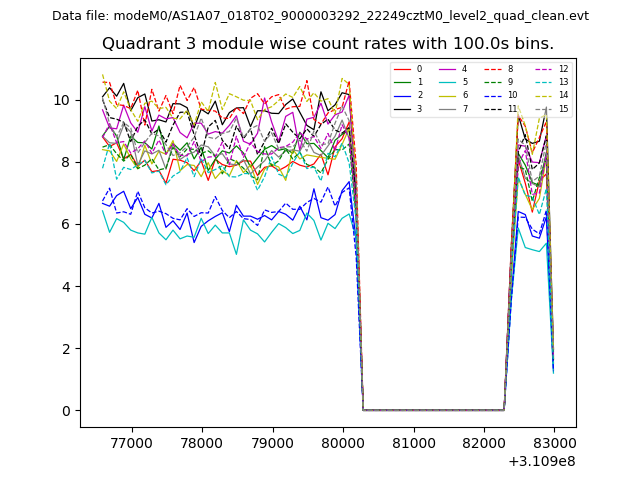
| Module-wise count rates for Quadrant C Data is divided into 100 sec bins |
 |
 |
| Module-wise count rates for Quadrant D Data is divided into 100 sec bins |
 |
 |
| Parameter | Plot |
|---|---|
| CZT HV Monitor | 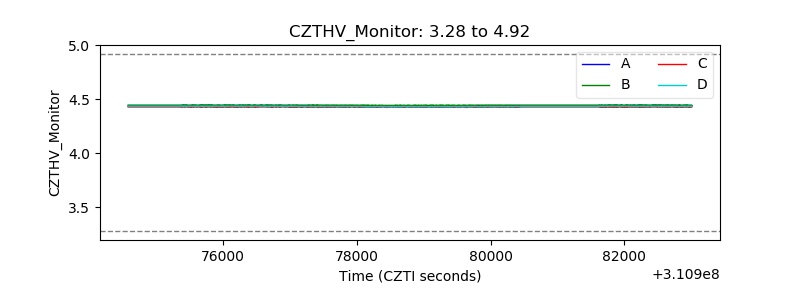 |
| D_VDD | 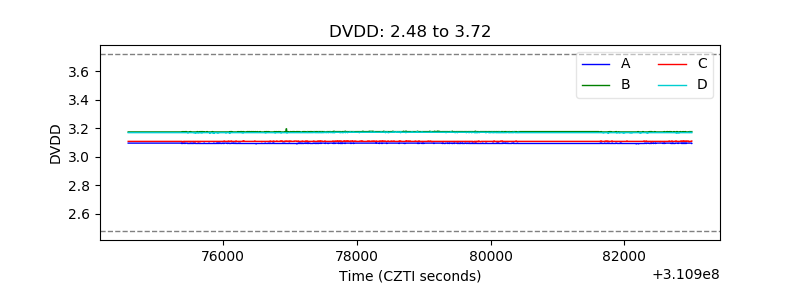 |
| Temperature 1 | 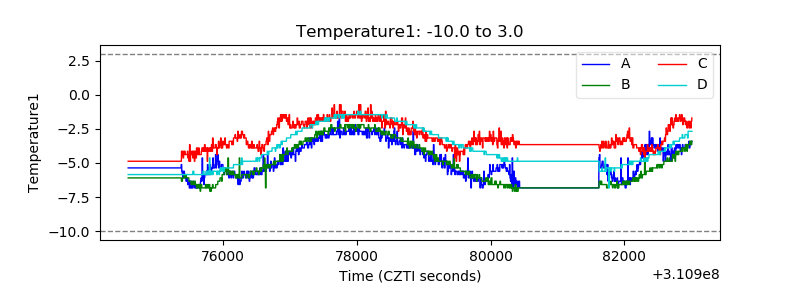 |
| Veto HV Monitor | 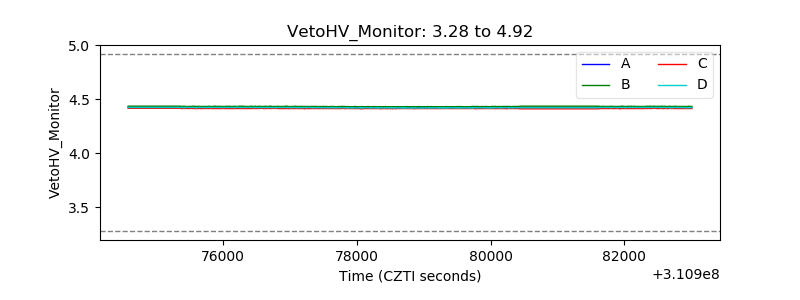 |
| Veto LLD | 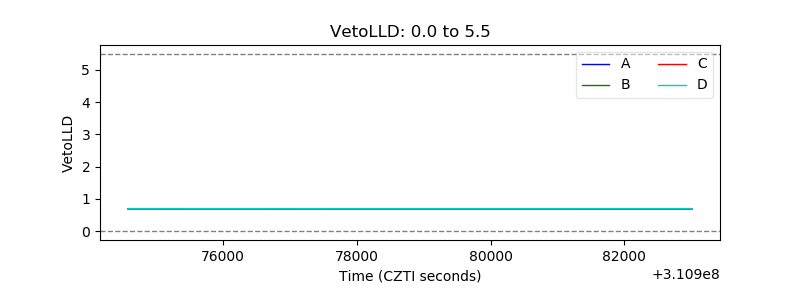 |
| Alpha Counter | 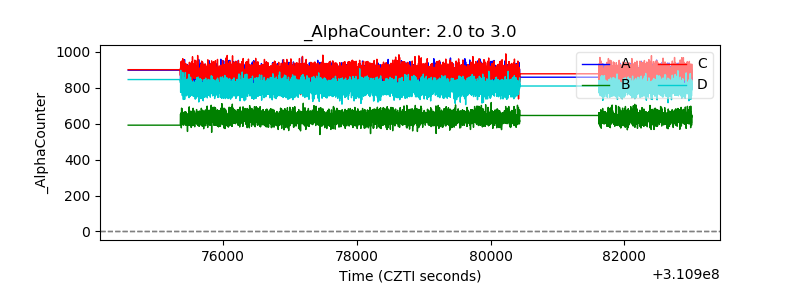 |
| _CPM_Rate | 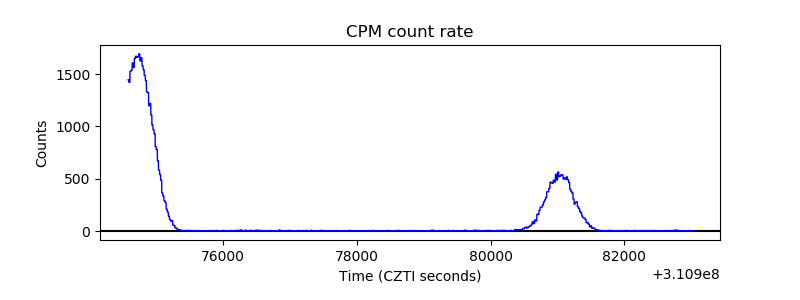 |
| CZT Counter | 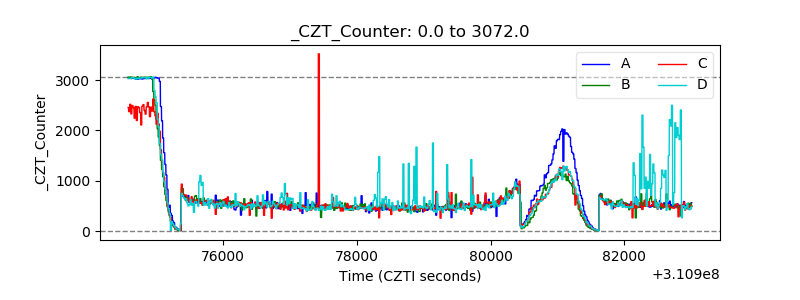 |
| +2.5 Volts monitor |  |
| +5 Volts monitor |  |
| _ROLL_ROT | 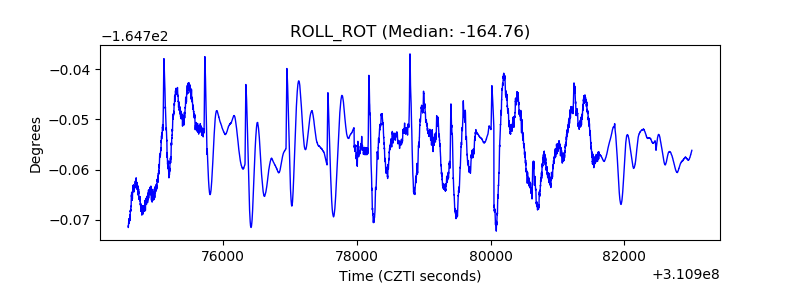 |
| _Roll_DEC | 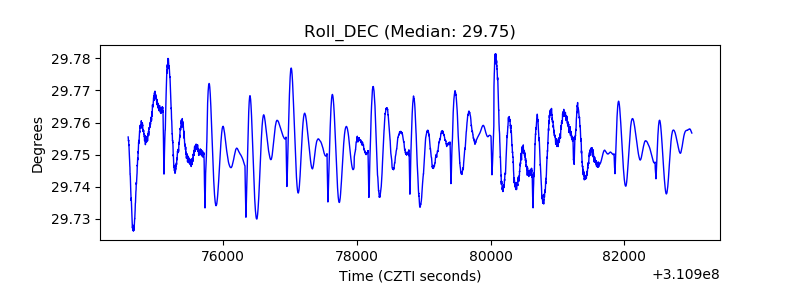 |
| _Roll_RA | 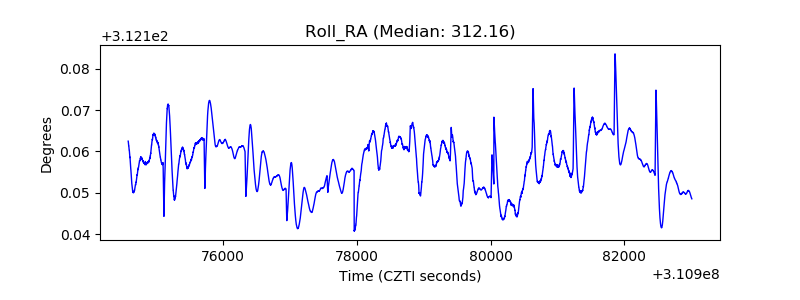 |
| Veto Counter | 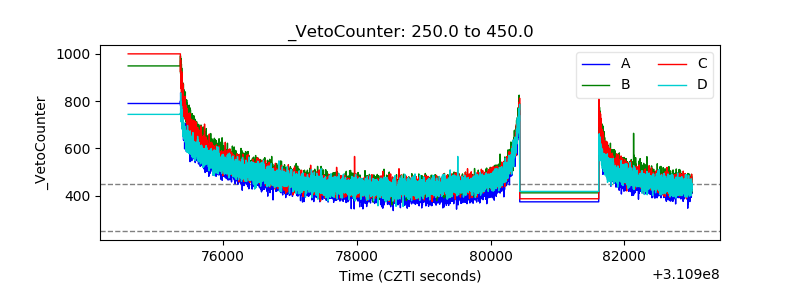 |