| Param | Original file | Final file |
|---|---|---|
| Filename | modeM0/AS1A07_018T02_9000003292_22250cztM0_level2.evt | modeM0/AS1A07_018T02_9000003292_22250cztM0_level2_quad_clean.evt |
| Size (bytes) | 491,558,400 | 94,838,400 |
| Size | 468.8 MB | 90.4 MB |
| Events in quadrant A | 3,338,912 | 613,483 |
| Events in quadrant B | 3,453,756 | 622,535 |
| Events in quadrant C | 3,359,014 | 591,376 |
| Events in quadrant D | 4,271,637 | 569,078 |
| Mode M0 | |||
|---|---|---|---|
| Quadrant | BADHDUFLAG | Total packets | Discarded packets |
| A | 0 | 14089 | 2 |
| B | 0 | 14404 | 2 |
| C | 0 | 14152 | 2 |
| D | 0 | 17088 | 2 |
| Mode M9 | |||
|---|---|---|---|
| Quadrant | BADHDUFLAG | Total packets | Discarded packets |
| A | 0 | 9 | 0 |
| B | 0 | 10 | 0 |
| C | 0 | 10 | 0 |
| D | 0 | 10 | 0 |
| Mode SS | |||
|---|---|---|---|
| Quadrant | BADHDUFLAG | Total packets | Discarded packets |
| A | 0 | 138 | 0 |
| B | 0 | 138 | 0 |
| C | 0 | 138 | 0 |
| D | 0 | 138 | 0 |
| Quadrant | Total seconds | Saturated seconds | Saturation percentage |
|---|---|---|---|
| A | 6826 | 130 | 1.904483% |
| B | 6826 | 156 | 2.285379% |
| C | 6825 | 154 | 2.256410% |
| D | 6825 | 256 | 3.750916% |
Noise dominated data is calculated using 1-second bins in cleaned event files. If a bin has >2000 counts, and if more than 50% of those come from <1% of pixels, then it is considered to be noise-dominated and hence unusable.
| Quadrant | # 1 sec bins | Bins with >0 counts | Bins with >2000 counts | High rate bins dominated by noise | Noise dominated (total time) | Noise dominated (detector-on time) | Marked lightcurve |
|---|---|---|---|---|---|---|---|
| A | 7601 | 6827 | 0 | 0 | 0.00% | 0.00% | 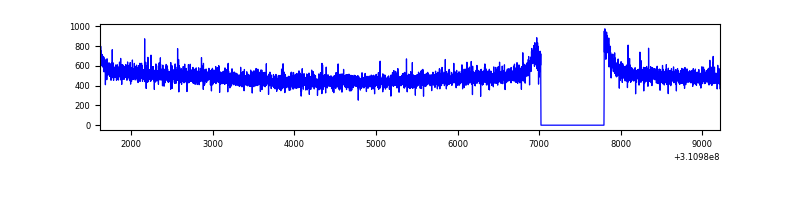 |
| B | 7601 | 6827 | 13 | 13 | 0.17% | 0.19% | 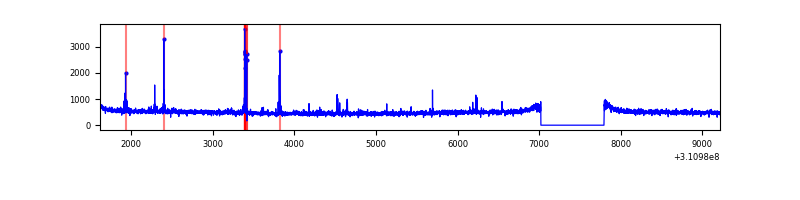 |
| C | 7600 | 6826 | 1 | 1 | 0.01% | 0.01% | 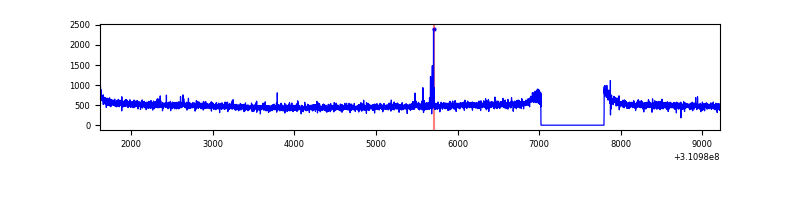 |
| D | 7600 | 6826 | 183 | 183 | 2.41% | 2.68% | 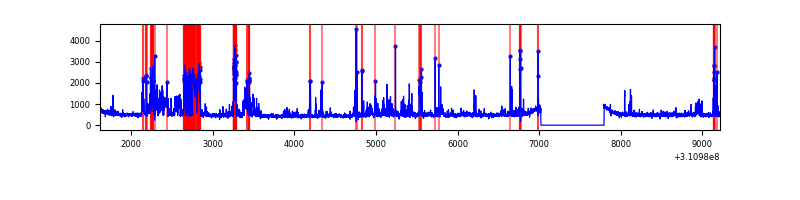 |
Top three noisy pixels from each quadrant. If the there are fewer than three noisy pixels in the level2.evt file, extra rows are filled as -1
| Pixel properties | Quadrant properties | ||||||
|---|---|---|---|---|---|---|---|
| Quadrant | DetID | PixID | Counts | Sigma | Mean | Median | Sigma |
| A | 13 | 254 | 10486 | 55.55 | 866 | 849 | 173.5 |
| A | 0 | 226 | 7578 | 38.79 | 866 | 849 | 173.5 |
| A | 3 | 137 | 7560 | 38.68 | 866 | 849 | 173.5 |
| B | 3 | 64 | 37012 | 219.86 | 857 | 837 | 164.5 |
| B | 4 | 173 | 23516 | 137.83 | 857 | 837 | 164.5 |
| B | 12 | 111 | 20041 | 116.71 | 857 | 837 | 164.5 |
| C | 14 | 238 | 129192 | 670.64 | 822 | 828 | 191.4 |
| C | 10 | 22 | 21454 | 107.76 | 822 | 828 | 191.4 |
| C | 13 | 61 | 5762 | 25.78 | 822 | 828 | 191.4 |
| D | 1 | 52 | 1062959 | 5281.12 | 831 | 809 | 201.1 |
| D | 2 | 234 | 27735 | 133.88 | 831 | 809 | 201.1 |
| D | 13 | 172 | 24368 | 117.14 | 831 | 809 | 201.1 |
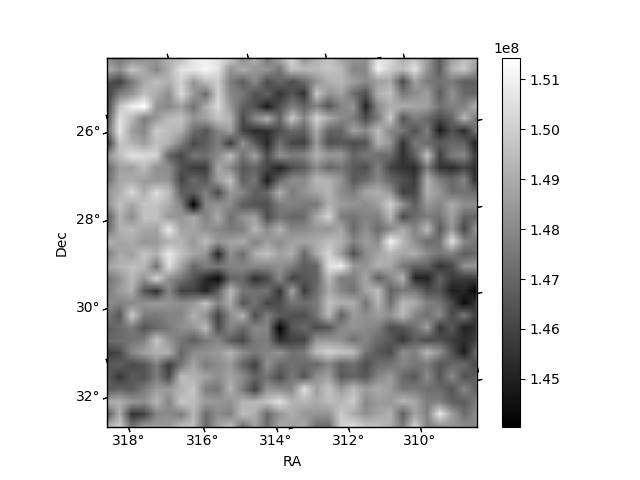
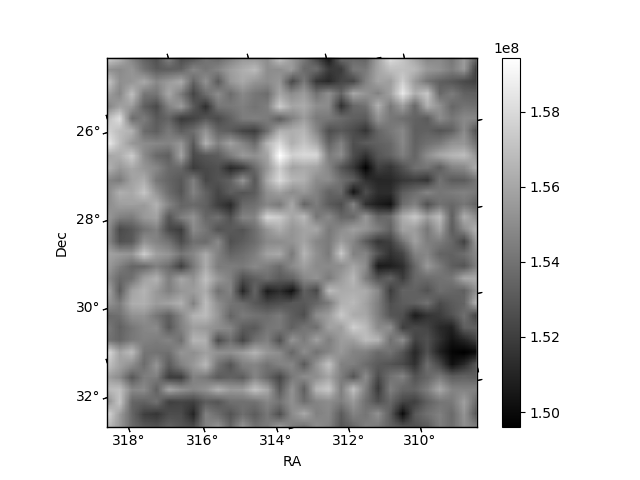
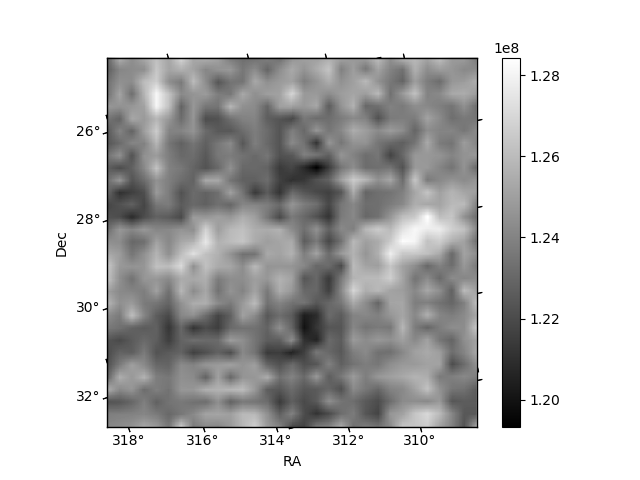
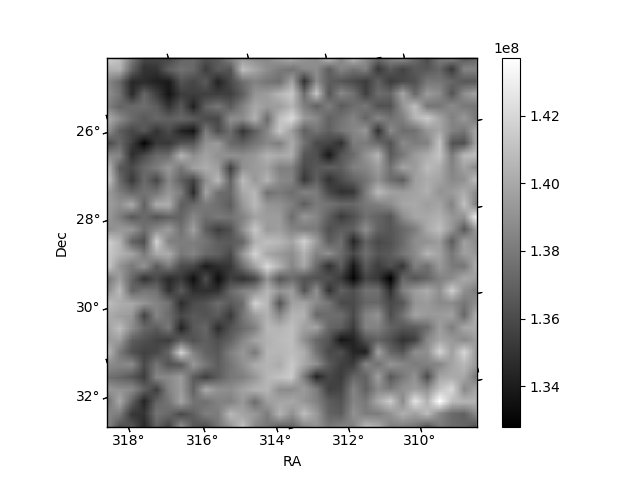
Histogram calculated using DETX and DETY for each event in the final _common_clean file
| Quadrant A | 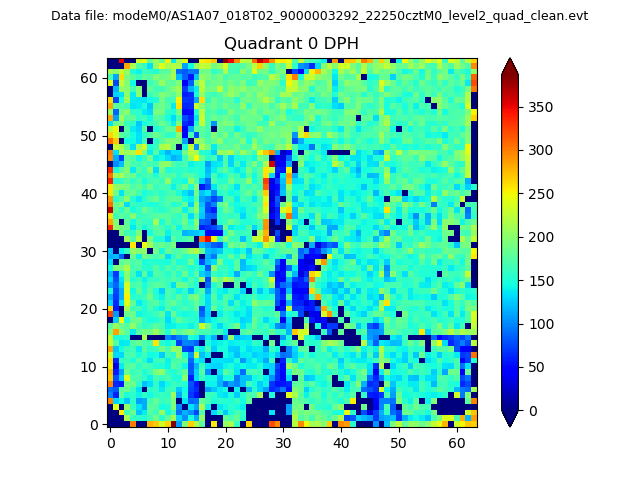 |
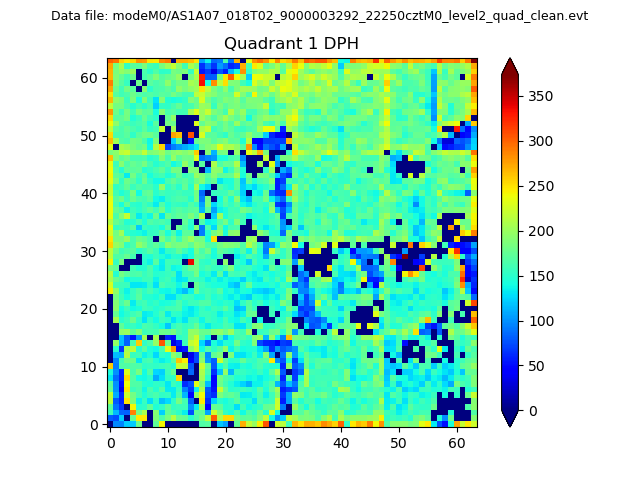 |
Quadrant B |
|---|---|---|---|
| Quadrant D | 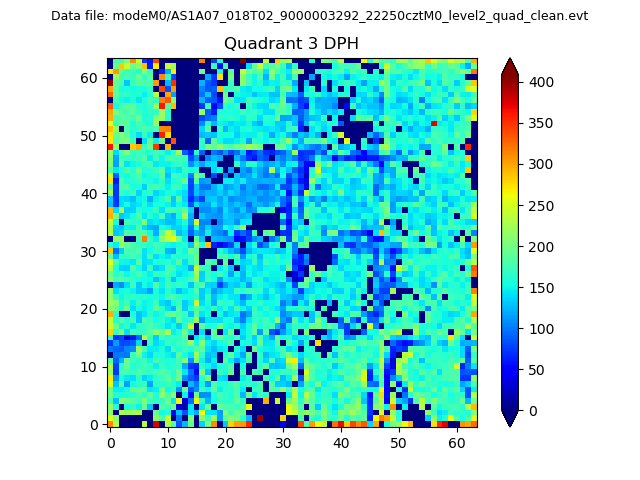 |
 |
Quadrant C |
| Plot type | Count rate plots | Images |
|---|---|---|
| Comparison with Poisson distribution Blue bars denote a histogram of data divided into 1 sec bins. Red curve is a Poisson curve with rate = median count rate of data. |
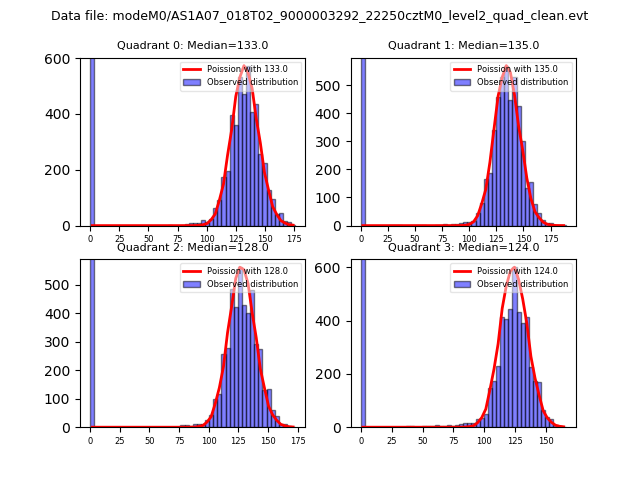 |
 |
| Quadrant-wise count rates Data is divided into 100 sec bins |
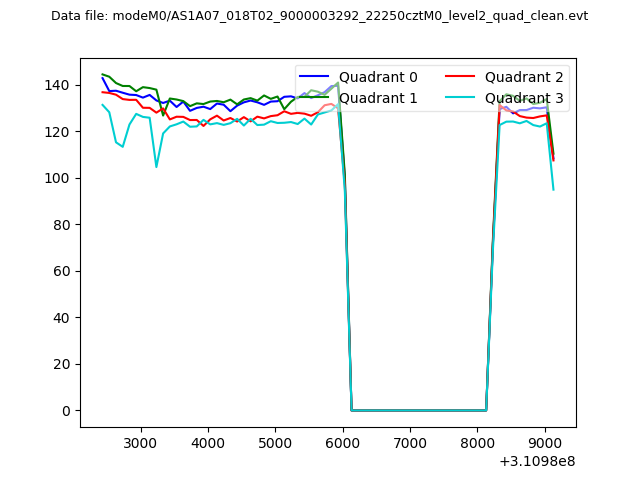 |
|
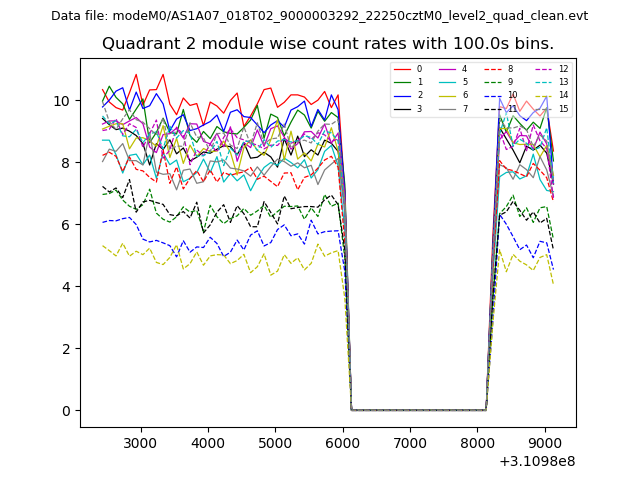
| Module-wise count rates for Quadrant A Data is divided into 100 sec bins |
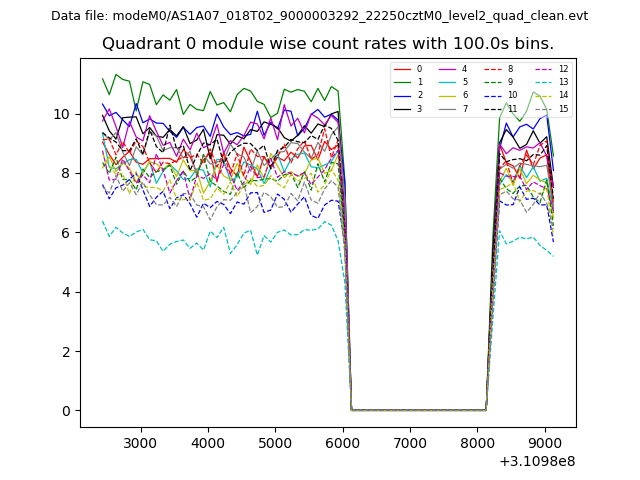 |
 |
| Module-wise count rates for Quadrant B Data is divided into 100 sec bins |
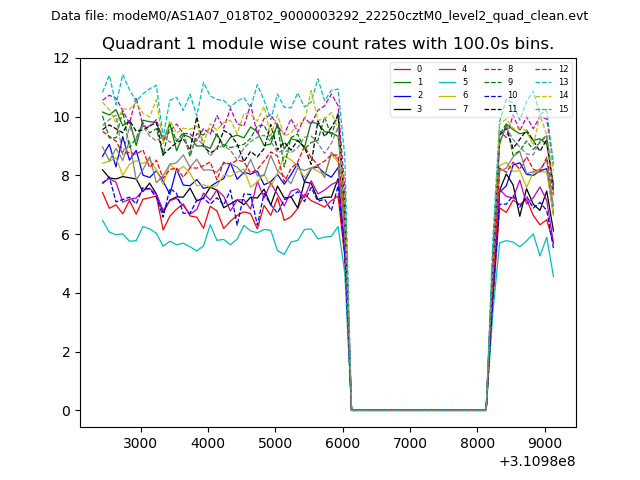 |
 |
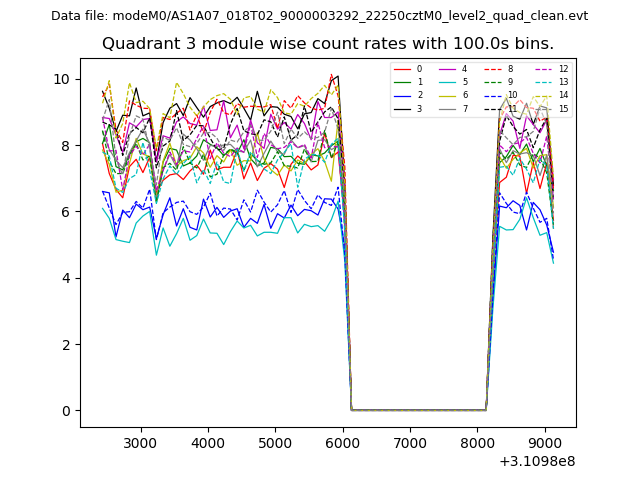
| Module-wise count rates for Quadrant C Data is divided into 100 sec bins |
 |
 |
| Module-wise count rates for Quadrant D Data is divided into 100 sec bins |
 |
 |
| Parameter | Plot |
|---|---|
| CZT HV Monitor | 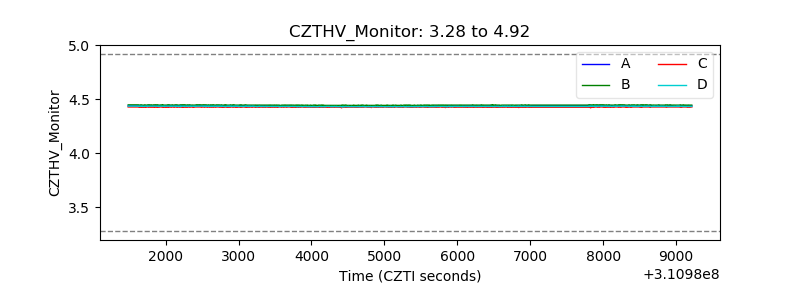 |
| D_VDD | 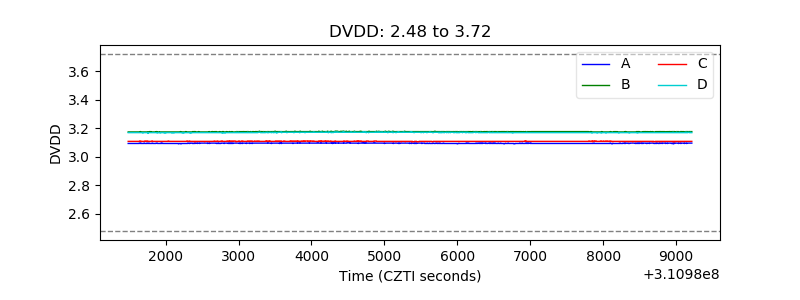 |
| Temperature 1 |  |
| Veto HV Monitor | 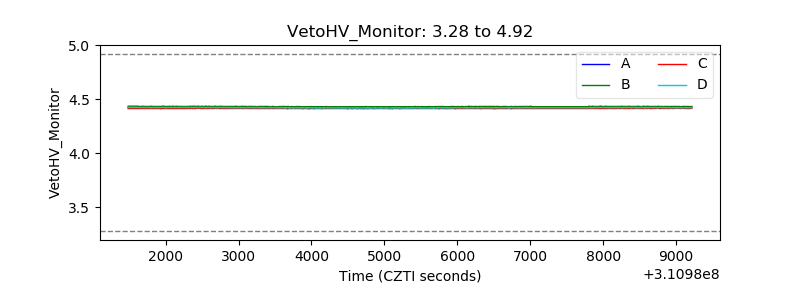 |
| Veto LLD | 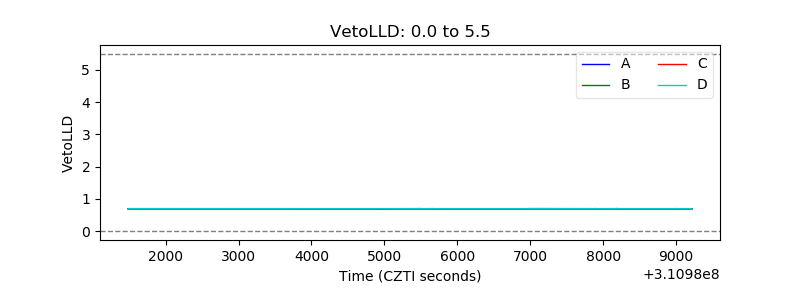 |
| Alpha Counter | 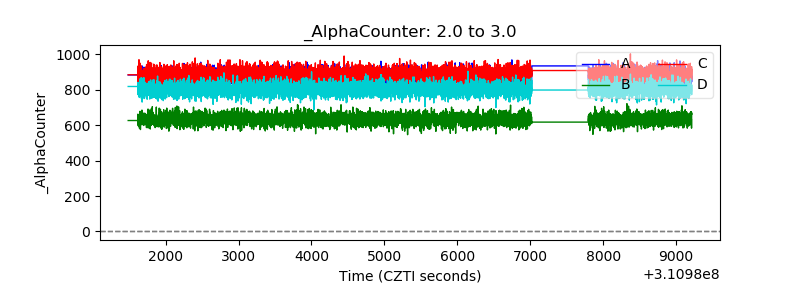 |
| _CPM_Rate | 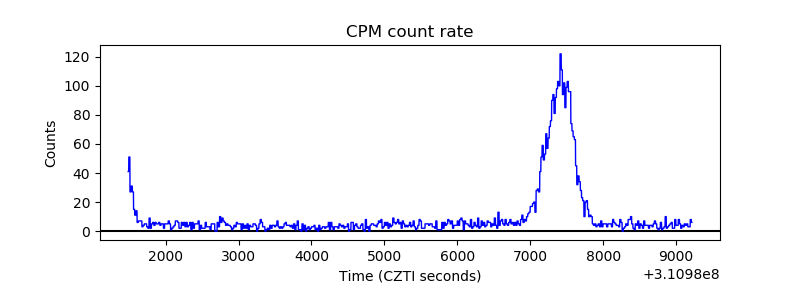 |
| CZT Counter |  |
| +2.5 Volts monitor |  |
| +5 Volts monitor |  |
| _ROLL_ROT | 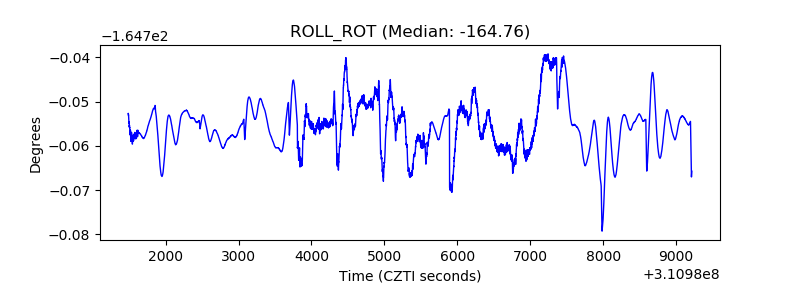 |
| _Roll_DEC | 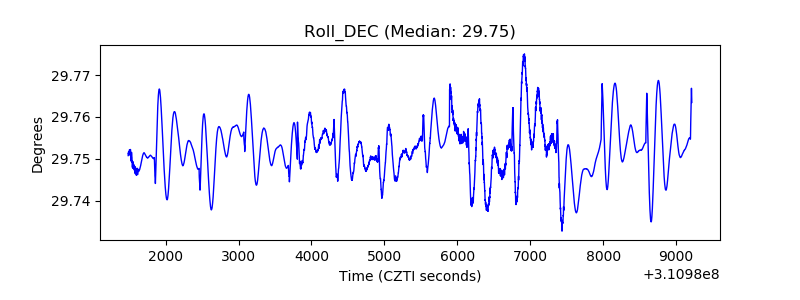 |
| _Roll_RA | 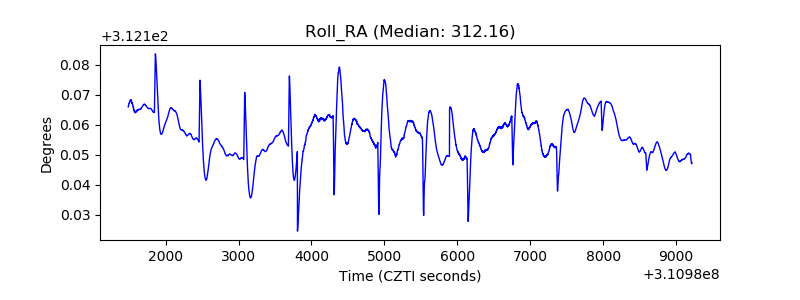 |
| Veto Counter |  |