| Param | Original file | Final file |
|---|---|---|
| Filename | modeM0/AS1A07_018T02_9000003292_22251cztM0_level2.evt | modeM0/AS1A07_018T02_9000003292_22251cztM0_level2_quad_clean.evt |
| Size (bytes) | 574,583,040 | 99,858,240 |
| Size | 548.0 MB | 95.2 MB |
| Events in quadrant A | 3,613,823 | 650,110 |
| Events in quadrant B | 3,722,896 | 662,151 |
| Events in quadrant C | 3,671,186 | 629,611 |
| Events in quadrant D | 5,889,089 | 564,960 |
| Mode M0 | |||
|---|---|---|---|
| Quadrant | BADHDUFLAG | Total packets | Discarded packets |
| A | 0 | 15465 | 2 |
| B | 0 | 15689 | 2 |
| C | 0 | 15616 | 2 |
| D | 0 | 22422 | 2 |
| Mode M9 | |||
|---|---|---|---|
| Quadrant | BADHDUFLAG | Total packets | Discarded packets |
| A | 0 | 9 | 0 |
| B | 0 | 10 | 0 |
| C | 0 | 10 | 0 |
| D | 0 | 10 | 0 |
| Mode SS | |||
|---|---|---|---|
| Quadrant | BADHDUFLAG | Total packets | Discarded packets |
| A | 0 | 150 | 0 |
| B | 0 | 150 | 0 |
| C | 0 | 150 | 0 |
| D | 0 | 150 | 0 |
| Quadrant | Total seconds | Saturated seconds | Saturation percentage |
|---|---|---|---|
| A | 7438 | 187 | 2.514117% |
| B | 7438 | 224 | 3.011562% |
| C | 7438 | 200 | 2.688895% |
| D | 7438 | 809 | 10.876580% |
Noise dominated data is calculated using 1-second bins in cleaned event files. If a bin has >2000 counts, and if more than 50% of those come from <1% of pixels, then it is considered to be noise-dominated and hence unusable.
| Quadrant | # 1 sec bins | Bins with >0 counts | Bins with >2000 counts | High rate bins dominated by noise | Noise dominated (total time) | Noise dominated (detector-on time) | Marked lightcurve |
|---|---|---|---|---|---|---|---|
| A | 7753 | 7440 | 0 | 0 | 0.00% | 0.00% | 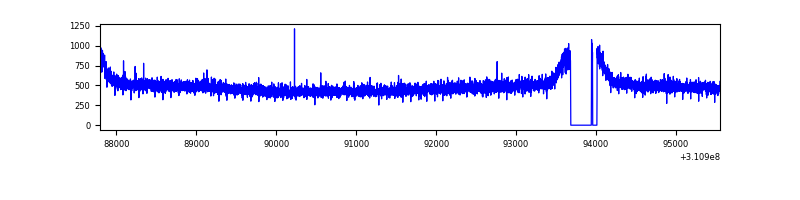 |
| B | 7753 | 7440 | 1 | 1 | 0.01% | 0.01% | 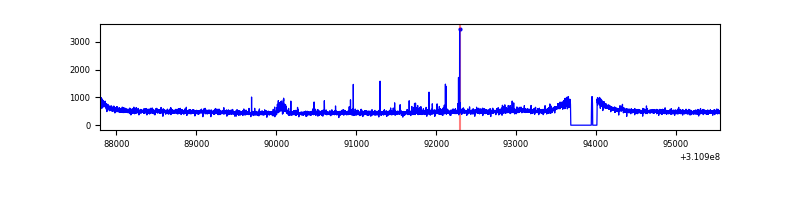 |
| C | 7753 | 7440 | 3 | 3 | 0.04% | 0.04% | 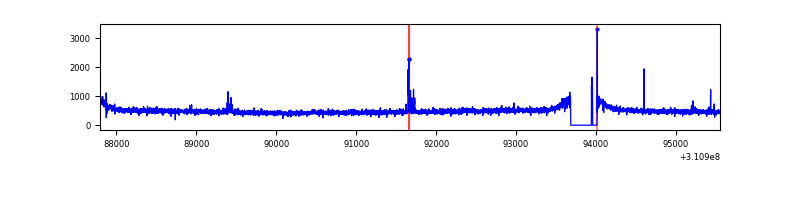 |
| D | 7753 | 7440 | 623 | 623 | 8.04% | 8.37% | 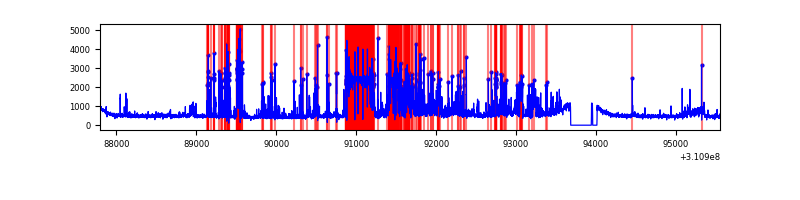 |
Top three noisy pixels from each quadrant. If the there are fewer than three noisy pixels in the level2.evt file, extra rows are filled as -1
| Pixel properties | Quadrant properties | ||||||
|---|---|---|---|---|---|---|---|
| Quadrant | DetID | PixID | Counts | Sigma | Mean | Median | Sigma |
| A | 13 | 254 | 11368 | 54.84 | 937 | 917 | 190.6 |
| A | 3 | 137 | 8281 | 38.64 | 937 | 917 | 190.6 |
| A | 0 | 226 | 8144 | 37.92 | 937 | 917 | 190.6 |
| B | 0 | 190 | 33597 | 181.07 | 927 | 901 | 180.6 |
| B | 4 | 173 | 30451 | 163.65 | 927 | 901 | 180.6 |
| B | 12 | 111 | 22401 | 119.07 | 927 | 901 | 180.6 |
| C | 14 | 238 | 140646 | 663.93 | 889 | 893 | 210.5 |
| C | 10 | 22 | 65142 | 305.23 | 889 | 893 | 210.5 |
| C | 13 | 61 | 6215 | 25.28 | 889 | 893 | 210.5 |
| D | 1 | 52 | 2485572 | 11829.89 | 866 | 842 | 210.0 |
| D | 7 | 222 | 36302 | 168.83 | 866 | 842 | 210.0 |
| D | 7 | 223 | 34807 | 161.71 | 866 | 842 | 210.0 |
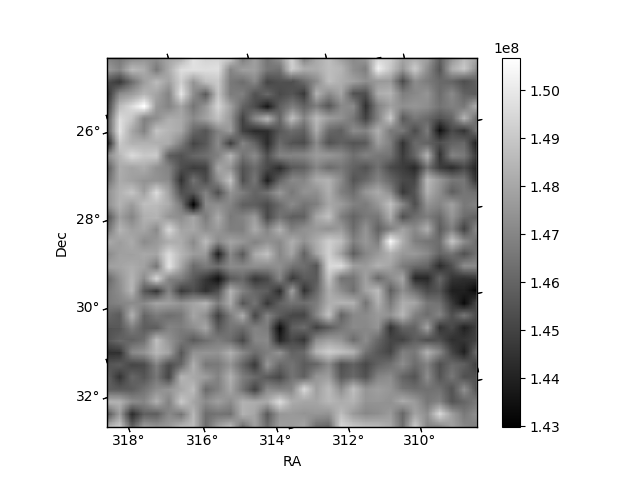
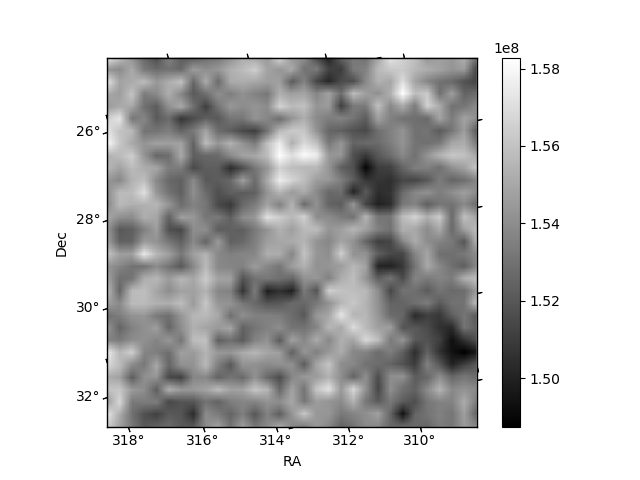
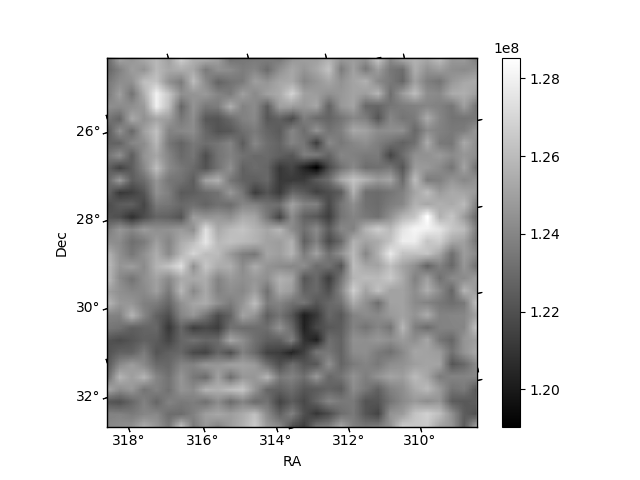
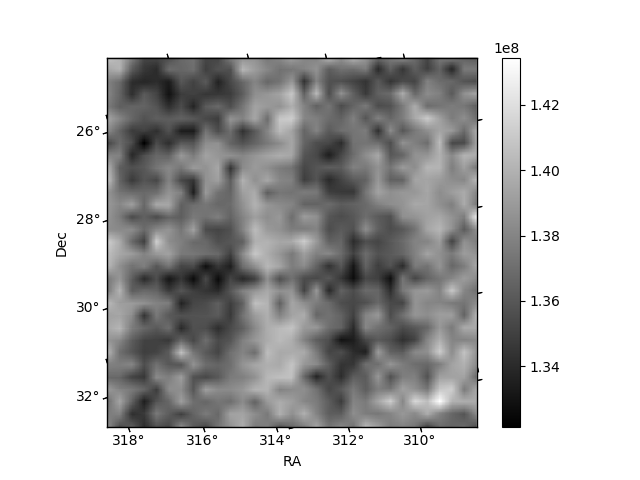
Histogram calculated using DETX and DETY for each event in the final _common_clean file
| Quadrant A | 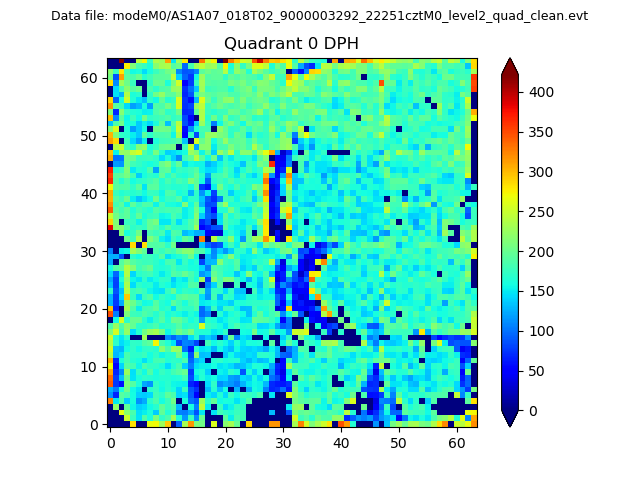 |
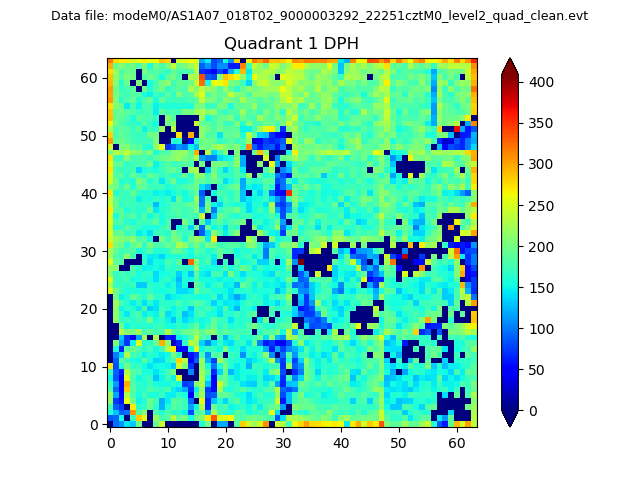 |
Quadrant B |
|---|---|---|---|
| Quadrant D |  |
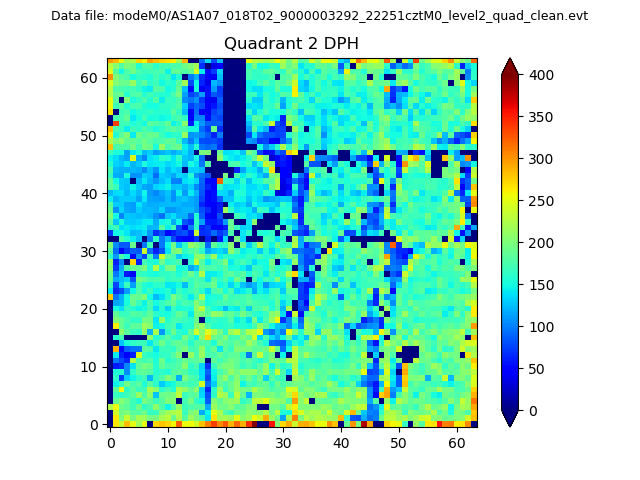 |
Quadrant C |
| Plot type | Count rate plots | Images |
|---|---|---|
| Comparison with Poisson distribution Blue bars denote a histogram of data divided into 1 sec bins. Red curve is a Poisson curve with rate = median count rate of data. |
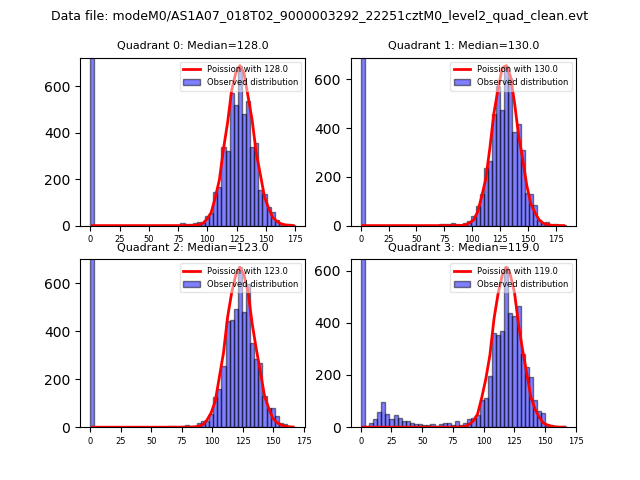 |
 |
| Quadrant-wise count rates Data is divided into 100 sec bins |
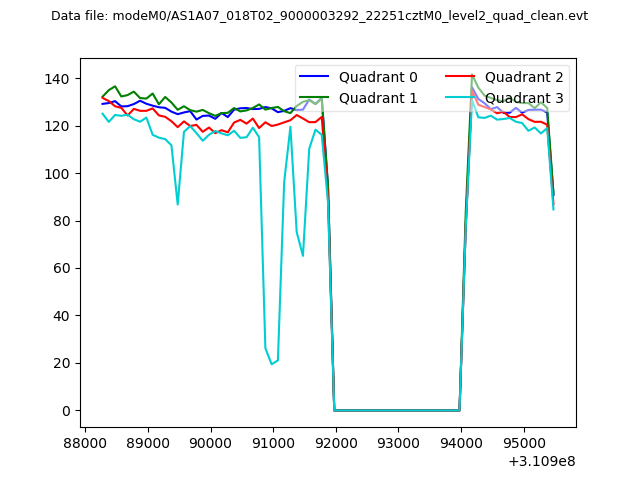 |
|
| Module-wise count rates for Quadrant A Data is divided into 100 sec bins |
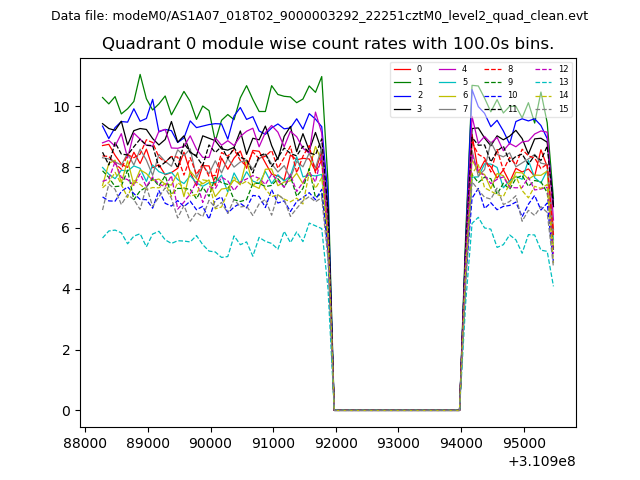 |
 |
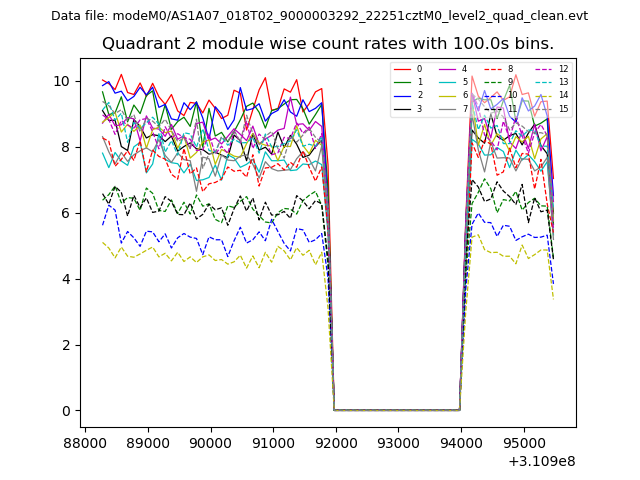
| Module-wise count rates for Quadrant B Data is divided into 100 sec bins |
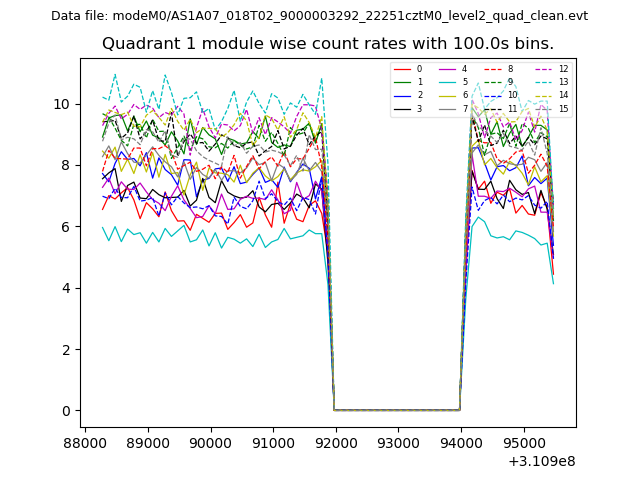 |
 |
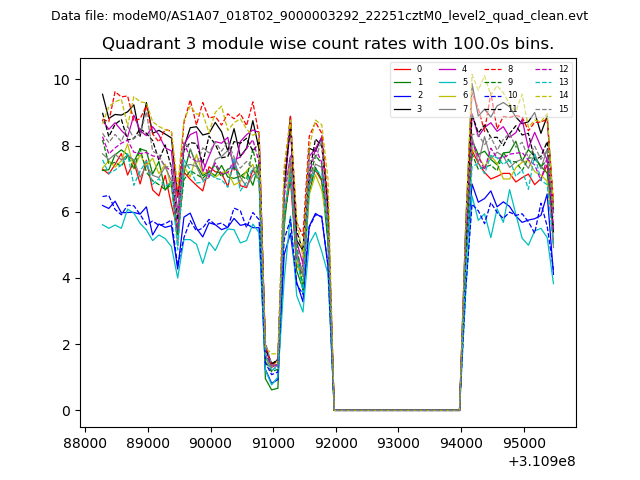
| Module-wise count rates for Quadrant C Data is divided into 100 sec bins |
 |
 |
| Module-wise count rates for Quadrant D Data is divided into 100 sec bins |
 |
 |
| Parameter | Plot |
|---|---|
| CZT HV Monitor | 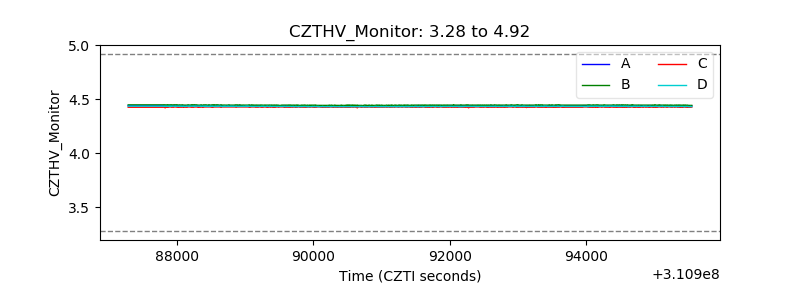 |
| D_VDD | 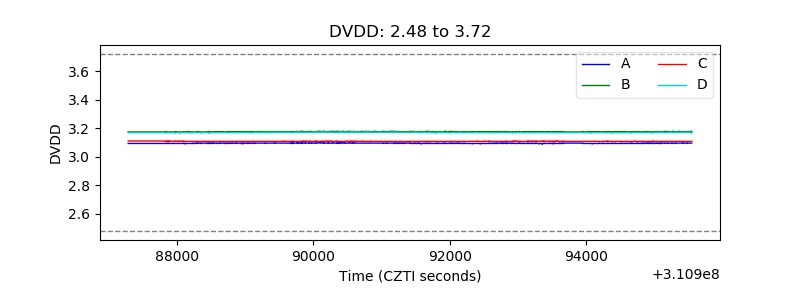 |
| Temperature 1 | 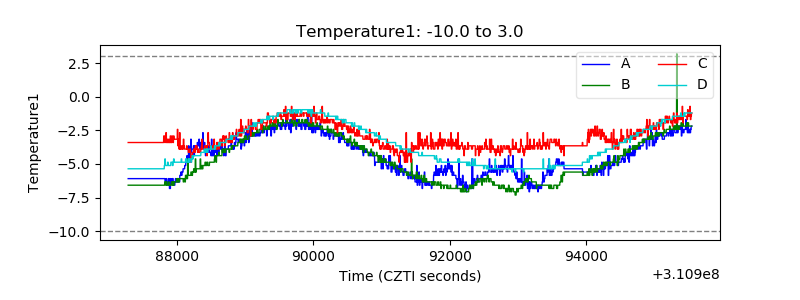 |
| Veto HV Monitor | 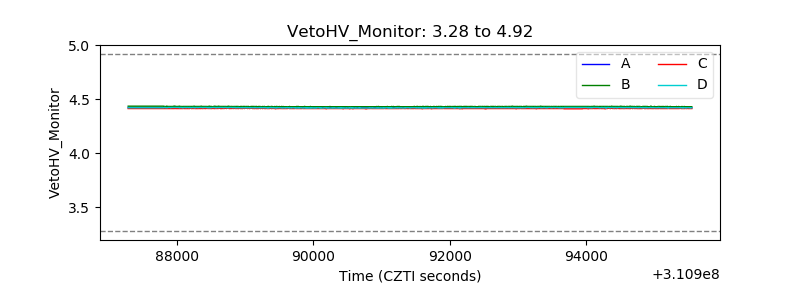 |
| Veto LLD | 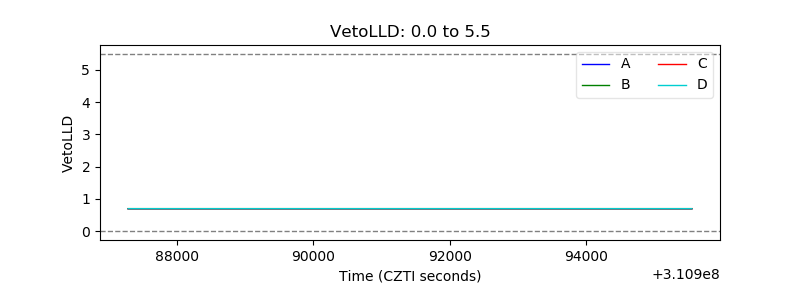 |
| Alpha Counter |  |
| _CPM_Rate |  |
| CZT Counter | 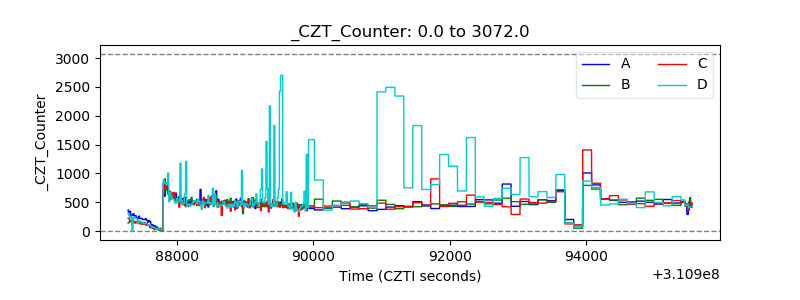 |
| +2.5 Volts monitor |  |
| +5 Volts monitor |  |
| _ROLL_ROT | 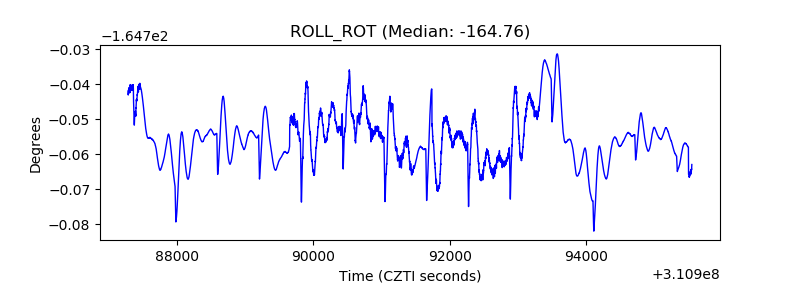 |
| _Roll_DEC | 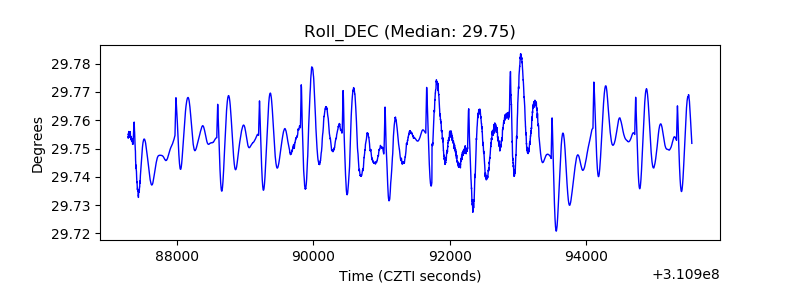 |
| _Roll_RA |  |
| Veto Counter | 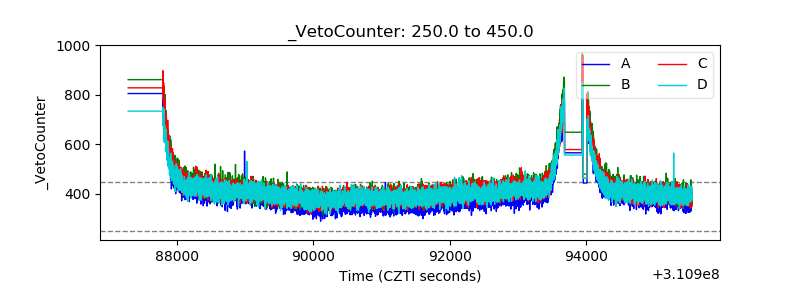 |