| Param | Original file | Final file |
|---|---|---|
| Filename | modeM0/AS1A07_018T02_9000003292_22252cztM0_level2.evt | modeM0/AS1A07_018T02_9000003292_22252cztM0_level2_quad_clean.evt |
| Size (bytes) | 191,214,720 | 48,574,080 |
| Size | 182.4 MB | 46.3 MB |
| Events in quadrant A | 1,182,879 | 330,283 |
| Events in quadrant B | 1,216,346 | 334,341 |
| Events in quadrant C | 1,224,435 | 318,771 |
| Events in quadrant D | 1,984,725 | 297,200 |
| Mode M0 | |||
|---|---|---|---|
| Quadrant | BADHDUFLAG | Total packets | Discarded packets |
| A | 0 | 5328 | 0 |
| B | 0 | 5344 | 0 |
| C | 0 | 5444 | 0 |
| D | 0 | 7682 | 0 |
| Mode SS | |||
|---|---|---|---|
| Quadrant | BADHDUFLAG | Total packets | Discarded packets |
| A | 0 | 52 | 0 |
| B | 0 | 52 | 0 |
| C | 0 | 52 | 0 |
| D | 0 | 52 | 0 |
| Quadrant | Total seconds | Saturated seconds | Saturation percentage |
|---|---|---|---|
| A | 2657 | 1 | 0.037636% |
| B | 2658 | 3 | 0.112867% |
| C | 2658 | 8 | 0.300978% |
| D | 2658 | 239 | 8.991723% |
Noise dominated data is calculated using 1-second bins in cleaned event files. If a bin has >2000 counts, and if more than 50% of those come from <1% of pixels, then it is considered to be noise-dominated and hence unusable.
| Quadrant | # 1 sec bins | Bins with >0 counts | Bins with >2000 counts | High rate bins dominated by noise | Noise dominated (total time) | Noise dominated (detector-on time) | Marked lightcurve |
|---|---|---|---|---|---|---|---|
| A | 2657 | 2657 | 0 | 0 | 0.00% | 0.00% | 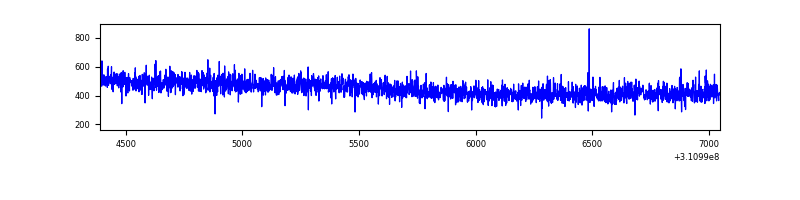 |
| B | 2658 | 2658 | 0 | 0 | 0.00% | 0.00% | 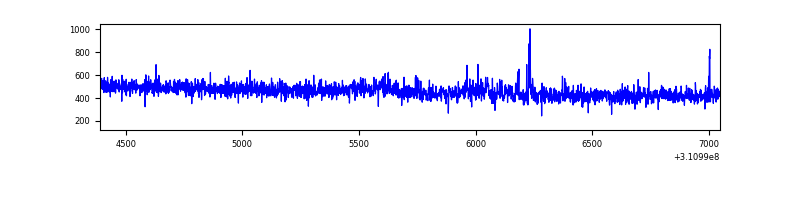 |
| C | 2658 | 2658 | 0 | 0 | 0.00% | 0.00% | 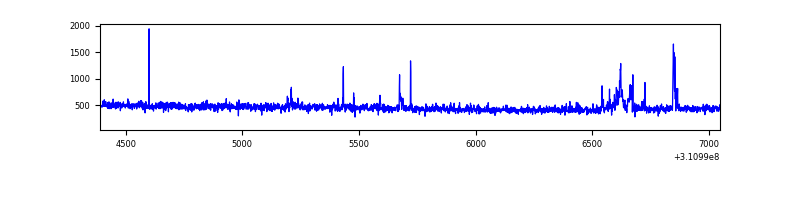 |
| D | 2658 | 2658 | 208 | 208 | 7.83% | 7.83% | 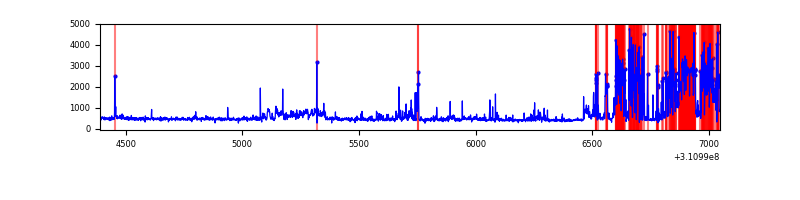 |
Top three noisy pixels from each quadrant. If the there are fewer than three noisy pixels in the level2.evt file, extra rows are filled as -1
| Pixel properties | Quadrant properties | ||||||
|---|---|---|---|---|---|---|---|
| Quadrant | DetID | PixID | Counts | Sigma | Mean | Median | Sigma |
| A | 13 | 254 | 4286 | 62.26 | 306 | 299 | 64.0 |
| A | 0 | 226 | 2679 | 37.16 | 306 | 299 | 64.0 |
| A | 3 | 137 | 2618 | 36.21 | 306 | 299 | 64.0 |
| B | 0 | 190 | 19957 | 327.58 | 301 | 293 | 60.0 |
| B | 4 | 171 | 12351 | 200.87 | 301 | 293 | 60.0 |
| B | 12 | 111 | 6794 | 108.3 | 301 | 293 | 60.0 |
| C | 10 | 22 | 51073 | 738.73 | 289 | 290 | 68.7 |
| C | 14 | 238 | 46252 | 668.6 | 289 | 290 | 68.7 |
| C | 13 | 61 | 2057 | 25.7 | 289 | 290 | 68.7 |
| D | 1 | 52 | 862857 | 12446.7 | 284 | 275 | 69.3 |
| D | 13 | 172 | 29020 | 414.78 | 284 | 275 | 69.3 |
| D | 2 | 234 | 10785 | 151.65 | 284 | 275 | 69.3 |
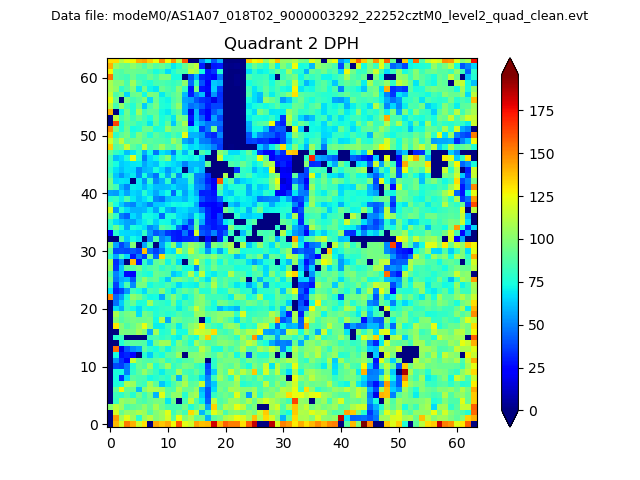
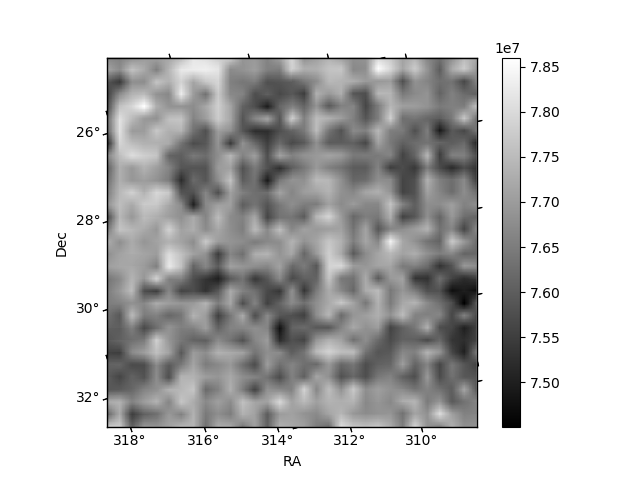
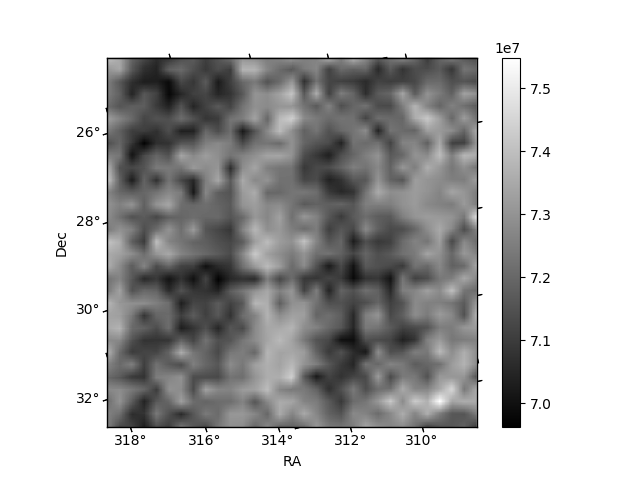
Histogram calculated using DETX and DETY for each event in the final _common_clean file
| Quadrant A | 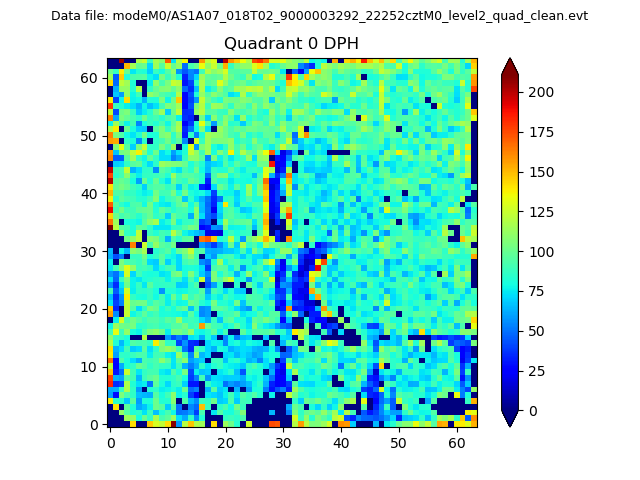 |
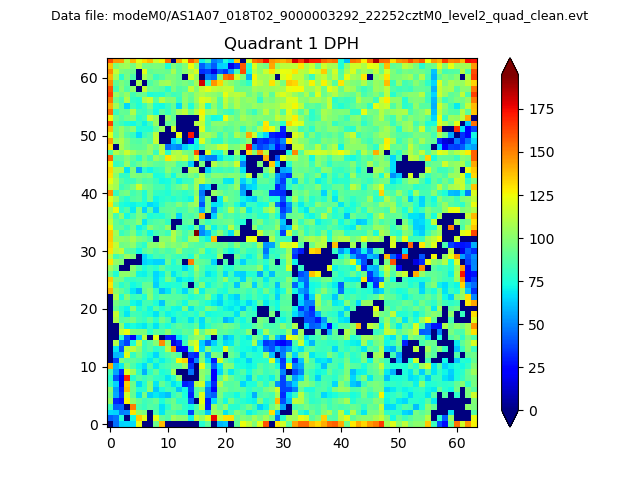 |
Quadrant B |
|---|---|---|---|
| Quadrant D | 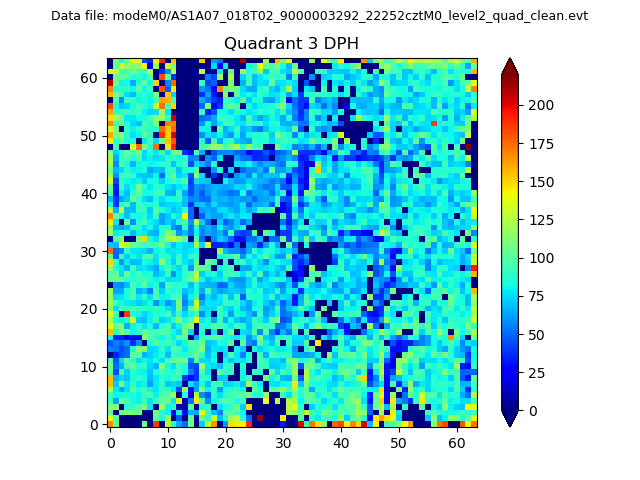 |
 |
Quadrant C |
| Plot type | Count rate plots | Images |
|---|---|---|
| Comparison with Poisson distribution Blue bars denote a histogram of data divided into 1 sec bins. Red curve is a Poisson curve with rate = median count rate of data. |
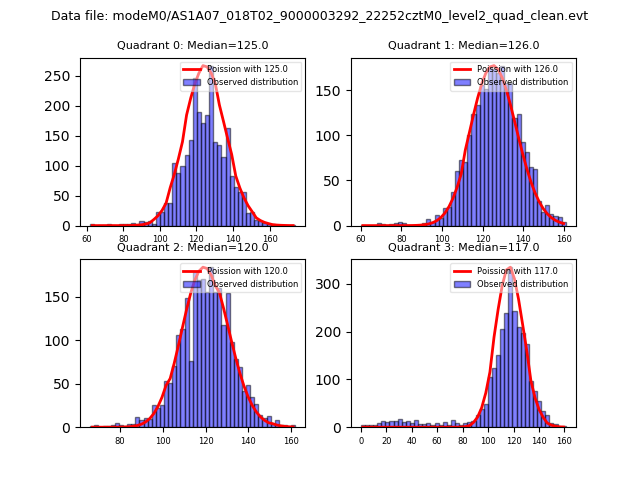 |
 |
| Quadrant-wise count rates Data is divided into 100 sec bins |
 |
|
| Module-wise count rates for Quadrant A Data is divided into 100 sec bins |
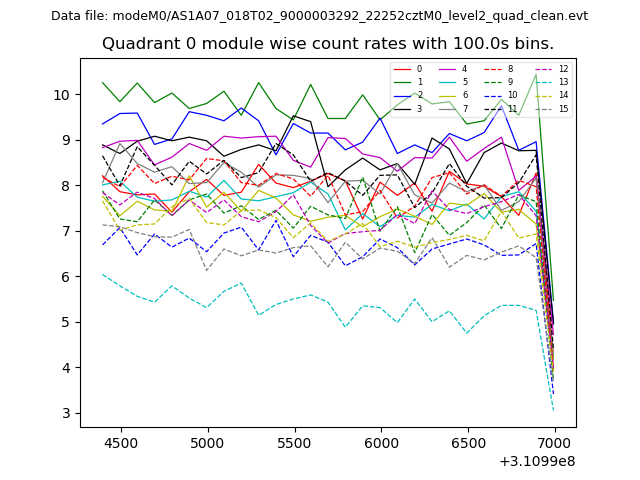 |
 |
| Module-wise count rates for Quadrant B Data is divided into 100 sec bins |
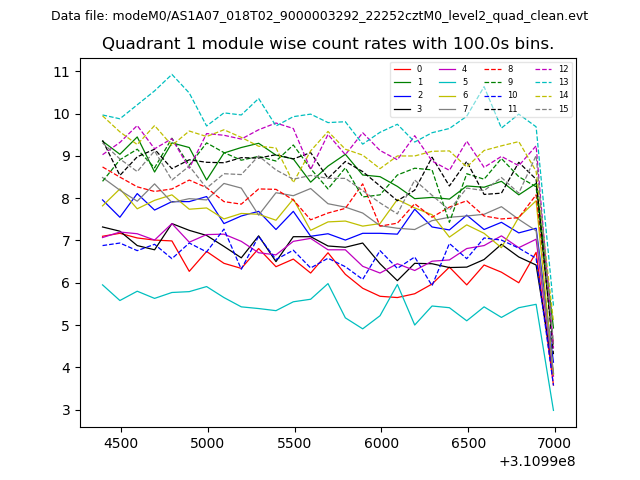 |
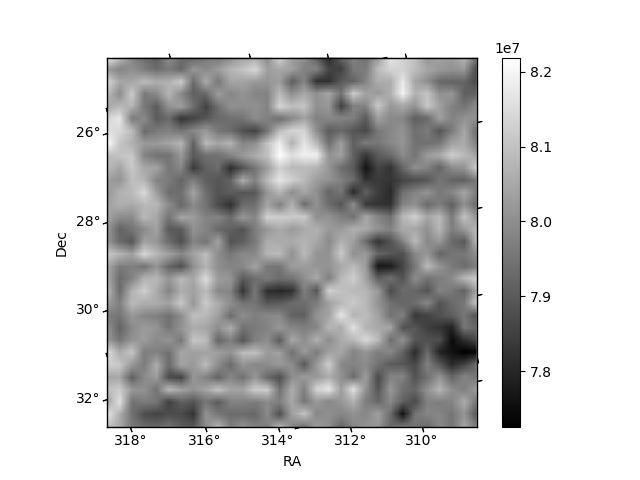 |
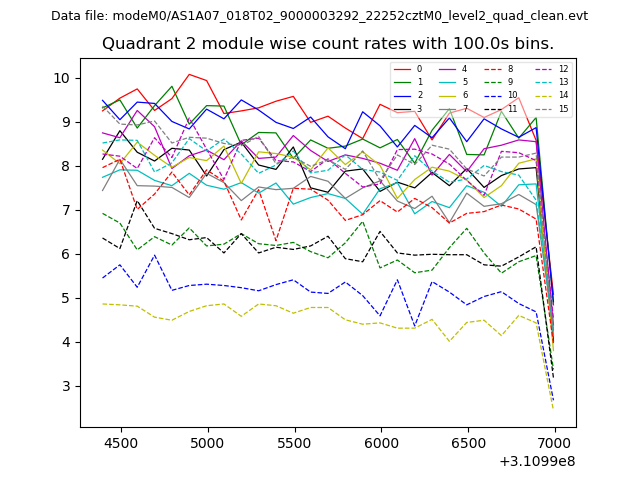
| Module-wise count rates for Quadrant C Data is divided into 100 sec bins |
 |
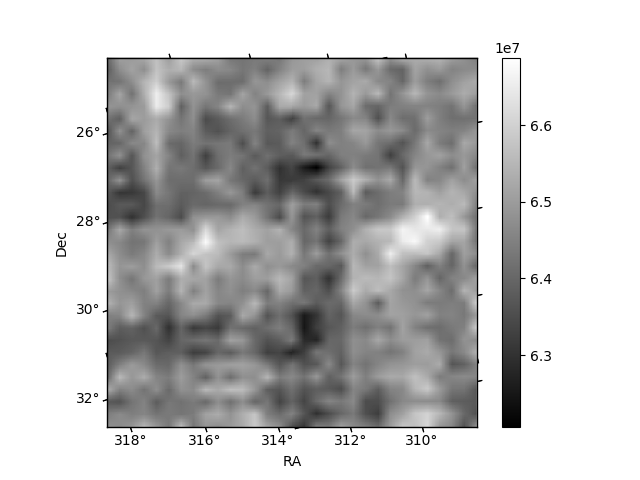 |
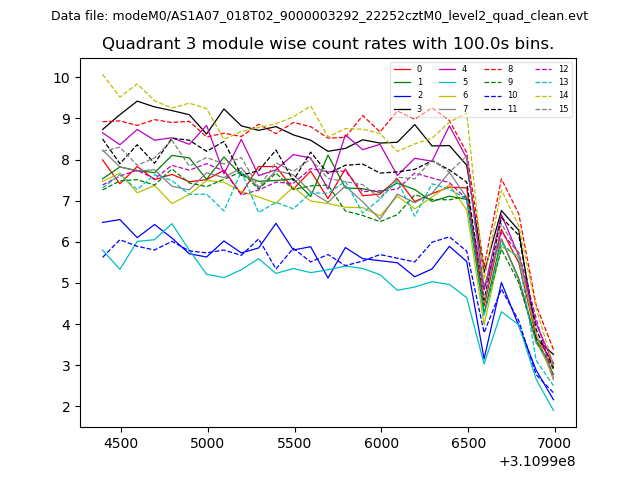
| Module-wise count rates for Quadrant D Data is divided into 100 sec bins |
 |
 |
| Parameter | Plot |
|---|---|
| CZT HV Monitor | 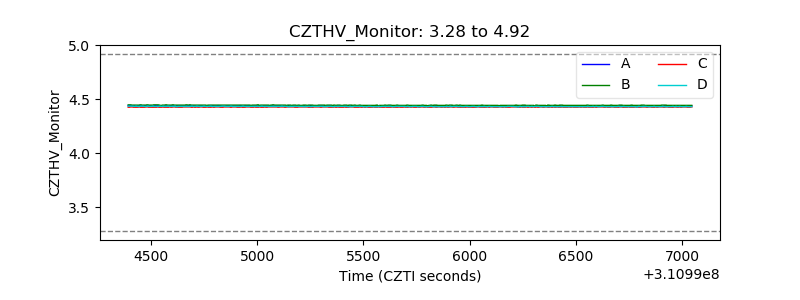 |
| D_VDD | 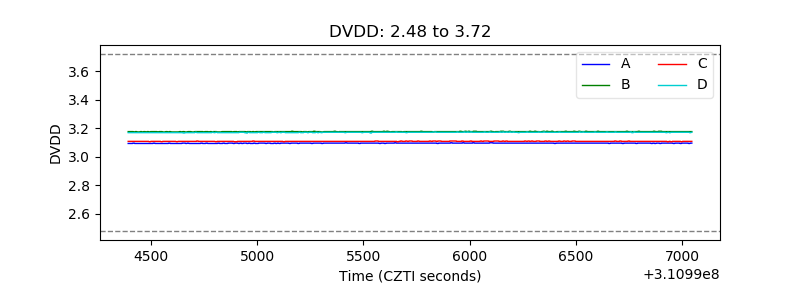 |
| Temperature 1 | 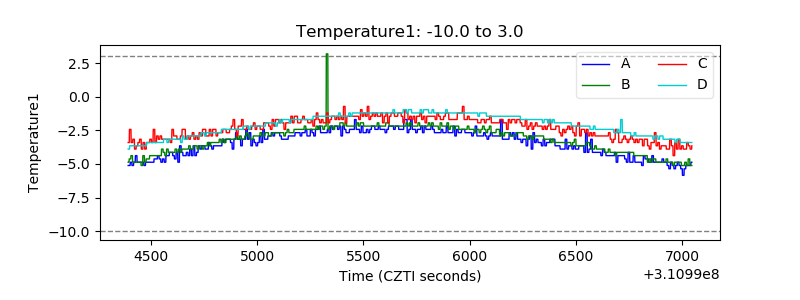 |
| Veto HV Monitor | 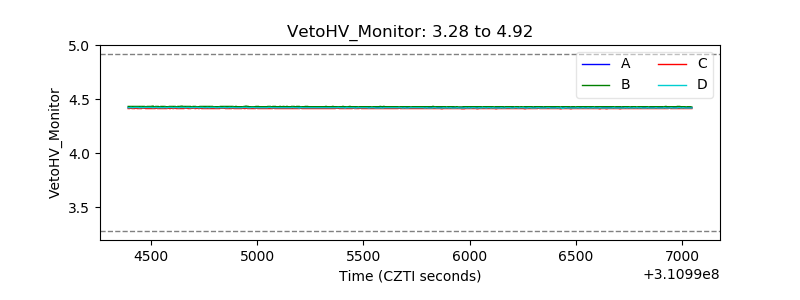 |
| Veto LLD | 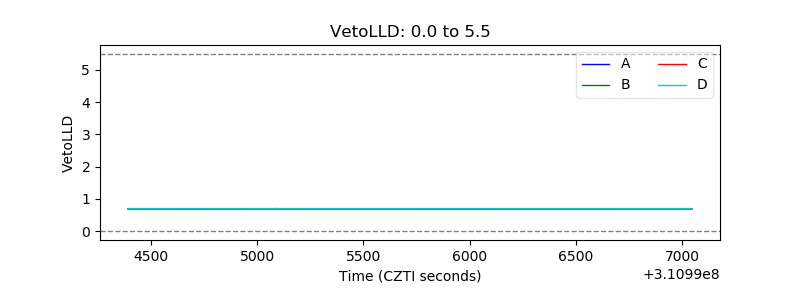 |
| Alpha Counter | 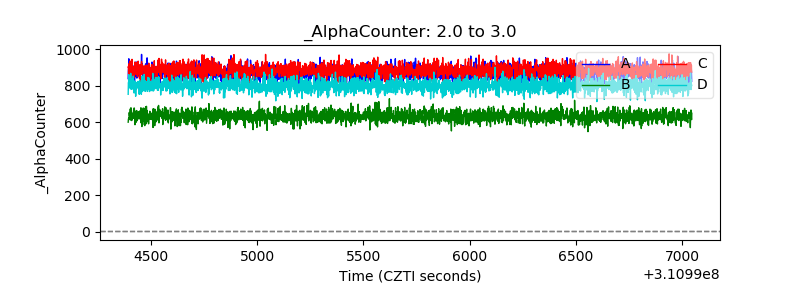 |
| _CPM_Rate | 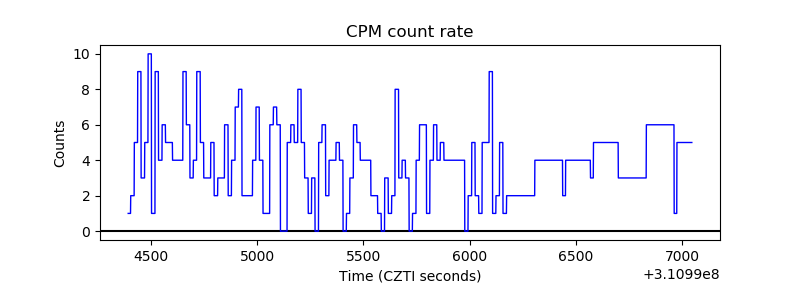 |
| CZT Counter |  |
| +2.5 Volts monitor |  |
| +5 Volts monitor |  |
| _ROLL_ROT | 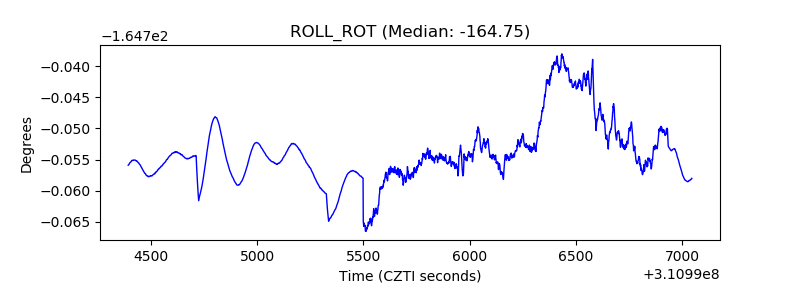 |
| _Roll_DEC | 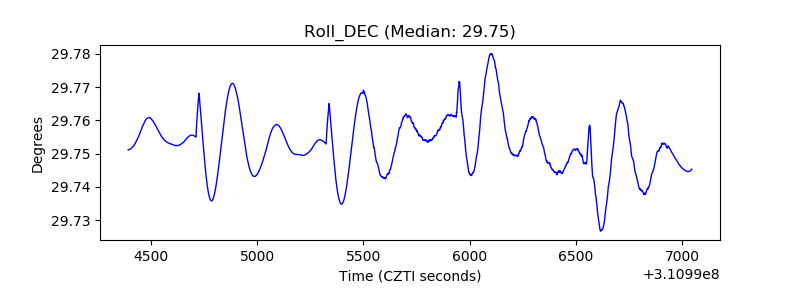 |
| _Roll_RA |  |
| Veto Counter | 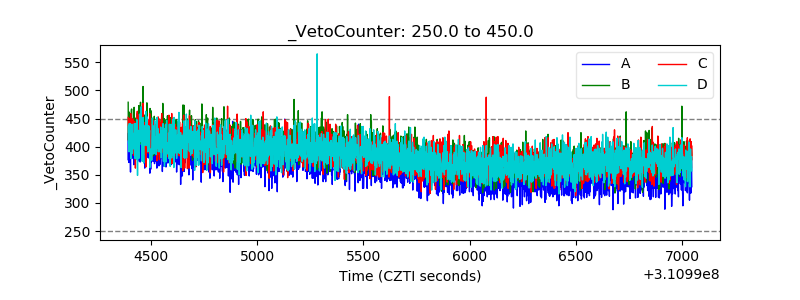 |