| Param | Original file | Final file |
|---|---|---|
| Filename | modeM0/AS1A07_018T07_9000003294cztM0_level2.fits | modeM0/AS1A07_018T07_9000003294cztM0_level2_quad_clean.evt |
| Size (bytes) | 752,544,000 | 659,609,280 |
| Size | 717.7 MB | 629.1 MB |
| Events in quadrant A | 4,733,338 | 3,964,607 |
| Events in quadrant B | 4,550,654 | 3,990,679 |
| Events in quadrant C | 4,529,426 | 3,694,072 |
| Events in quadrant D | 3,800,098 | 3,151,648 |
| Mode M9 | |||
|---|---|---|---|
| Quadrant | BADHDUFLAG | Total packets | Discarded packets |
| A | 0 | 109 | 0 |
| B | 0 | 109 | 0 |
| C | 0 | 109 | 0 |
| D | 0 | 109 | 0 |
| Mode M0 | |||
|---|---|---|---|
| Quadrant | BADHDUFLAG | Total packets | Discarded packets |
| A | 0 | 157329 | 0 |
| B | 0 | 160033 | 0 |
| C | 0 | 164183 | 0 |
| D | 0 | 224747 | 0 |
| Mode SS | |||
|---|---|---|---|
| Quadrant | BADHDUFLAG | Total packets | Discarded packets |
| A | 0 | 1540 | 0 |
| B | 0 | 1540 | 0 |
| C | 0 | 1540 | 0 |
| D | 0 | 1540 | 0 |
| Quadrant | Total seconds | Saturated seconds | Saturation percentage |
|---|---|---|---|
| A | 75446 | 1058 | 1.402327% |
| B | 75444 | 1405 | 1.862308% |
| C | 75446 | 2017 | 2.673435% |
| D | 75447 | 8150 | 10.802285% |
Noise dominated data is calculated using 1-second bins in cleaned event files. If a bin has >2000 counts, and if more than 50% of those come from <1% of pixels, then it is considered to be noise-dominated and hence unusable.
| Quadrant | # 1 sec bins | Bins with >0 counts | Bins with >2000 counts | High rate bins dominated by noise | Noise dominated (total time) | Noise dominated (detector-on time) | Marked lightcurve |
|---|---|---|---|---|---|---|---|
| A | 98707 | 75446 | 0 | 0 | 0.00% | 0.00% |  |
| B | 98707 | 75446 | 0 | 0 | 0.00% | 0.00% |  |
| C | 98707 | 75446 | 0 | 0 | 0.00% | 0.00% |  |
| D | 98707 | 75259 | 0 | 0 | 0.00% | 0.00% |  |
Top three noisy pixels from each quadrant. If the there are fewer than three noisy pixels in the level2.evt file, extra rows are filled as -1
| Pixel properties | Quadrant properties | ||||||
|---|---|---|---|---|---|---|---|
| Quadrant | DetID | PixID | Counts | Sigma | Mean | Median | Sigma |
| A | 0 | 29 | 4532 | 11.17 | 1231 | 1153 | 302.5 |
| A | 7 | 110 | 3742 | 8.56 | 1231 | 1153 | 302.5 |
| A | 9 | 19 | 3548 | 7.92 | 1231 | 1153 | 302.5 |
| B | 2 | 9 | 3639 | 10.62 | 1200 | 1147 | 234.6 |
| B | 2 | 8 | 3064 | 8.17 | 1200 | 1147 | 234.6 |
| B | 5 | 128 | 3004 | 7.92 | 1200 | 1147 | 234.6 |
| C | 12 | 241 | 3175 | 6.72 | 1195 | 1117 | 306.1 |
| C | 3 | 234 | 3070 | 6.38 | 1195 | 1117 | 306.1 |
| C | 12 | 249 | 3052 | 6.32 | 1195 | 1117 | 306.1 |
| D | 3 | 14 | 2813 | 6.32 | 1083 | 984 | 289.4 |
| D | 13 | 238 | 2636 | 5.71 | 1083 | 984 | 289.4 |
| D | 6 | 67 | 2613 | 5.63 | 1083 | 984 | 289.4 |
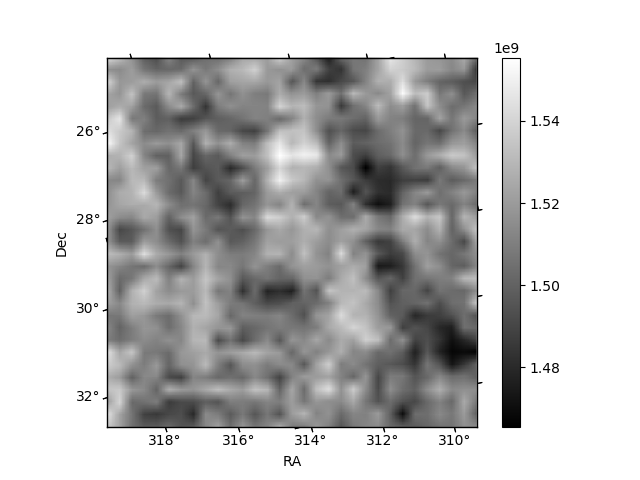
Histogram calculated using DETX and DETY for each event in the final _common_clean file
| Quadrant A |  |
 |
Quadrant B |
|---|---|---|---|
| Quadrant D | 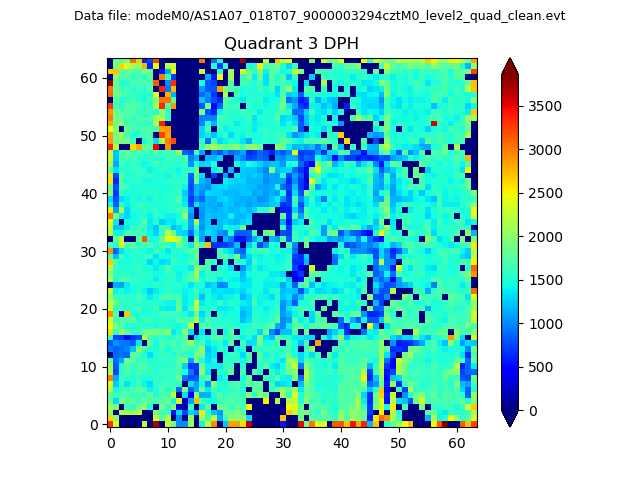 |
 |
Quadrant C |
| Plot type | Count rate plots | Images |
|---|---|---|
| Comparison with Poisson distribution Blue bars denote a histogram of data divided into 1 sec bins. Red curve is a Poisson curve with rate = median count rate of data. |
 |
 |
| Quadrant-wise count rates Data is divided into 100 sec bins |
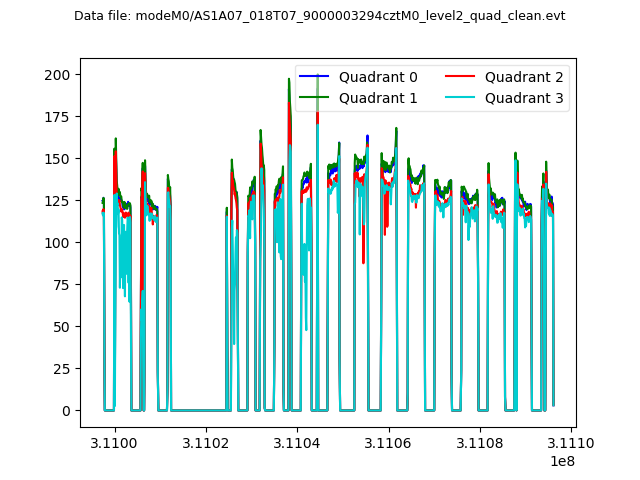 |
|
| Module-wise count rates for Quadrant A Data is divided into 100 sec bins |
 |
 |
| Module-wise count rates for Quadrant B Data is divided into 100 sec bins |
 |
 |
| Module-wise count rates for Quadrant C Data is divided into 100 sec bins |
 |
 |
| Module-wise count rates for Quadrant D Data is divided into 100 sec bins |
 |
 |
| Parameter | Plot |
|---|---|
| CZT HV Monitor |  |
| D_VDD | 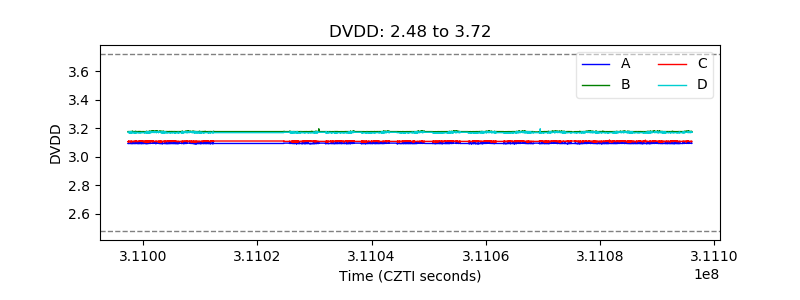 |
| Temperature 1 |  |
| Veto HV Monitor |  |
| Veto LLD | 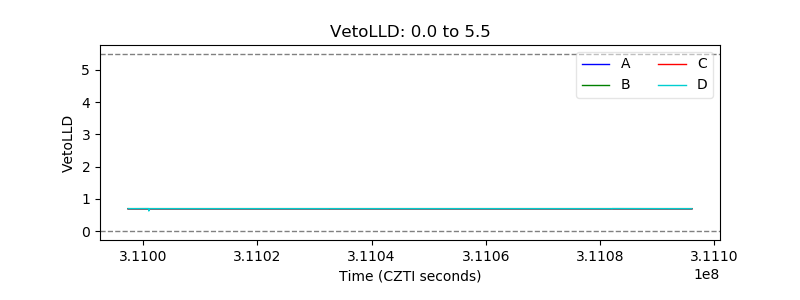 |
| Alpha Counter |  |
| _CPM_Rate |  |
| CZT Counter |  |
| +2.5 Volts monitor |  |
| +5 Volts monitor |  |
| _ROLL_ROT | 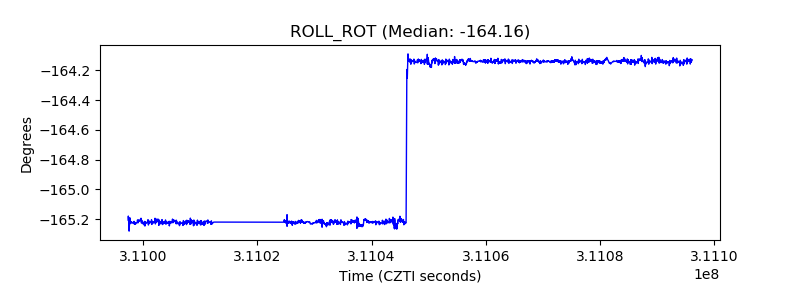 |
| _Roll_DEC | 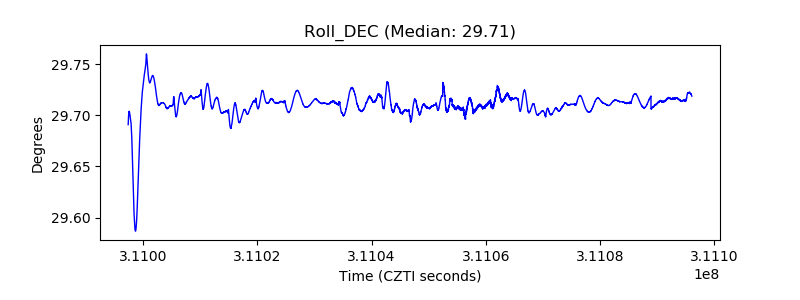 |
| _Roll_RA | 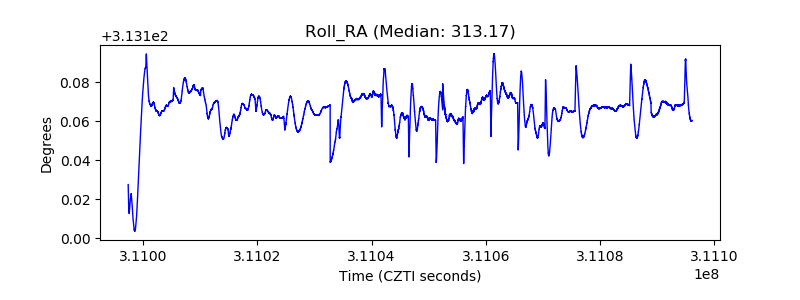 |
| Veto Counter |  |