| Param | Original file | Final file |
|---|---|---|
| Filename | modeM0/AS1A07_018T07_9000003294_22252cztM0_level2.evt | modeM0/AS1A07_018T07_9000003294_22252cztM0_level2_quad_clean.evt |
| Size (bytes) | 399,277,440 | 45,190,080 |
| Size | 380.8 MB | 43.1 MB |
| Events in quadrant A | 2,175,282 | 277,417 |
| Events in quadrant B | 2,225,170 | 284,285 |
| Events in quadrant C | 2,279,676 | 269,017 |
| Events in quadrant D | 5,118,125 | 233,221 |
| Mode M9 | |||
|---|---|---|---|
| Quadrant | BADHDUFLAG | Total packets | Discarded packets |
| A | 0 | 1 | 0 |
| B | 0 | 1 | 0 |
| C | 0 | 1 | 0 |
| D | 0 | 1 | 0 |
| Mode M0 | |||
|---|---|---|---|
| Quadrant | BADHDUFLAG | Total packets | Discarded packets |
| A | 0 | 9195 | 1 |
| B | 0 | 9255 | 1 |
| C | 0 | 9465 | 1 |
| D | 0 | 18130 | 1 |
| Mode SS | |||
|---|---|---|---|
| Quadrant | BADHDUFLAG | Total packets | Discarded packets |
| A | 0 | 90 | 0 |
| B | 0 | 90 | 0 |
| C | 0 | 90 | 0 |
| D | 0 | 90 | 0 |
| Quadrant | Total seconds | Saturated seconds | Saturation percentage |
|---|---|---|---|
| A | 4306 | 145 | 3.367394% |
| B | 4305 | 184 | 4.274100% |
| C | 4305 | 177 | 4.111498% |
| D | 4305 | 1152 | 26.759582% |
Noise dominated data is calculated using 1-second bins in cleaned event files. If a bin has >2000 counts, and if more than 50% of those come from <1% of pixels, then it is considered to be noise-dominated and hence unusable.
| Quadrant | # 1 sec bins | Bins with >0 counts | Bins with >2000 counts | High rate bins dominated by noise | Noise dominated (total time) | Noise dominated (detector-on time) | Marked lightcurve |
|---|---|---|---|---|---|---|---|
| A | 4416 | 4307 | 0 | 0 | 0.00% | 0.00% | 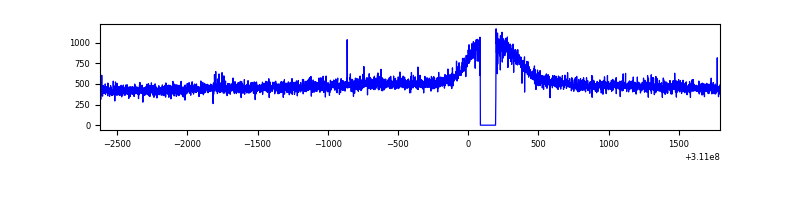 |
| B | 4415 | 4306 | 8 | 8 | 0.18% | 0.19% | 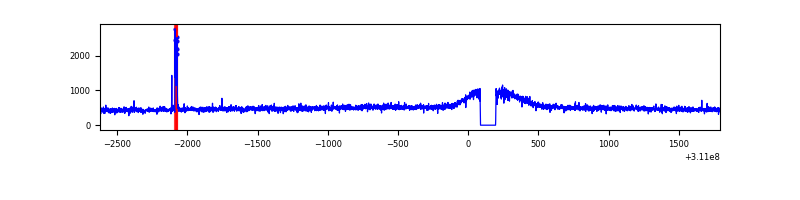 |
| C | 4415 | 4306 | 11 | 11 | 0.25% | 0.26% | 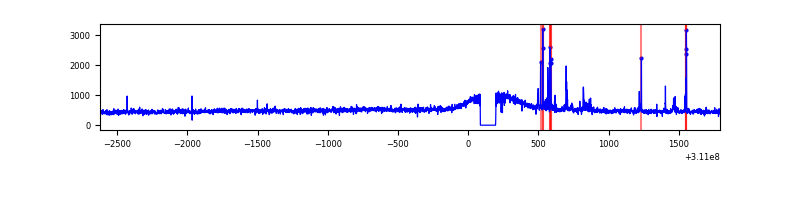 |
| D | 4415 | 4306 | 838 | 838 | 18.98% | 19.46% | 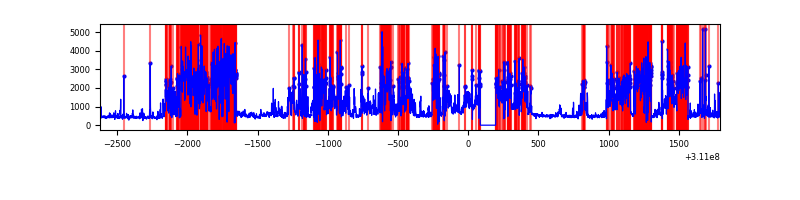 |
Top three noisy pixels from each quadrant. If the there are fewer than three noisy pixels in the level2.evt file, extra rows are filled as -1
| Pixel properties | Quadrant properties | ||||||
|---|---|---|---|---|---|---|---|
| Quadrant | DetID | PixID | Counts | Sigma | Mean | Median | Sigma |
| A | 13 | 254 | 6532 | 51.13 | 564 | 552 | 116.9 |
| A | 3 | 137 | 5161 | 39.41 | 564 | 552 | 116.9 |
| A | 0 | 226 | 4850 | 36.75 | 564 | 552 | 116.9 |
| B | 4 | 173 | 30767 | 273.64 | 559 | 543 | 110.5 |
| B | 12 | 111 | 14184 | 123.5 | 559 | 543 | 110.5 |
| B | 11 | 111 | 12555 | 108.75 | 559 | 543 | 110.5 |
| C | 10 | 22 | 97365 | 745.44 | 539 | 541 | 129.9 |
| C | 14 | 238 | 82848 | 633.67 | 539 | 541 | 129.9 |
| C | 13 | 61 | 3799 | 25.08 | 539 | 541 | 129.9 |
| D | 1 | 52 | 3251903 | 27097.41 | 481 | 465 | 120.0 |
| D | 13 | 104 | 25608 | 209.54 | 481 | 465 | 120.0 |
| D | 2 | 234 | 17277 | 140.11 | 481 | 465 | 120.0 |
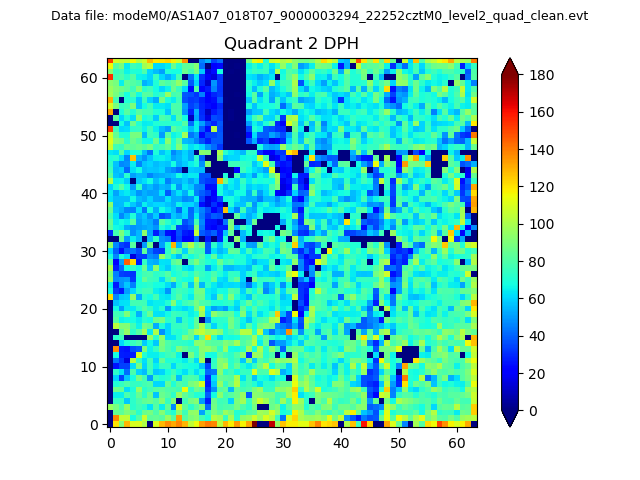
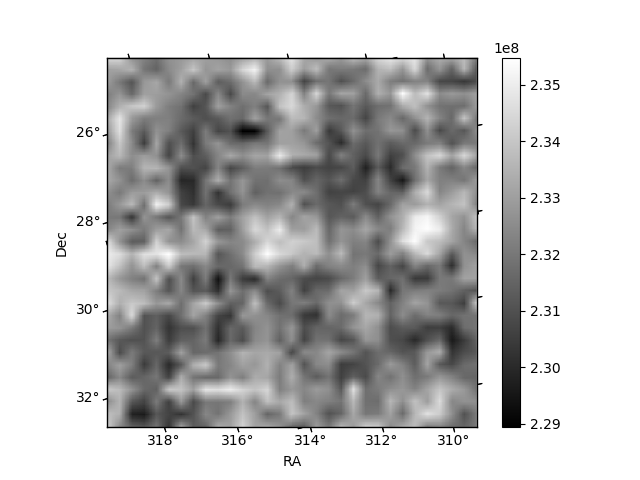
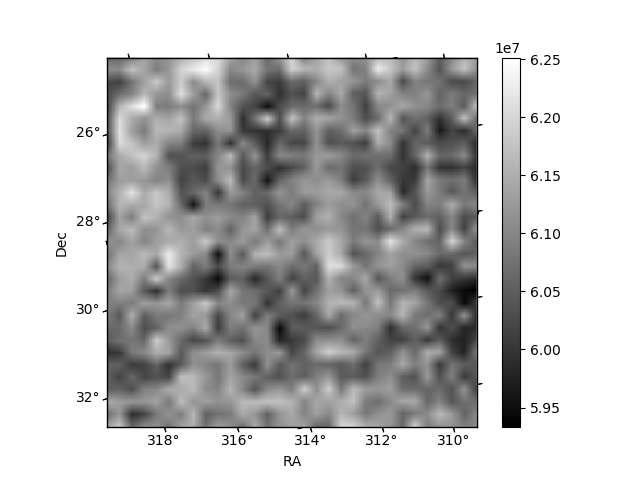
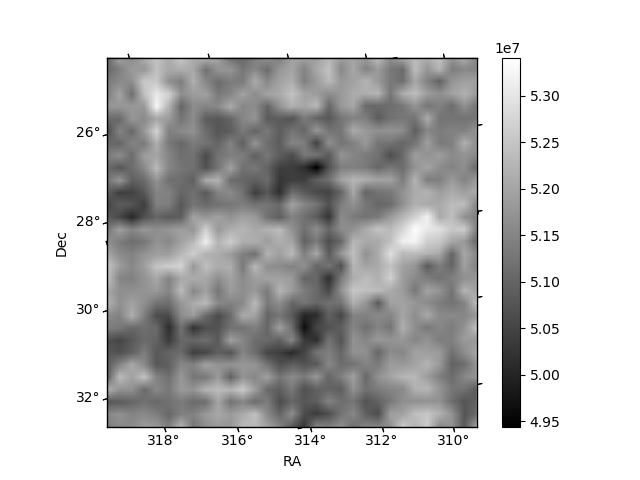
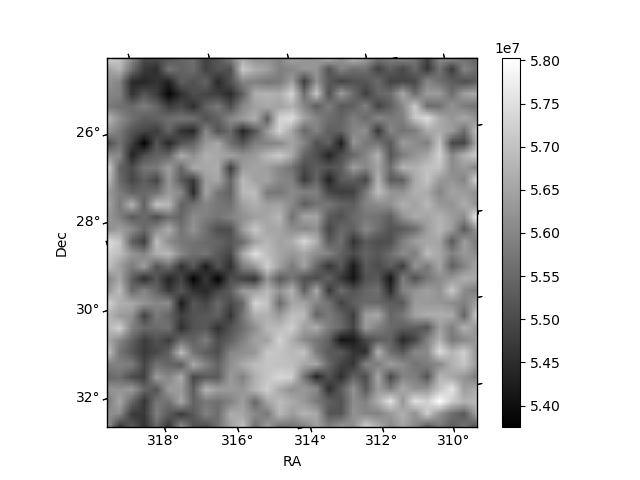
Histogram calculated using DETX and DETY for each event in the final _common_clean file
| Quadrant A | 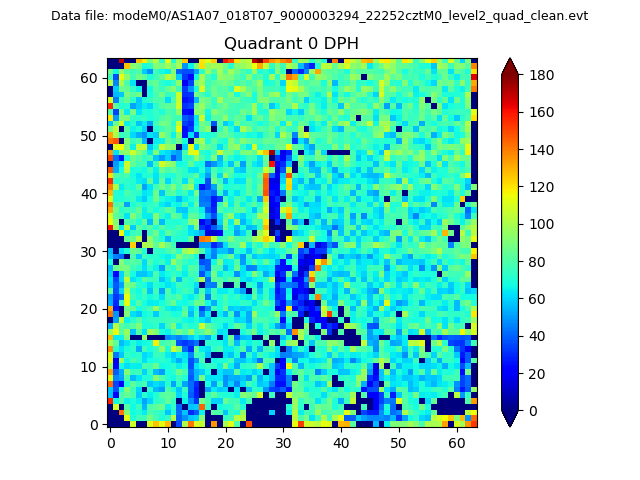 |
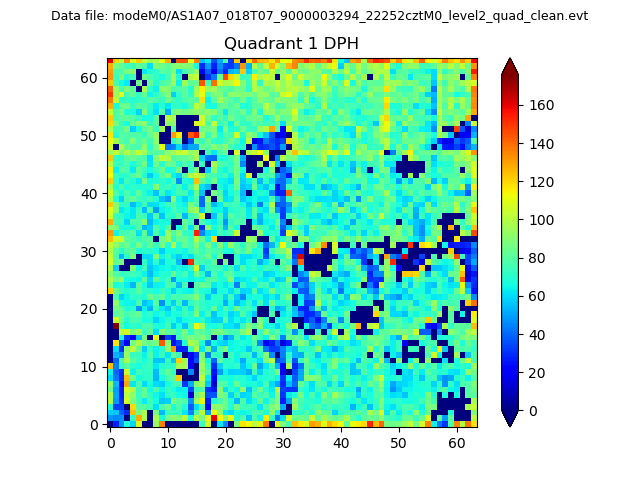 |
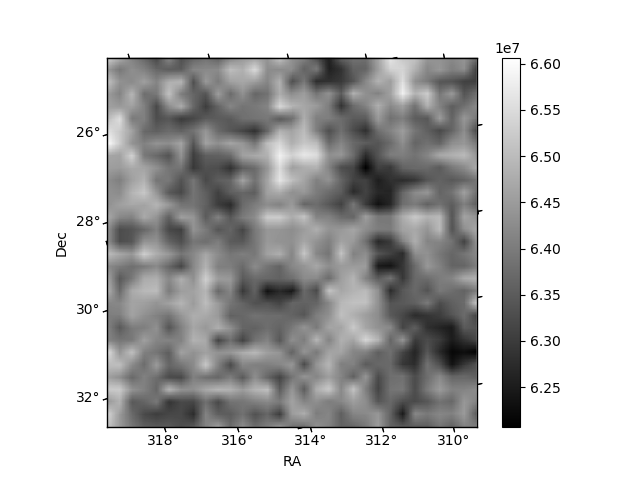
Quadrant B |
|---|---|---|---|
| Quadrant D | 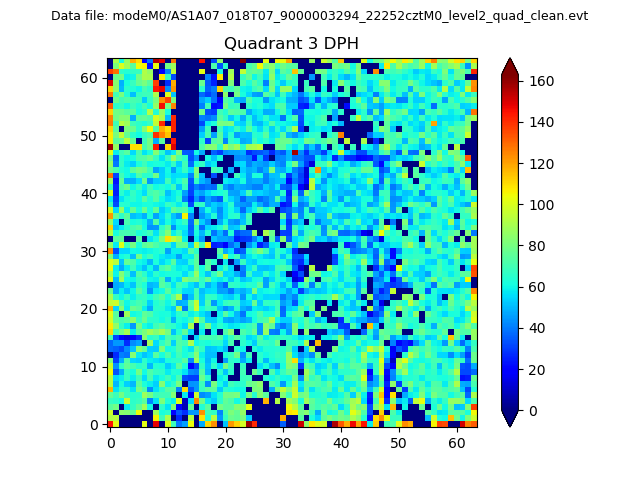 |
 |
Quadrant C |
| Plot type | Count rate plots | Images |
|---|---|---|
| Comparison with Poisson distribution Blue bars denote a histogram of data divided into 1 sec bins. Red curve is a Poisson curve with rate = median count rate of data. |
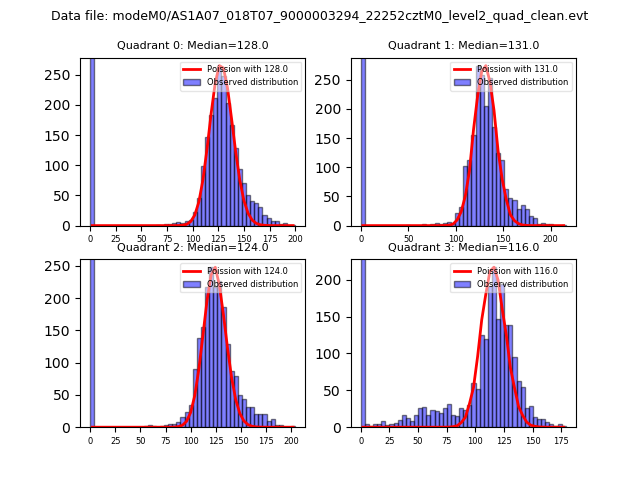 |
 |
| Quadrant-wise count rates Data is divided into 100 sec bins |
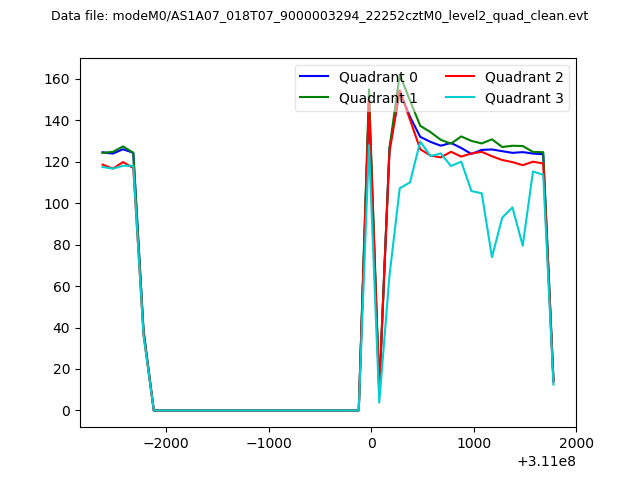 |
|
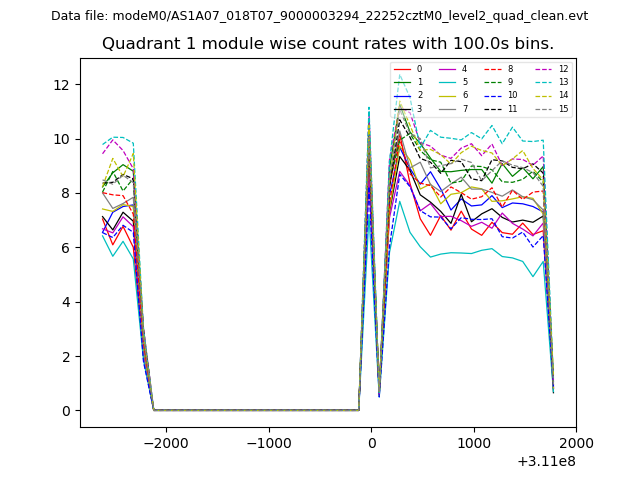
| Module-wise count rates for Quadrant A Data is divided into 100 sec bins |
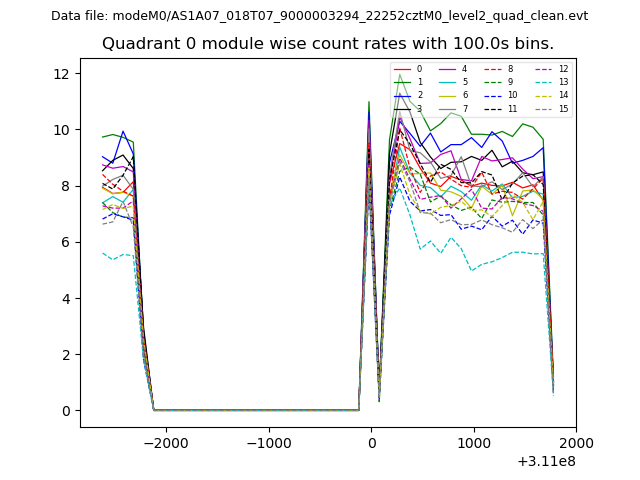 |
 |
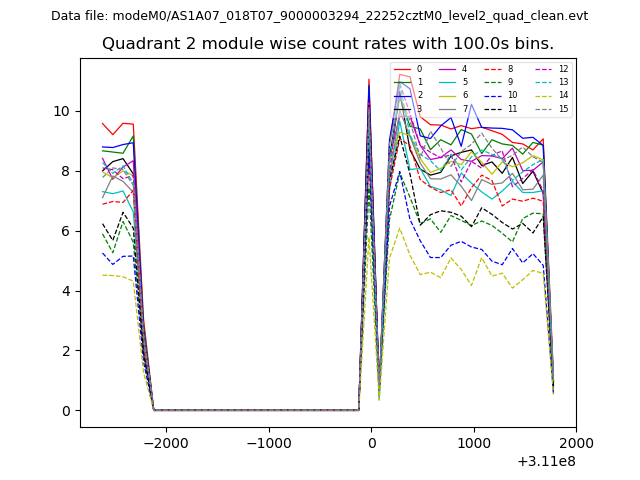
| Module-wise count rates for Quadrant B Data is divided into 100 sec bins |
 |
 |
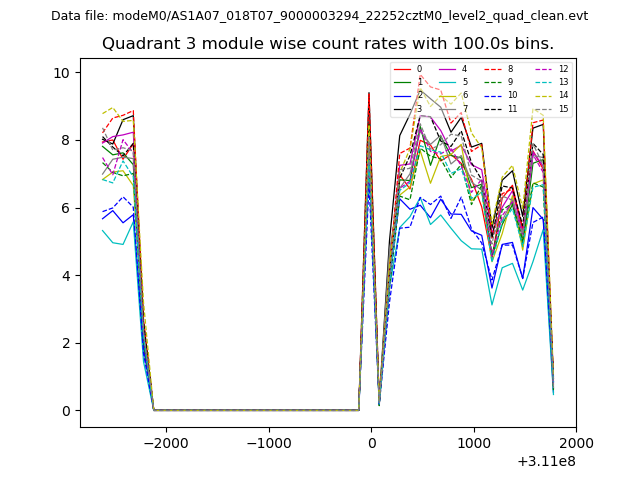
| Module-wise count rates for Quadrant C Data is divided into 100 sec bins |
 |
 |
| Module-wise count rates for Quadrant D Data is divided into 100 sec bins |
 |
 |
| Parameter | Plot |
|---|---|
| CZT HV Monitor | 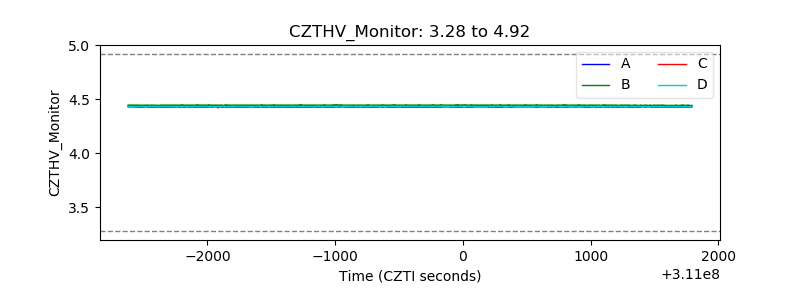 |
| D_VDD | 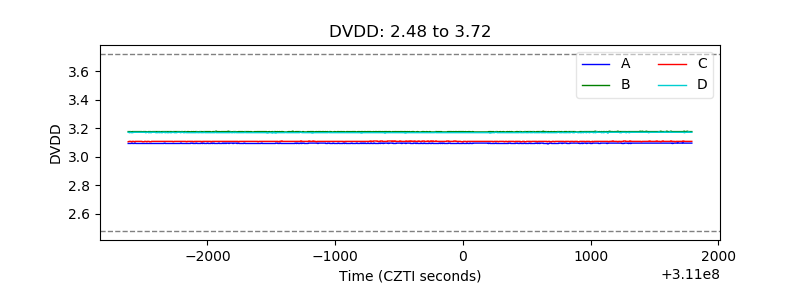 |
| Temperature 1 | 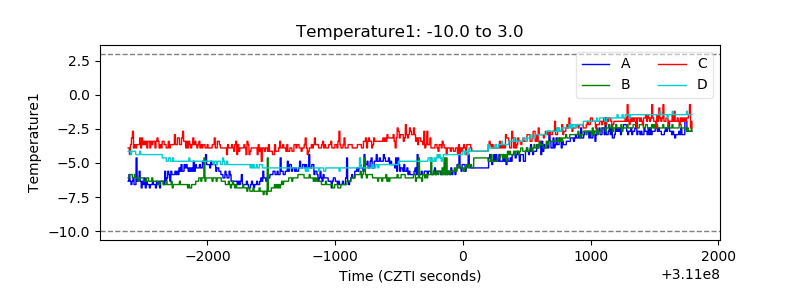 |
| Veto HV Monitor | 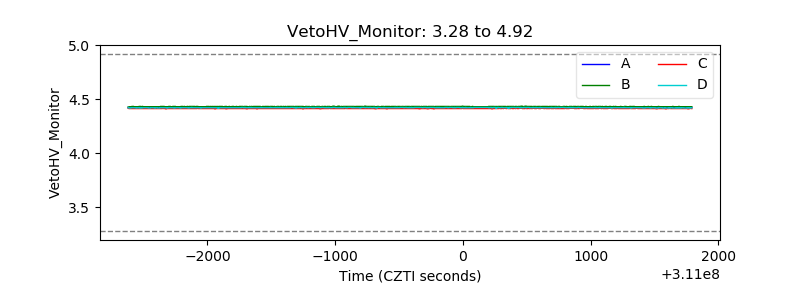 |
| Veto LLD | 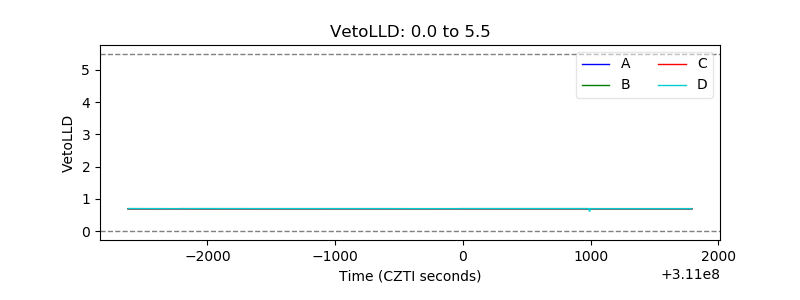 |
| Alpha Counter | 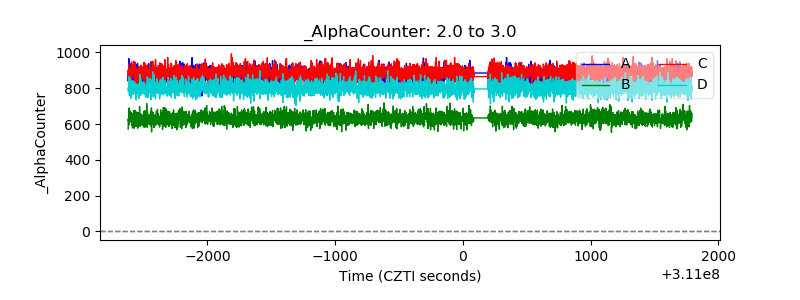 |
| _CPM_Rate | 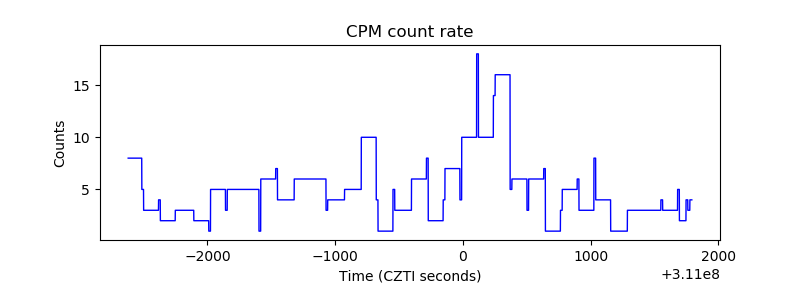 |
| CZT Counter | 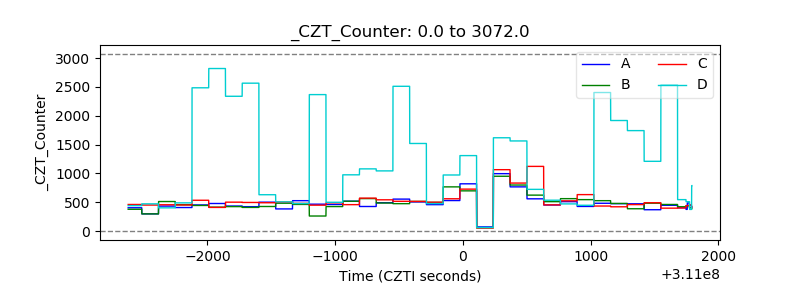 |
| +2.5 Volts monitor |  |
| +5 Volts monitor |  |
| _ROLL_ROT | 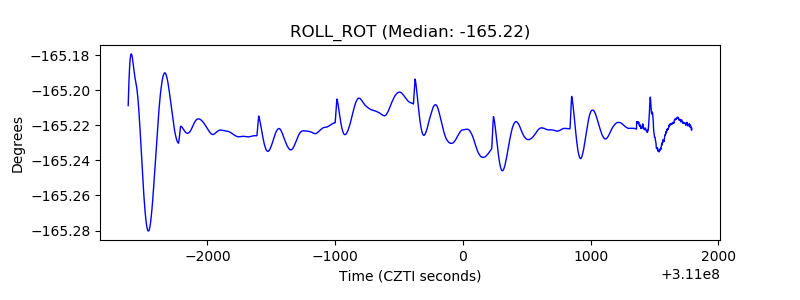 |
| _Roll_DEC | 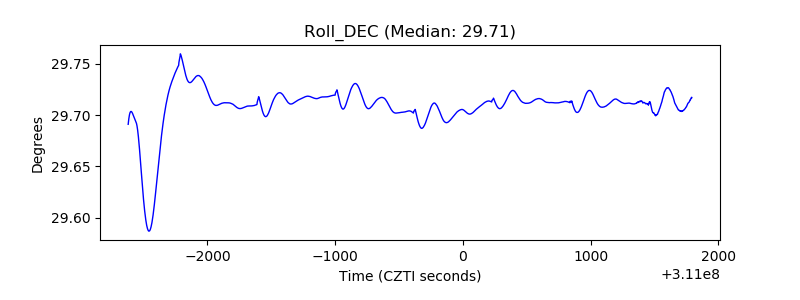 |
| _Roll_RA | 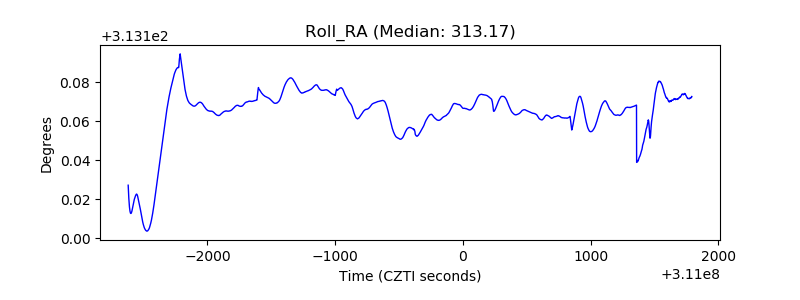 |
| Veto Counter | 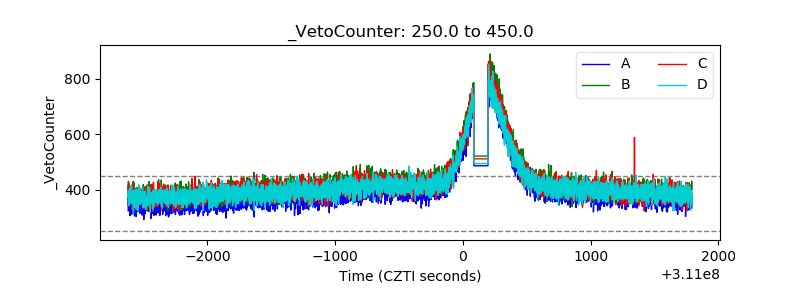 |