| Param | Original file | Final file |
|---|---|---|
| Filename | modeM0/AS1A07_018T07_9000003294_22253cztM0_level2.evt | modeM0/AS1A07_018T07_9000003294_22253cztM0_level2_quad_clean.evt |
| Size (bytes) | 619,326,720 | 92,335,680 |
| Size | 590.6 MB | 88.1 MB |
| Events in quadrant A | 3,282,666 | 609,185 |
| Events in quadrant B | 3,314,646 | 618,387 |
| Events in quadrant C | 3,889,537 | 589,034 |
| Events in quadrant D | 7,792,394 | 489,046 |
| Mode M9 | |||
|---|---|---|---|
| Quadrant | BADHDUFLAG | Total packets | Discarded packets |
| A | 0 | 3 | 0 |
| B | 0 | 3 | 0 |
| C | 0 | 3 | 0 |
| D | 0 | 3 | 0 |
| Mode M0 | |||
|---|---|---|---|
| Quadrant | BADHDUFLAG | Total packets | Discarded packets |
| A | 0 | 14458 | 1 |
| B | 0 | 14475 | 2 |
| C | 0 | 16227 | 1 |
| D | 0 | 27895 | 1 |
| Mode SS | |||
|---|---|---|---|
| Quadrant | BADHDUFLAG | Total packets | Discarded packets |
| A | 0 | 142 | 0 |
| B | 0 | 142 | 0 |
| C | 0 | 142 | 0 |
| D | 0 | 142 | 0 |
| Quadrant | Total seconds | Saturated seconds | Saturation percentage |
|---|---|---|---|
| A | 7037 | 67 | 0.952110% |
| B | 7037 | 84 | 1.193690% |
| C | 7037 | 270 | 3.836862% |
| D | 7037 | 1780 | 25.294870% |
Noise dominated data is calculated using 1-second bins in cleaned event files. If a bin has >2000 counts, and if more than 50% of those come from <1% of pixels, then it is considered to be noise-dominated and hence unusable.
| Quadrant | # 1 sec bins | Bins with >0 counts | Bins with >2000 counts | High rate bins dominated by noise | Noise dominated (total time) | Noise dominated (detector-on time) | Marked lightcurve |
|---|---|---|---|---|---|---|---|
| A | 7372 | 7038 | 0 | 0 | 0.00% | 0.00% | 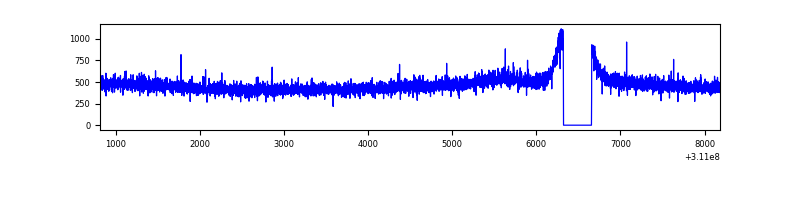 |
| B | 7372 | 7038 | 0 | 0 | 0.00% | 0.00% | 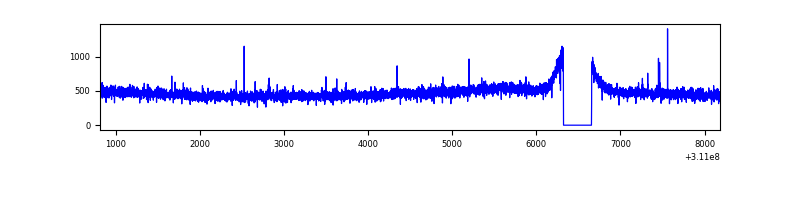 |
| C | 7372 | 7038 | 158 | 158 | 2.14% | 2.24% | 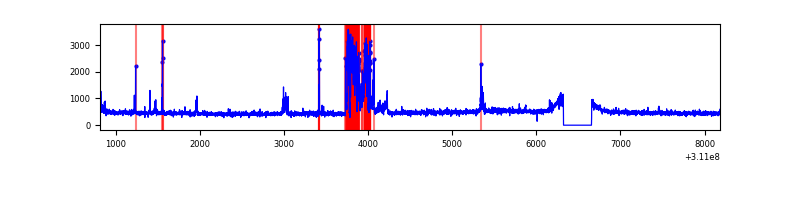 |
| D | 7372 | 7038 | 1459 | 1459 | 19.79% | 20.73% | 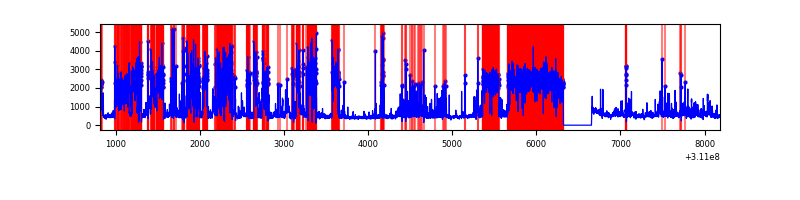 |
Top three noisy pixels from each quadrant. If the there are fewer than three noisy pixels in the level2.evt file, extra rows are filled as -1
| Pixel properties | Quadrant properties | ||||||
|---|---|---|---|---|---|---|---|
| Quadrant | DetID | PixID | Counts | Sigma | Mean | Median | Sigma |
| A | 13 | 254 | 10795 | 57.63 | 851 | 833 | 172.9 |
| A | 3 | 137 | 7507 | 38.61 | 851 | 833 | 172.9 |
| A | 0 | 226 | 7258 | 37.17 | 851 | 833 | 172.9 |
| B | 12 | 111 | 20365 | 119.52 | 843 | 822 | 163.5 |
| B | 11 | 111 | 17932 | 104.64 | 843 | 822 | 163.5 |
| B | 14 | 111 | 15582 | 90.27 | 843 | 822 | 163.5 |
| C | 10 | 22 | 624122 | 3300.77 | 804 | 808 | 188.8 |
| C | 14 | 238 | 125950 | 662.69 | 804 | 808 | 188.8 |
| C | 13 | 61 | 5801 | 26.44 | 804 | 808 | 188.8 |
| D | 1 | 52 | 3314625 | 18789.65 | 730 | 712 | 176.4 |
| D | 12 | 235 | 1590423 | 9013.55 | 730 | 712 | 176.4 |
| D | 13 | 172 | 34798 | 193.27 | 730 | 712 | 176.4 |
Histogram calculated using DETX and DETY for each event in the final _common_clean file
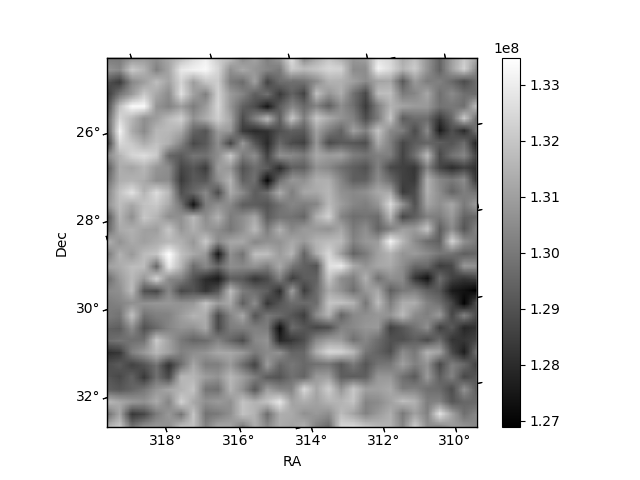
| Quadrant A |  |
 |
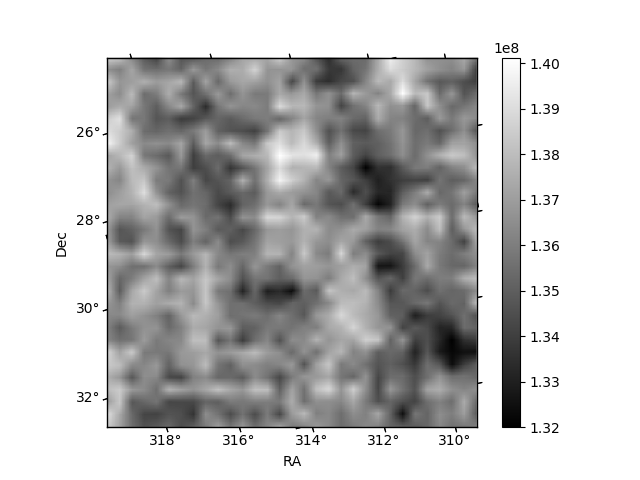
Quadrant B |
|---|---|---|---|
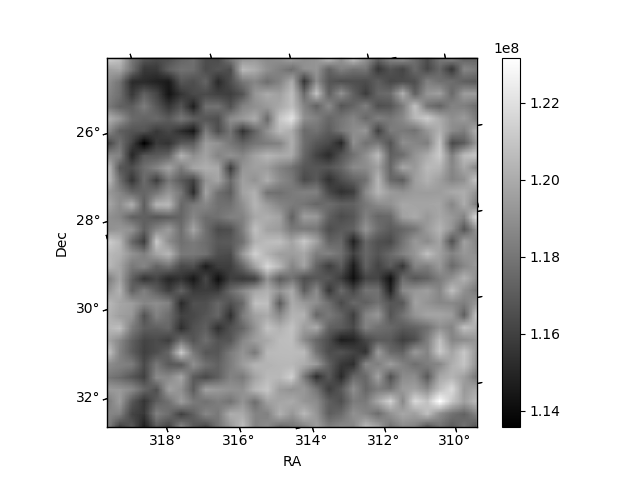
| Quadrant D |  |
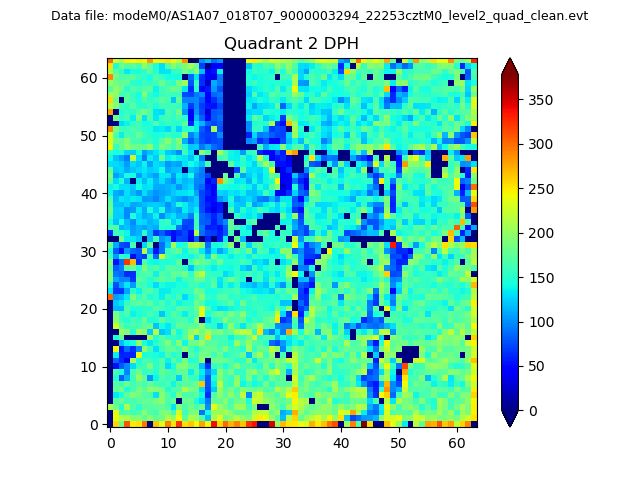 |
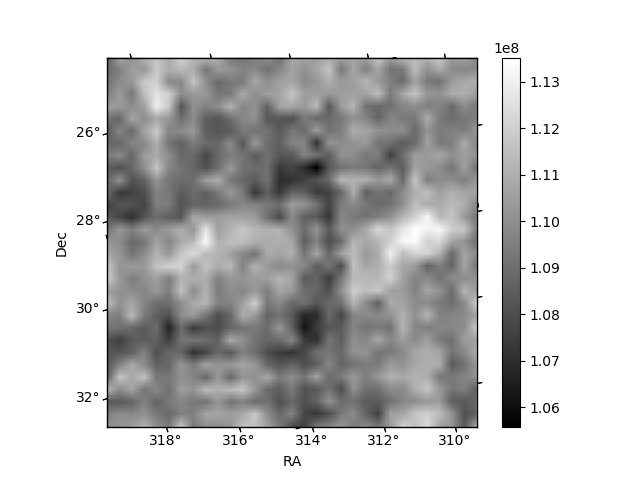
Quadrant C |
| Plot type | Count rate plots | Images |
|---|---|---|
| Comparison with Poisson distribution Blue bars denote a histogram of data divided into 1 sec bins. Red curve is a Poisson curve with rate = median count rate of data. |
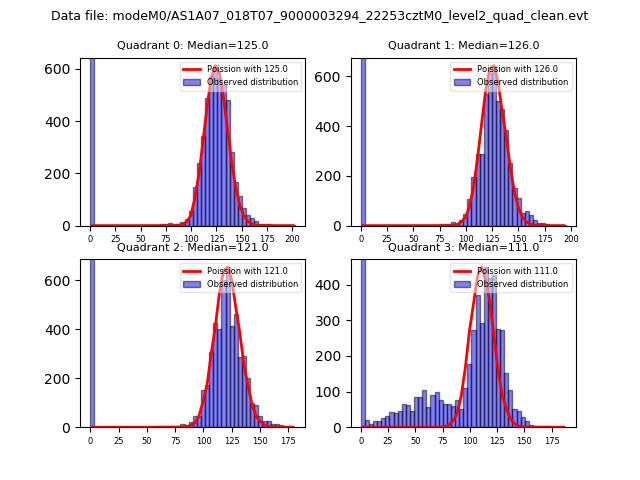 |
 |
| Quadrant-wise count rates Data is divided into 100 sec bins |
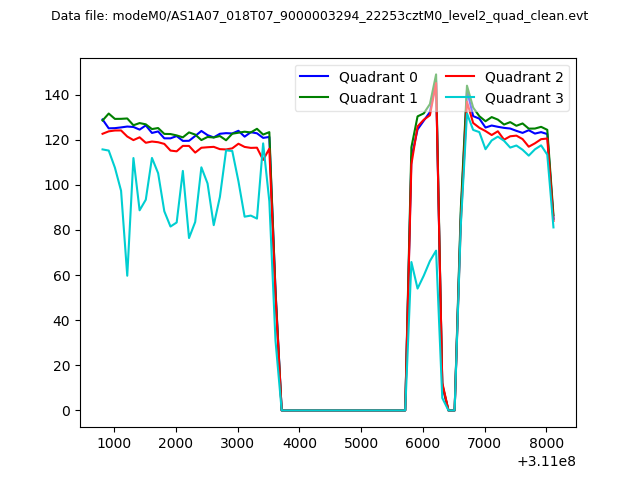 |
|
| Module-wise count rates for Quadrant A Data is divided into 100 sec bins |
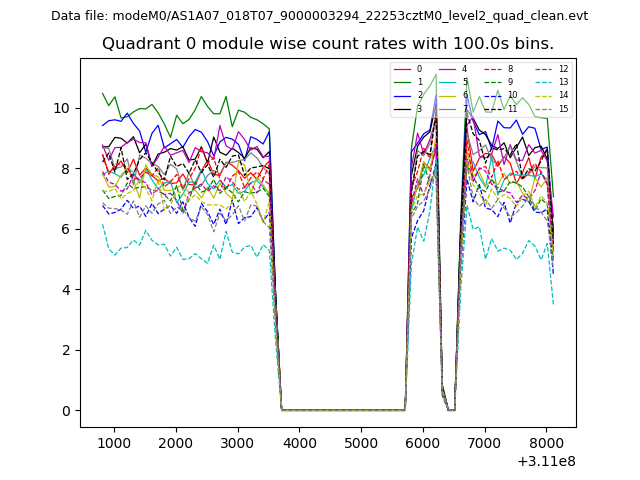 |
 |
| Module-wise count rates for Quadrant B Data is divided into 100 sec bins |
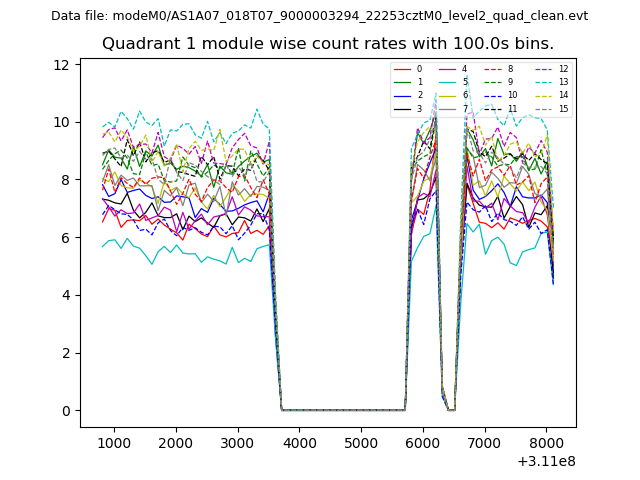 |
 |
| Module-wise count rates for Quadrant C Data is divided into 100 sec bins |
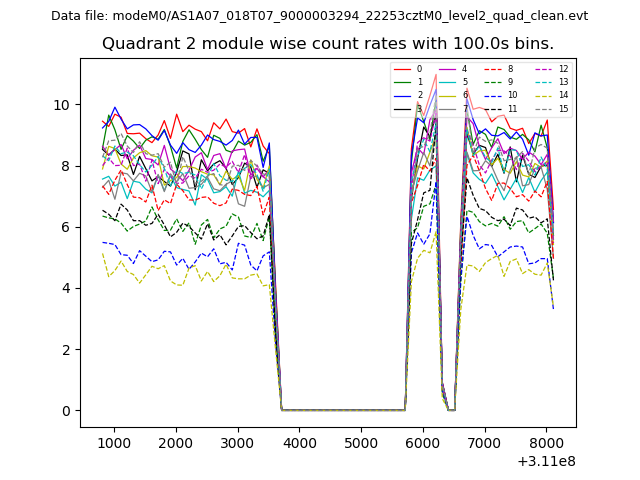 |
 |
| Module-wise count rates for Quadrant D Data is divided into 100 sec bins |
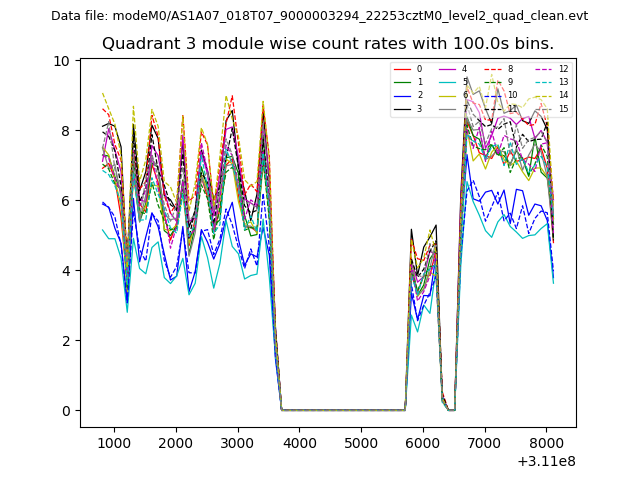 |
 |
| Parameter | Plot |
|---|---|
| CZT HV Monitor | 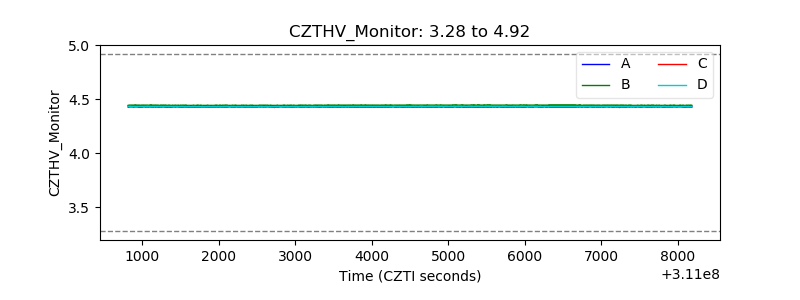 |
| D_VDD | 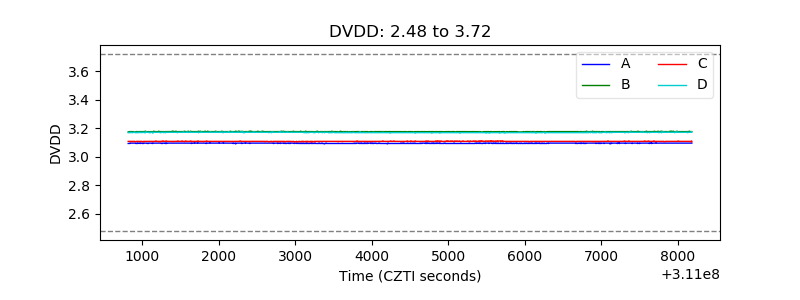 |
| Temperature 1 | 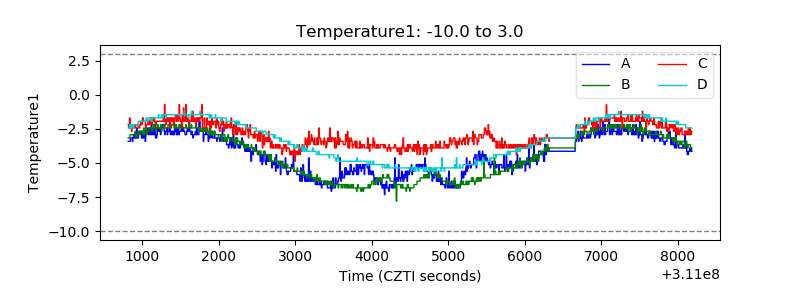 |
| Veto HV Monitor | 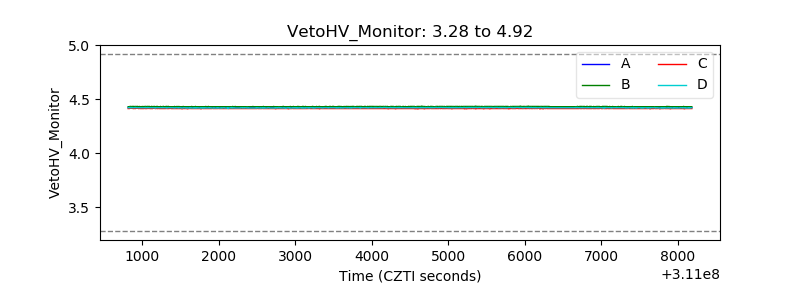 |
| Veto LLD | 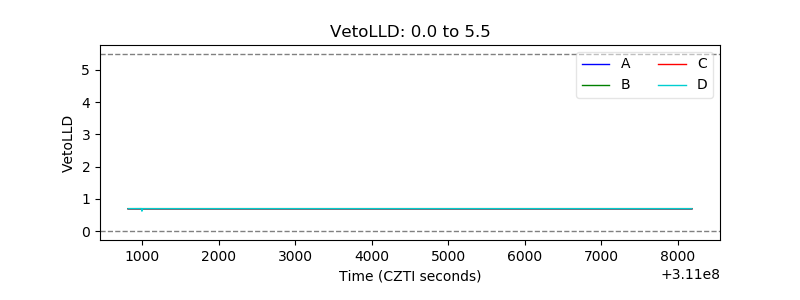 |
| Alpha Counter | 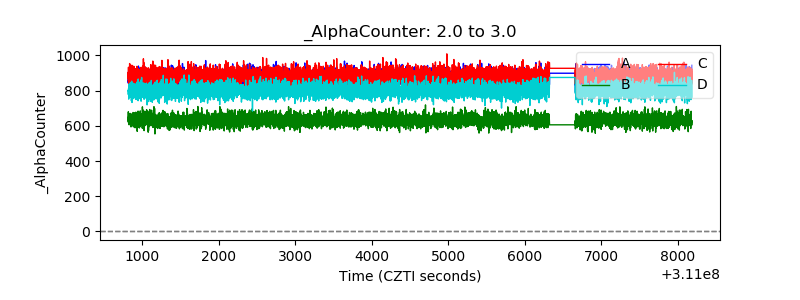 |
| _CPM_Rate | 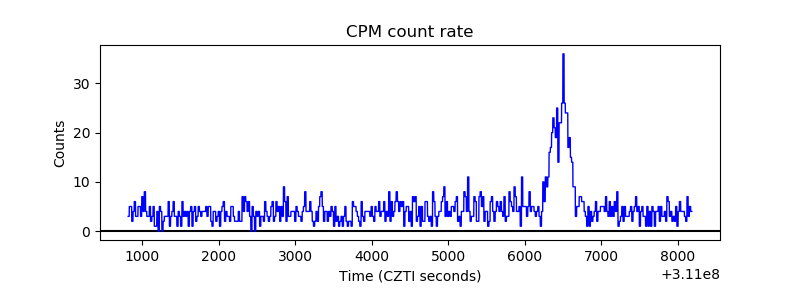 |
| CZT Counter | 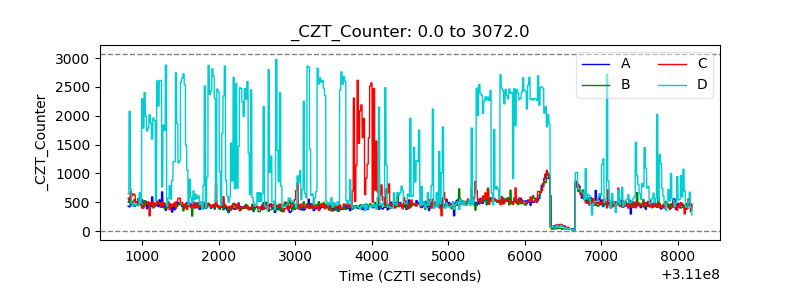 |
| +2.5 Volts monitor |  |
| +5 Volts monitor | 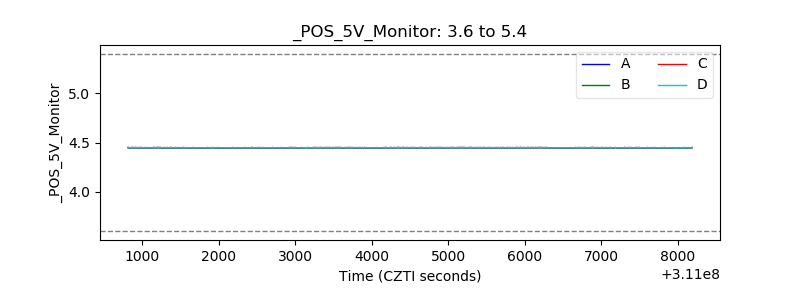 |
| _ROLL_ROT | 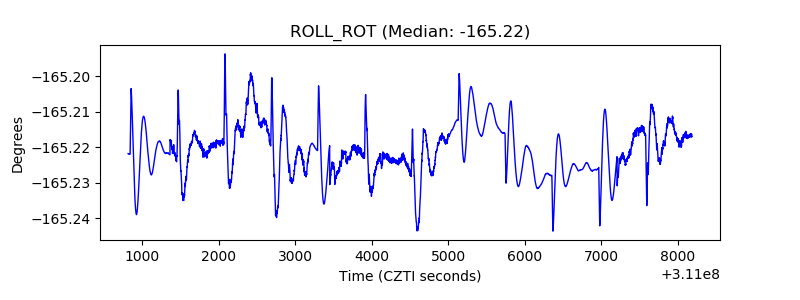 |
| _Roll_DEC | 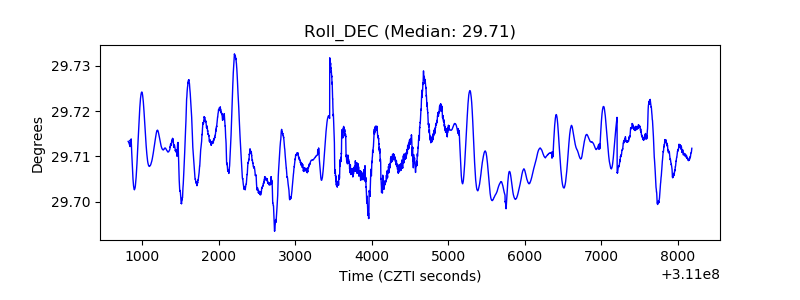 |
| _Roll_RA | 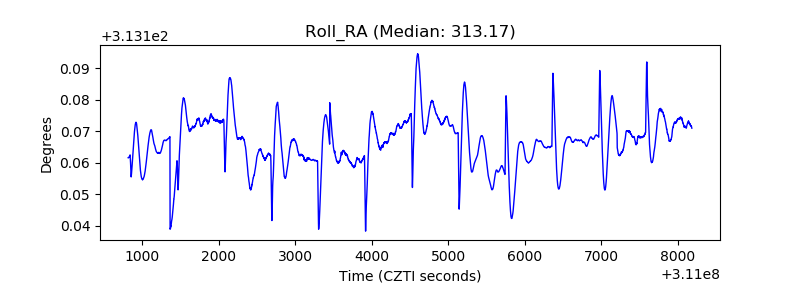 |
| Veto Counter | 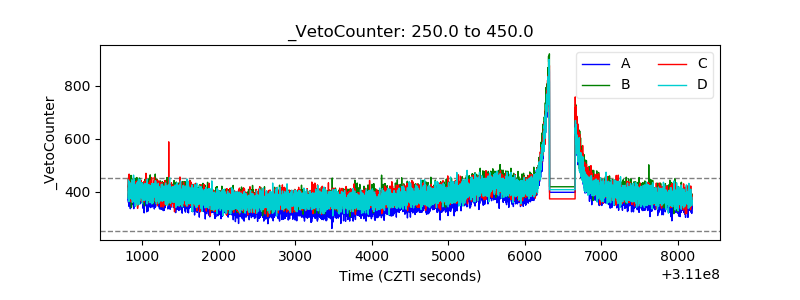 |