| Param | Original file | Final file |
|---|---|---|
| Filename | modeM0/AS1A07_018T07_9000003294_22257cztM0_level2.evt | modeM0/AS1A07_018T07_9000003294_22257cztM0_level2_quad_clean.evt |
| Size (bytes) | 547,678,080 | 86,728,320 |
| Size | 522.3 MB | 82.7 MB |
| Events in quadrant A | 3,163,745 | 565,876 |
| Events in quadrant B | 3,257,648 | 581,105 |
| Events in quadrant C | 3,270,243 | 549,921 |
| Events in quadrant D | 6,438,731 | 460,755 |
| Mode M9 | |||
|---|---|---|---|
| Quadrant | BADHDUFLAG | Total packets | Discarded packets |
| A | 0 | 20 | 0 |
| B | 0 | 20 | 0 |
| C | 0 | 20 | 0 |
| D | 0 | 20 | 0 |
| Mode M0 | |||
|---|---|---|---|
| Quadrant | BADHDUFLAG | Total packets | Discarded packets |
| A | 0 | 13732 | 2 |
| B | 0 | 13855 | 2 |
| C | 0 | 13927 | 2 |
| D | 0 | 23723 | 2 |
| Mode SS | |||
|---|---|---|---|
| Quadrant | BADHDUFLAG | Total packets | Discarded packets |
| A | 0 | 136 | 0 |
| B | 0 | 136 | 0 |
| C | 0 | 136 | 0 |
| D | 0 | 136 | 0 |
| Quadrant | Total seconds | Saturated seconds | Saturation percentage |
|---|---|---|---|
| A | 6726 | 17 | 0.252751% |
| B | 6726 | 37 | 0.550104% |
| C | 6726 | 59 | 0.877193% |
| D | 6726 | 1221 | 18.153434% |
Noise dominated data is calculated using 1-second bins in cleaned event files. If a bin has >2000 counts, and if more than 50% of those come from <1% of pixels, then it is considered to be noise-dominated and hence unusable.
| Quadrant | # 1 sec bins | Bins with >0 counts | Bins with >2000 counts | High rate bins dominated by noise | Noise dominated (total time) | Noise dominated (detector-on time) | Marked lightcurve |
|---|---|---|---|---|---|---|---|
| A | 8686 | 6728 | 0 | 0 | 0.00% | 0.00% | 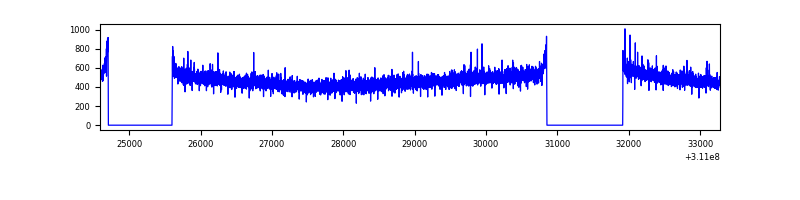 |
| B | 8686 | 6728 | 0 | 0 | 0.00% | 0.00% | 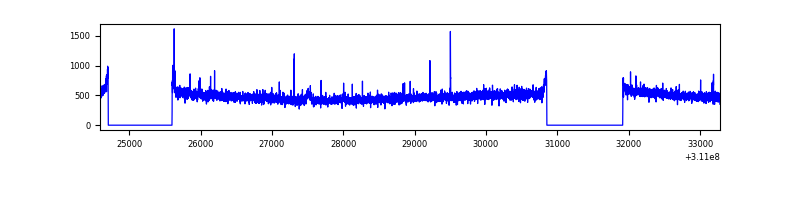 |
| C | 8686 | 6728 | 1 | 1 | 0.01% | 0.01% | 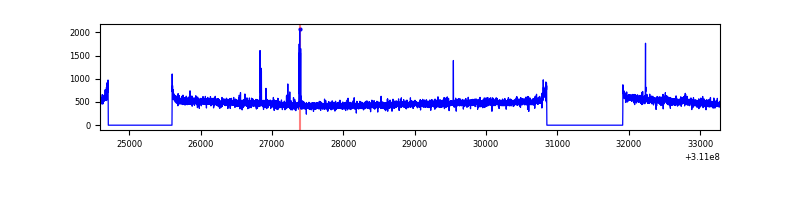 |
| D | 8686 | 6728 | 921 | 921 | 10.60% | 13.69% | 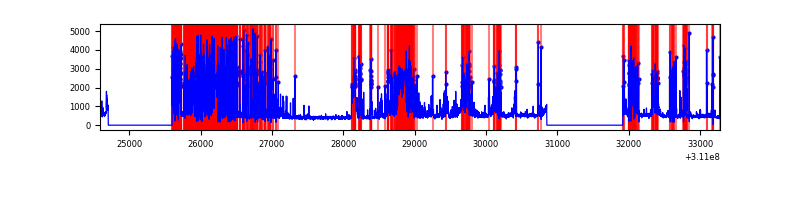 |
Top three noisy pixels from each quadrant. If the there are fewer than three noisy pixels in the level2.evt file, extra rows are filled as -1
| Pixel properties | Quadrant properties | ||||||
|---|---|---|---|---|---|---|---|
| Quadrant | DetID | PixID | Counts | Sigma | Mean | Median | Sigma |
| A | 13 | 254 | 10114 | 56.6 | 820 | 802 | 164.5 |
| A | 3 | 137 | 7317 | 39.6 | 820 | 802 | 164.5 |
| A | 0 | 226 | 7023 | 37.81 | 820 | 802 | 164.5 |
| B | 12 | 111 | 19127 | 116.12 | 822 | 800 | 157.8 |
| B | 11 | 111 | 17515 | 105.91 | 822 | 800 | 157.8 |
| B | 14 | 111 | 15380 | 92.38 | 822 | 800 | 157.8 |
| C | 14 | 238 | 124350 | 659.4 | 795 | 801 | 187.4 |
| C | 10 | 22 | 39785 | 208.06 | 795 | 801 | 187.4 |
| C | 3 | 9 | 6649 | 31.21 | 795 | 801 | 187.4 |
| D | 1 | 52 | 3310305 | 18762.98 | 729 | 709 | 176.4 |
| D | 2 | 136 | 278691 | 1575.95 | 729 | 709 | 176.4 |
| D | 12 | 227 | 43050 | 240.04 | 729 | 709 | 176.4 |
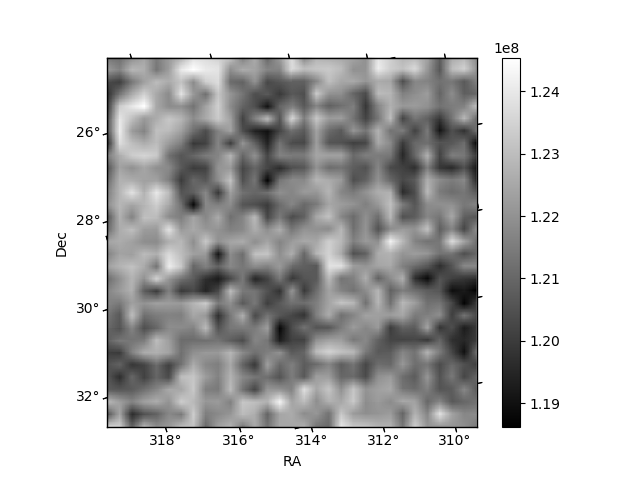
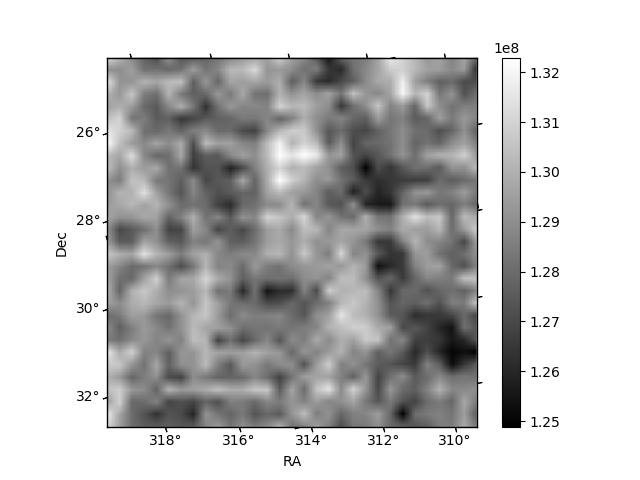
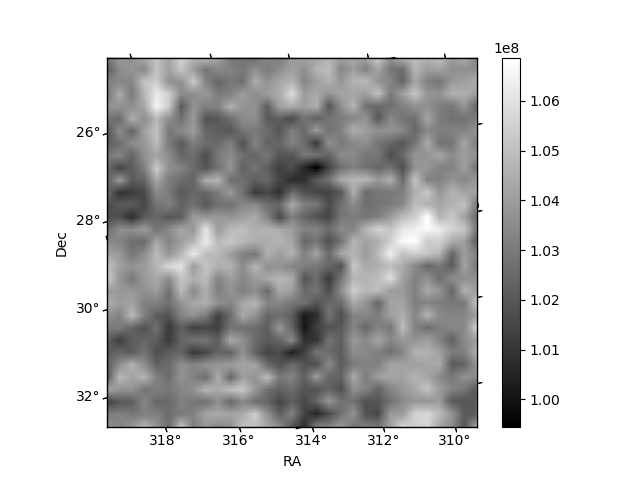
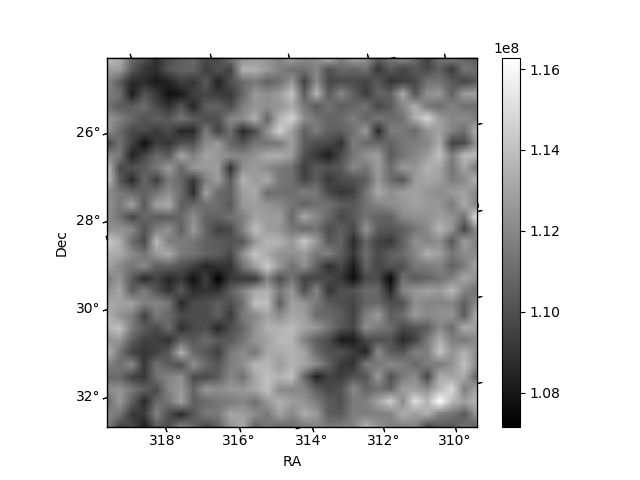
Histogram calculated using DETX and DETY for each event in the final _common_clean file
| Quadrant A | 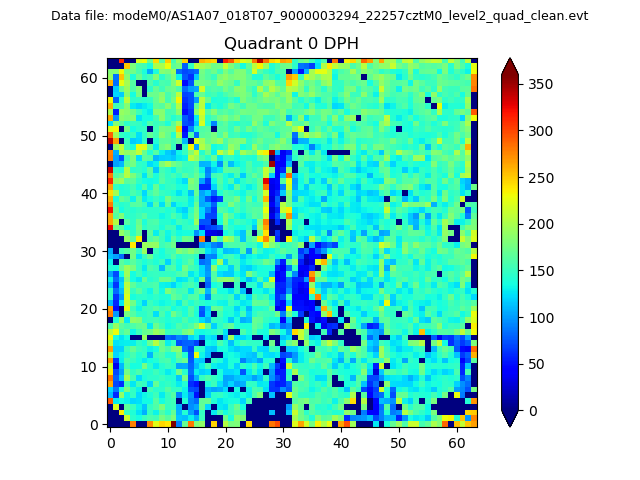 |
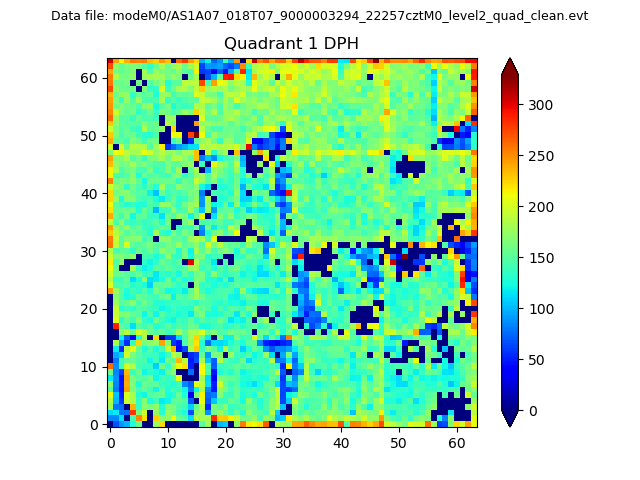 |
Quadrant B |
|---|---|---|---|
| Quadrant D |  |
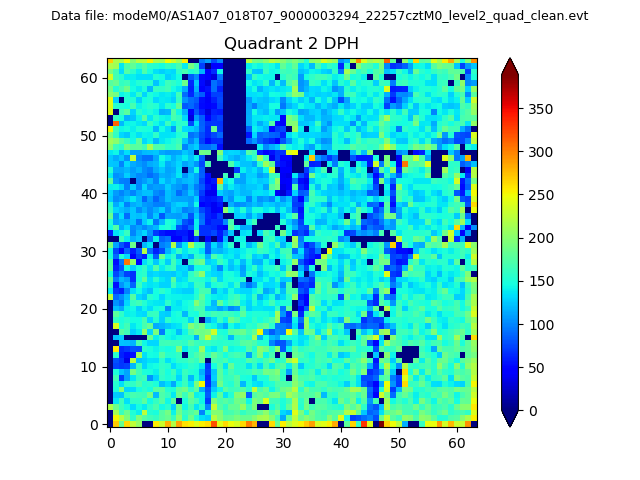 |
Quadrant C |
| Plot type | Count rate plots | Images |
|---|---|---|
| Comparison with Poisson distribution Blue bars denote a histogram of data divided into 1 sec bins. Red curve is a Poisson curve with rate = median count rate of data. |
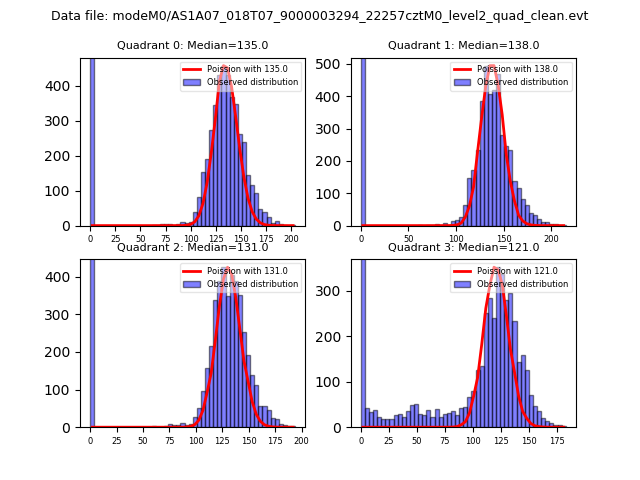 |
 |
| Quadrant-wise count rates Data is divided into 100 sec bins |
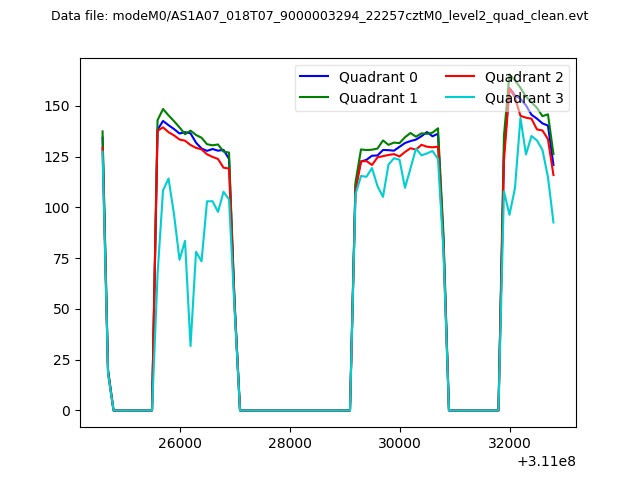 |
|
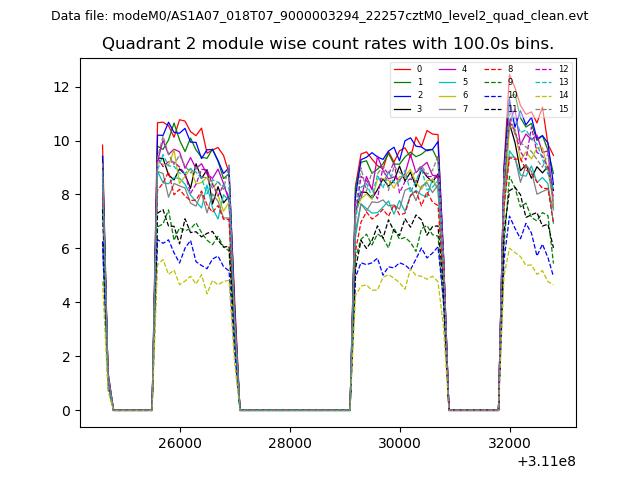
| Module-wise count rates for Quadrant A Data is divided into 100 sec bins |
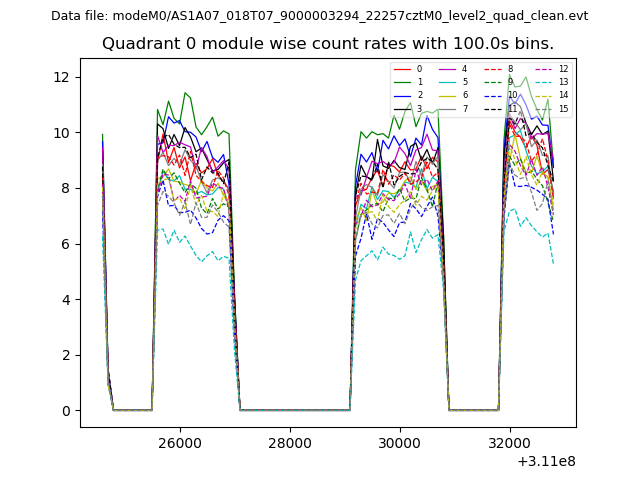 |
 |
| Module-wise count rates for Quadrant B Data is divided into 100 sec bins |
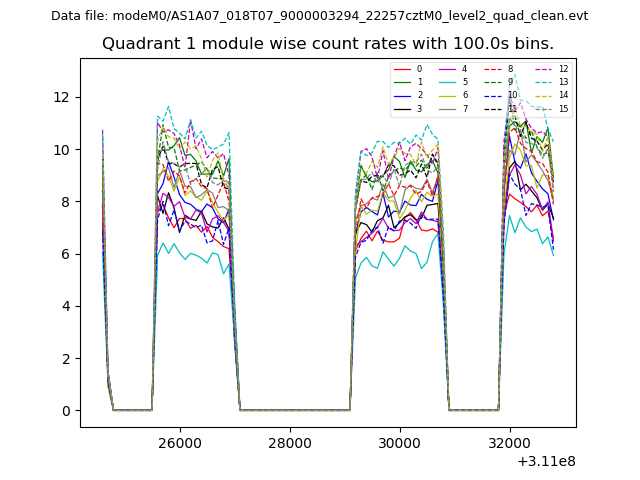 |
 |
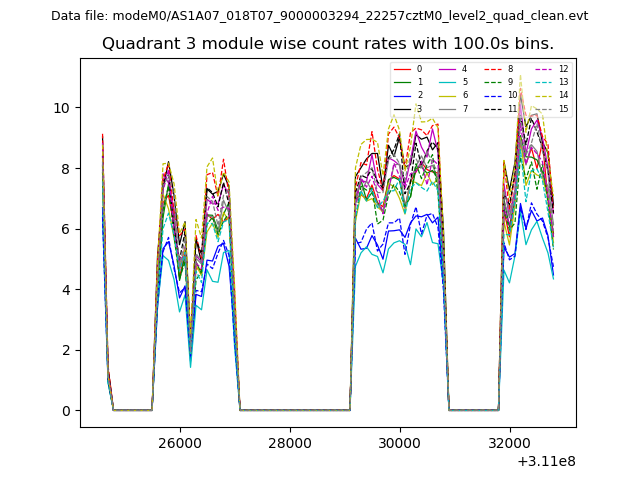
| Module-wise count rates for Quadrant C Data is divided into 100 sec bins |
 |
 |
| Module-wise count rates for Quadrant D Data is divided into 100 sec bins |
 |
 |
| Parameter | Plot |
|---|---|
| CZT HV Monitor | 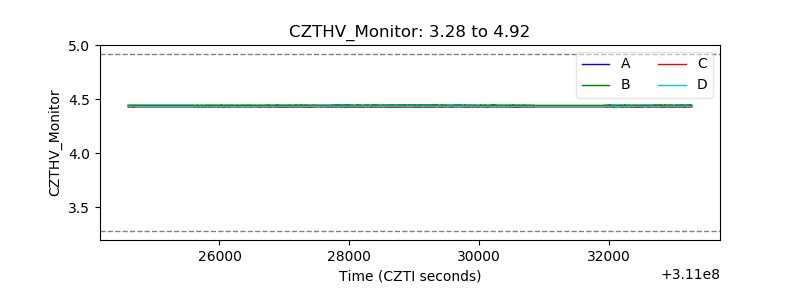 |
| D_VDD | 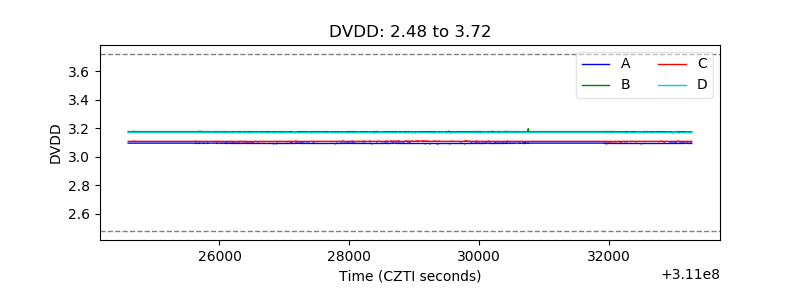 |
| Temperature 1 | 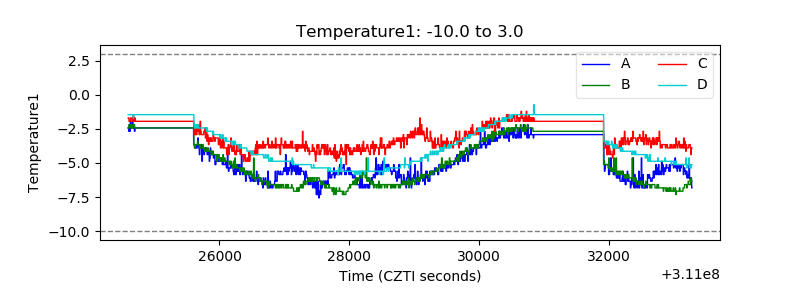 |
| Veto HV Monitor | 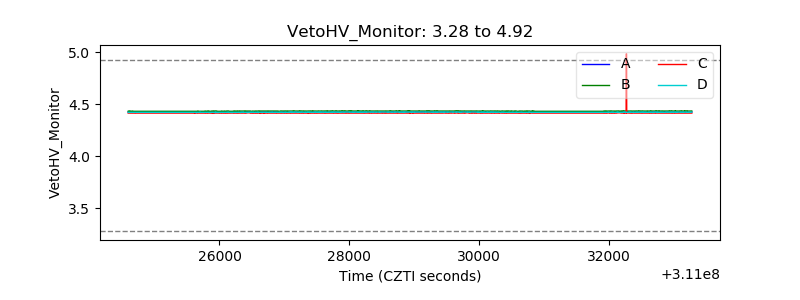 |
| Veto LLD | 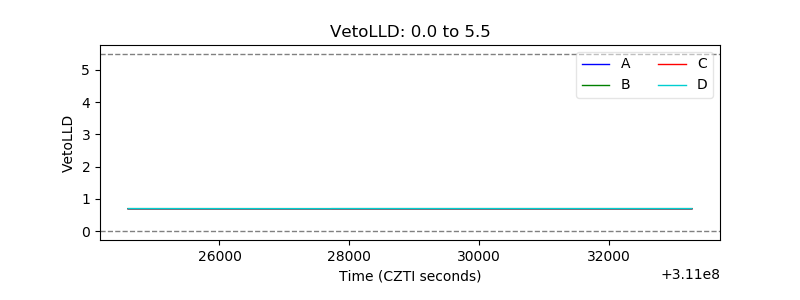 |
| Alpha Counter |  |
| _CPM_Rate |  |
| CZT Counter |  |
| +2.5 Volts monitor |  |
| +5 Volts monitor |  |
| _ROLL_ROT | 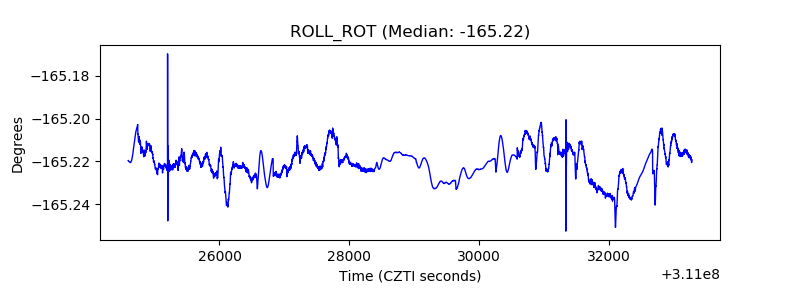 |
| _Roll_DEC | 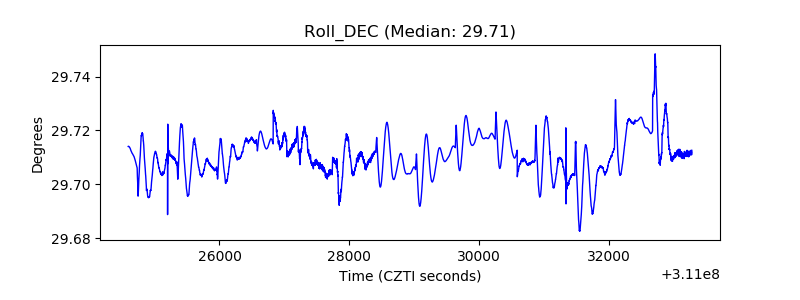 |
| _Roll_RA |  |
| Veto Counter | 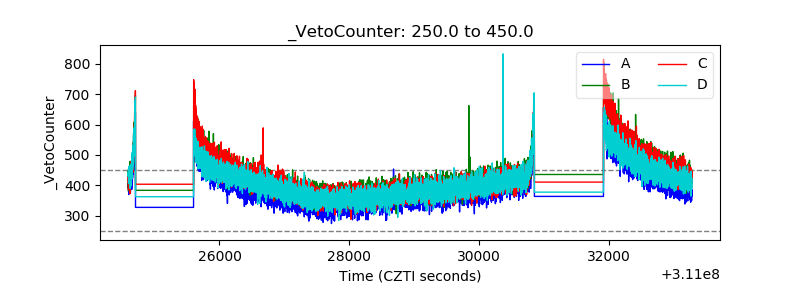 |