| Param | Original file | Final file |
|---|---|---|
| Filename | modeM0/AS1A07_018T07_9000003294_22260cztM0_level2.evt | modeM0/AS1A07_018T07_9000003294_22260cztM0_level2_quad_clean.evt |
| Size (bytes) | 581,601,600 | 68,258,880 |
| Size | 554.7 MB | 65.1 MB |
| Events in quadrant A | 3,306,188 | 429,664 |
| Events in quadrant B | 3,362,841 | 444,091 |
| Events in quadrant C | 3,341,528 | 414,098 |
| Events in quadrant D | 7,167,804 | 330,450 |
| Mode M9 | |||
|---|---|---|---|
| Quadrant | BADHDUFLAG | Total packets | Discarded packets |
| A | 0 | 13 | 0 |
| B | 0 | 13 | 0 |
| C | 0 | 13 | 0 |
| D | 0 | 13 | 0 |
| Mode M0 | |||
|---|---|---|---|
| Quadrant | BADHDUFLAG | Total packets | Discarded packets |
| A | 0 | 13696 | 1 |
| B | 0 | 13900 | 1 |
| C | 0 | 13847 | 1 |
| D | 0 | 25651 | 4 |
| Mode SS | |||
|---|---|---|---|
| Quadrant | BADHDUFLAG | Total packets | Discarded packets |
| A | 0 | 130 | 0 |
| B | 0 | 130 | 0 |
| C | 0 | 130 | 0 |
| D | 0 | 130 | 0 |
| Quadrant | Total seconds | Saturated seconds | Saturation percentage |
|---|---|---|---|
| A | 6420 | 22 | 0.342679% |
| B | 6421 | 39 | 0.607382% |
| C | 6421 | 61 | 0.950008% |
| D | 6420 | 1733 | 26.993769% |
Noise dominated data is calculated using 1-second bins in cleaned event files. If a bin has >2000 counts, and if more than 50% of those come from <1% of pixels, then it is considered to be noise-dominated and hence unusable.
| Quadrant | # 1 sec bins | Bins with >0 counts | Bins with >2000 counts | High rate bins dominated by noise | Noise dominated (total time) | Noise dominated (detector-on time) | Marked lightcurve |
|---|---|---|---|---|---|---|---|
| A | 7695 | 6421 | 0 | 0 | 0.00% | 0.00% | 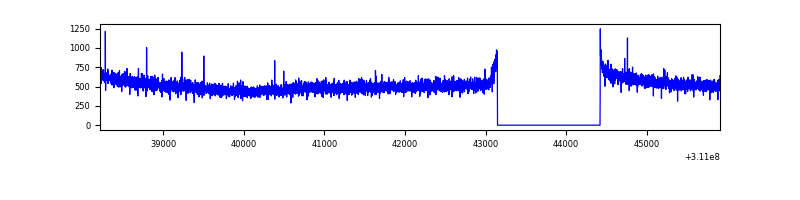 |
| B | 7696 | 6422 | 0 | 0 | 0.00% | 0.00% | 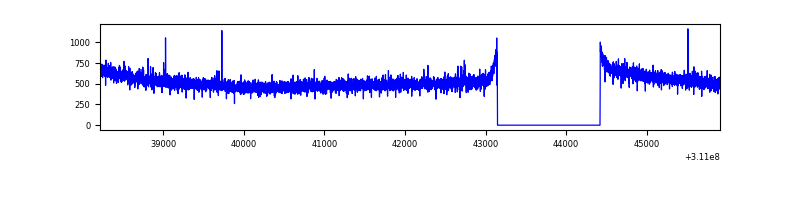 |
| C | 7696 | 6422 | 0 | 0 | 0.00% | 0.00% | 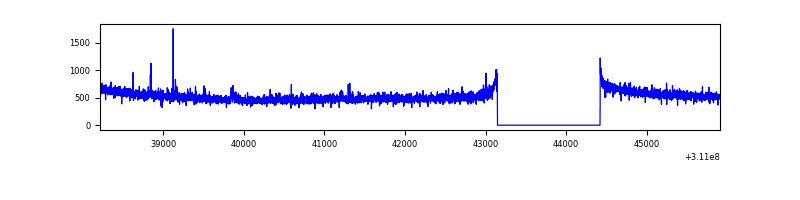 |
| D | 7695 | 6421 | 1289 | 1289 | 16.75% | 20.07% | 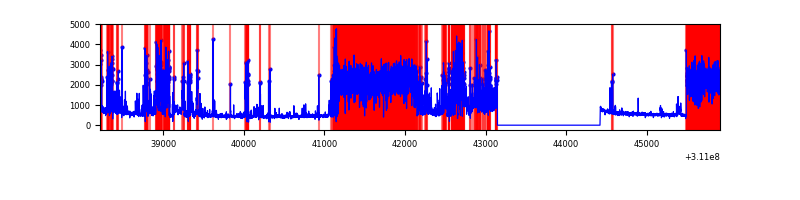 |
Top three noisy pixels from each quadrant. If the there are fewer than three noisy pixels in the level2.evt file, extra rows are filled as -1
| Pixel properties | Quadrant properties | ||||||
|---|---|---|---|---|---|---|---|
| Quadrant | DetID | PixID | Counts | Sigma | Mean | Median | Sigma |
| A | 13 | 248 | 15213 | 84.56 | 854 | 839 | 170.0 |
| A | 13 | 254 | 9427 | 50.52 | 854 | 839 | 170.0 |
| A | 0 | 226 | 7140 | 37.07 | 854 | 839 | 170.0 |
| B | 12 | 111 | 18875 | 112.91 | 857 | 838 | 159.7 |
| B | 11 | 111 | 16987 | 101.09 | 857 | 838 | 159.7 |
| B | 14 | 111 | 15356 | 90.88 | 857 | 838 | 159.7 |
| C | 14 | 238 | 132205 | 694.19 | 816 | 826 | 189.3 |
| C | 10 | 22 | 17639 | 88.84 | 816 | 826 | 189.3 |
| C | 3 | 9 | 11094 | 54.26 | 816 | 826 | 189.3 |
| D | 1 | 52 | 4341481 | 24564.52 | 736 | 718 | 176.7 |
| D | 2 | 234 | 20268 | 110.63 | 736 | 718 | 176.7 |
| D | 2 | 136 | 18502 | 100.64 | 736 | 718 | 176.7 |
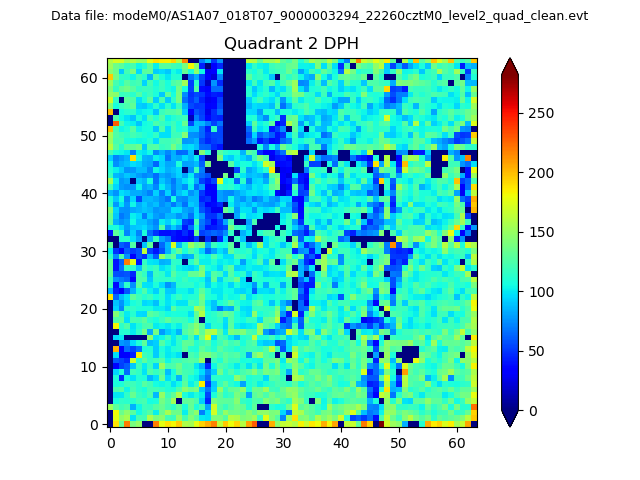
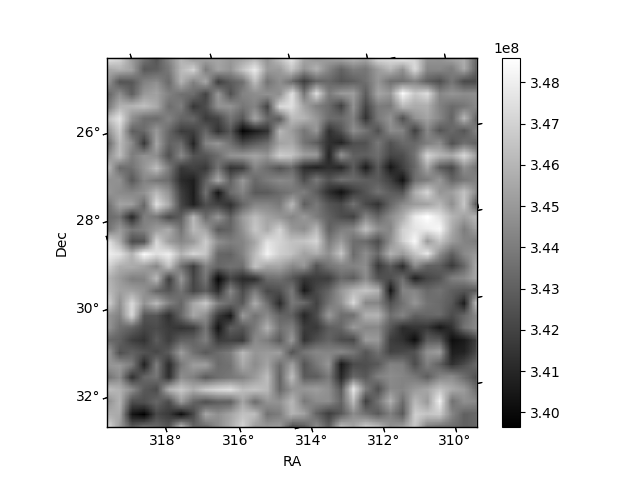
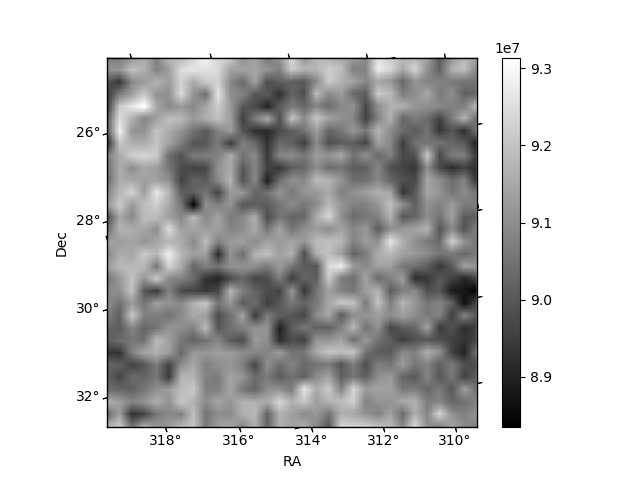
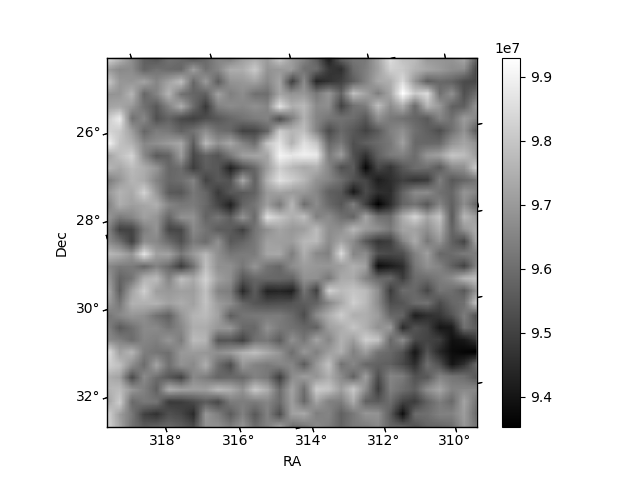
Histogram calculated using DETX and DETY for each event in the final _common_clean file
| Quadrant A | 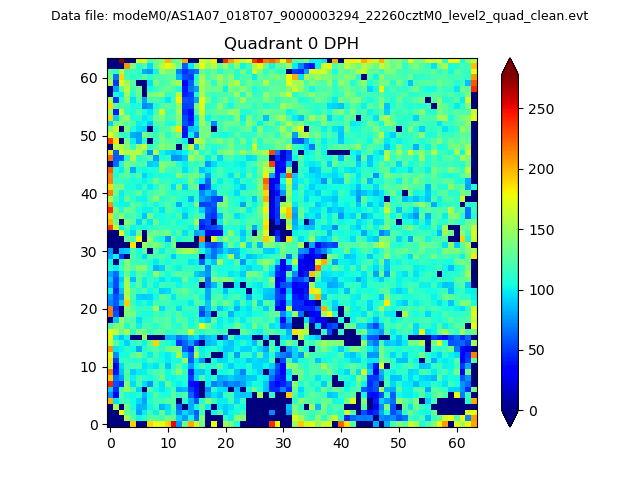 |
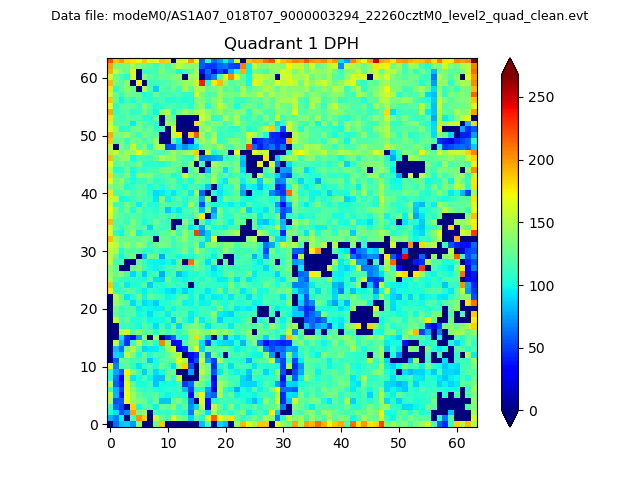 |
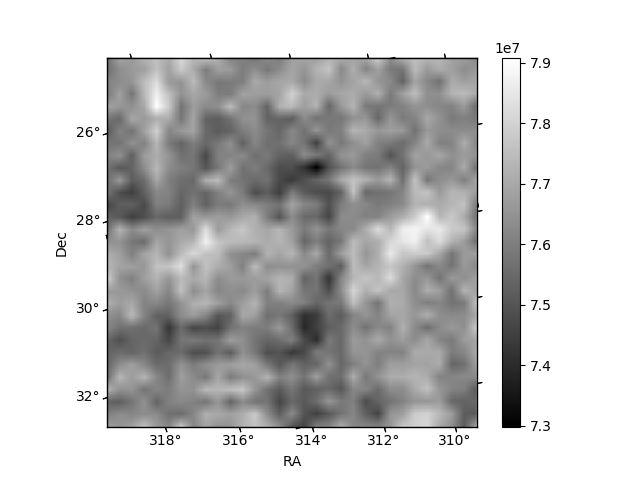
Quadrant B |
|---|---|---|---|
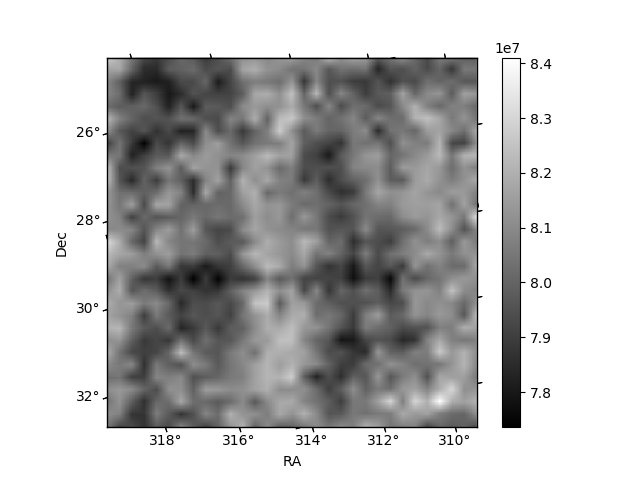
| Quadrant D | 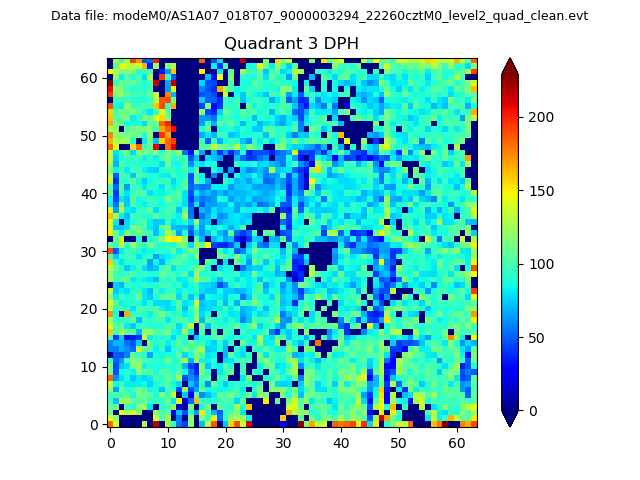 |
 |
Quadrant C |
| Plot type | Count rate plots | Images |
|---|---|---|
| Comparison with Poisson distribution Blue bars denote a histogram of data divided into 1 sec bins. Red curve is a Poisson curve with rate = median count rate of data. |
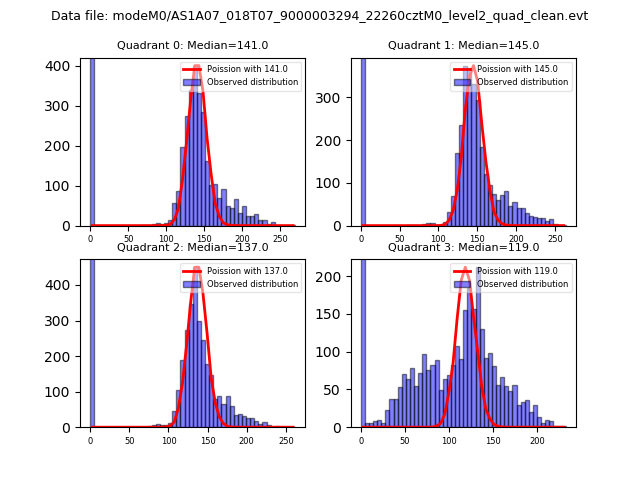 |
 |
| Quadrant-wise count rates Data is divided into 100 sec bins |
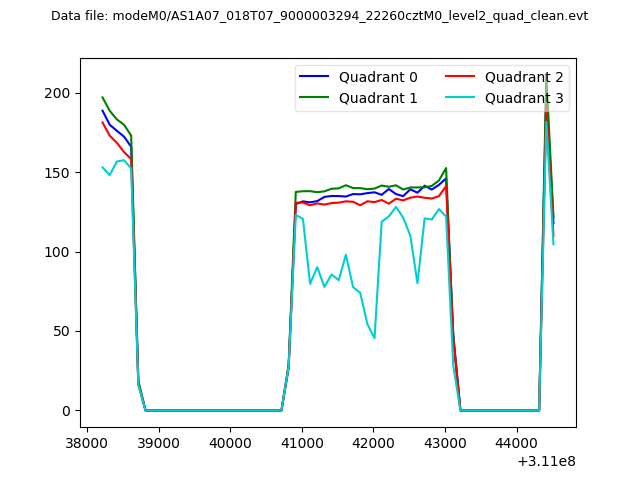 |
|
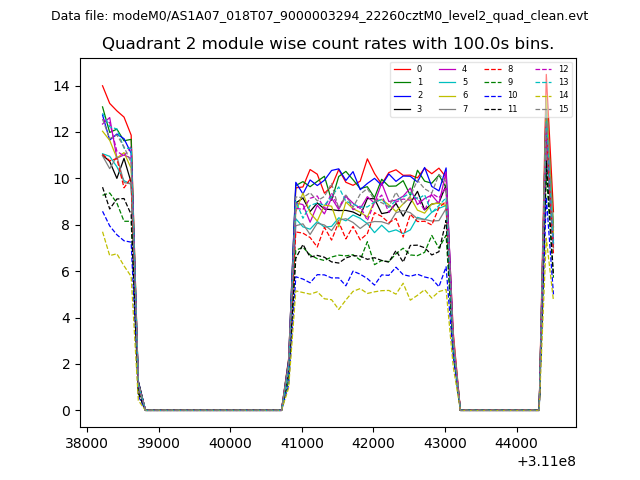
| Module-wise count rates for Quadrant A Data is divided into 100 sec bins |
 |
 |
| Module-wise count rates for Quadrant B Data is divided into 100 sec bins |
 |
 |
| Module-wise count rates for Quadrant C Data is divided into 100 sec bins |
 |
 |
| Module-wise count rates for Quadrant D Data is divided into 100 sec bins |
 |
 |
| Parameter | Plot |
|---|---|
| CZT HV Monitor | 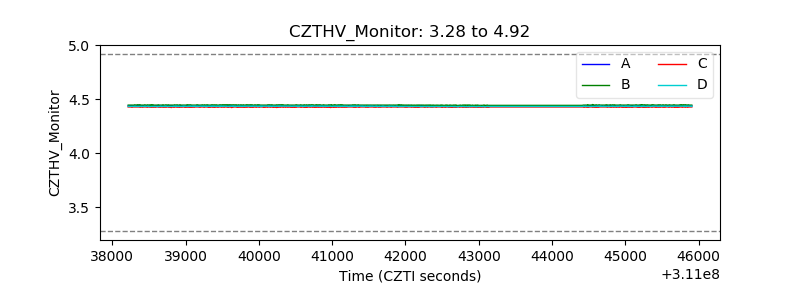 |
| D_VDD |  |
| Temperature 1 | 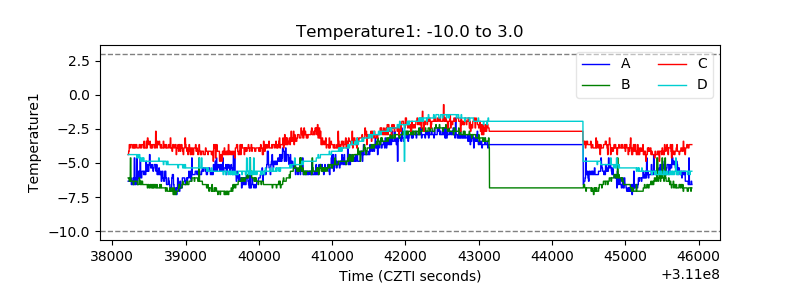 |
| Veto HV Monitor |  |
| Veto LLD |  |
| Alpha Counter | 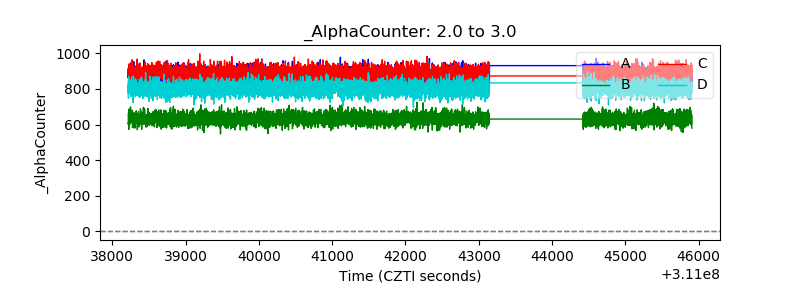 |
| _CPM_Rate | 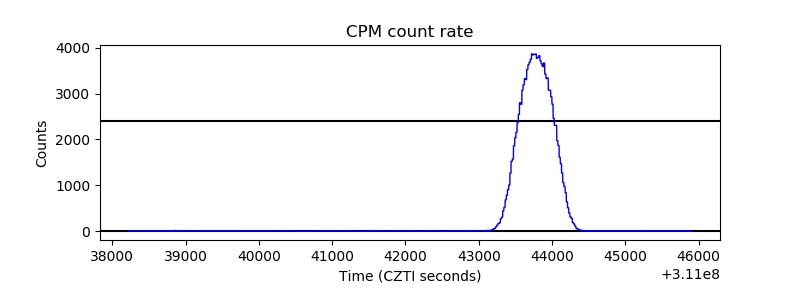 |
| CZT Counter | 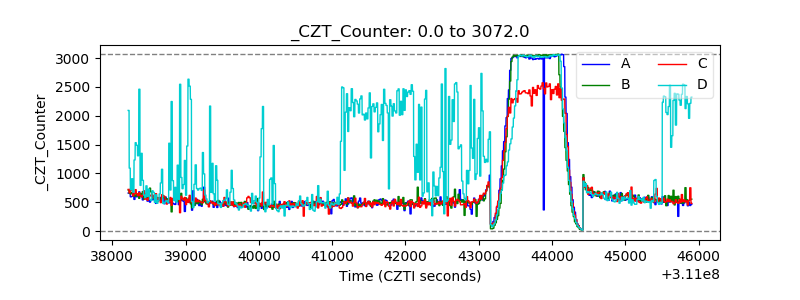 |
| +2.5 Volts monitor |  |
| +5 Volts monitor |  |
| _ROLL_ROT | 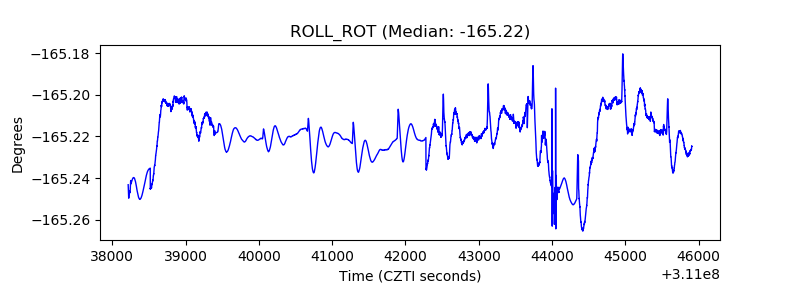 |
| _Roll_DEC | 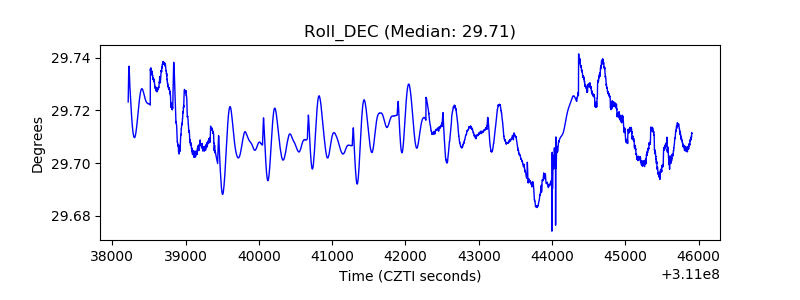 |
| _Roll_RA | 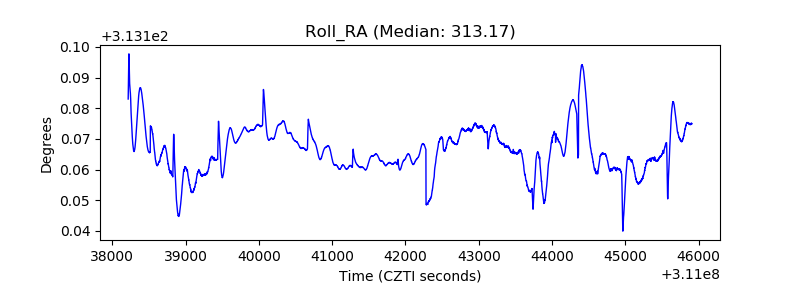 |
| Veto Counter | 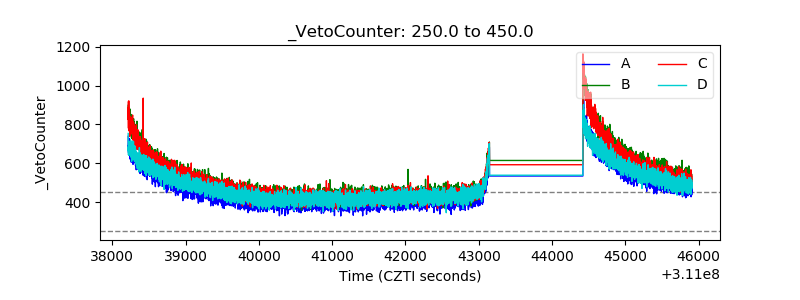 |