| Param | Original file | Final file |
|---|---|---|
| Filename | modeM0/AS1A07_018T07_9000003294_22263cztM0_level2.evt | modeM0/AS1A07_018T07_9000003294_22263cztM0_level2_quad_clean.evt |
| Size (bytes) | 489,804,480 | 82,247,040 |
| Size | 467.1 MB | 78.4 MB |
| Events in quadrant A | 3,360,950 | 529,115 |
| Events in quadrant B | 3,577,402 | 535,126 |
| Events in quadrant C | 3,864,823 | 494,344 |
| Events in quadrant D | 3,602,130 | 491,431 |
| Mode M9 | |||
|---|---|---|---|
| Quadrant | BADHDUFLAG | Total packets | Discarded packets |
| A | 0 | 19 | 0 |
| B | 0 | 20 | 0 |
| C | 0 | 20 | 0 |
| D | 0 | 20 | 0 |
| Mode M0 | |||
|---|---|---|---|
| Quadrant | BADHDUFLAG | Total packets | Discarded packets |
| A | 0 | 13625 | 2 |
| B | 0 | 14360 | 2 |
| C | 0 | 15215 | 2 |
| D | 0 | 14572 | 2 |
| Mode SS | |||
|---|---|---|---|
| Quadrant | BADHDUFLAG | Total packets | Discarded packets |
| A | 0 | 126 | 0 |
| B | 0 | 126 | 0 |
| C | 0 | 126 | 0 |
| D | 0 | 126 | 0 |
| Quadrant | Total seconds | Saturated seconds | Saturation percentage |
|---|---|---|---|
| A | 6322 | 87 | 1.376147% |
| B | 6322 | 162 | 2.562480% |
| C | 6322 | 289 | 4.571338% |
| D | 6322 | 80 | 1.265422% |
Noise dominated data is calculated using 1-second bins in cleaned event files. If a bin has >2000 counts, and if more than 50% of those come from <1% of pixels, then it is considered to be noise-dominated and hence unusable.
| Quadrant | # 1 sec bins | Bins with >0 counts | Bins with >2000 counts | High rate bins dominated by noise | Noise dominated (total time) | Noise dominated (detector-on time) | Marked lightcurve |
|---|---|---|---|---|---|---|---|
| A | 7592 | 6323 | 0 | 0 | 0.00% | 0.00% | 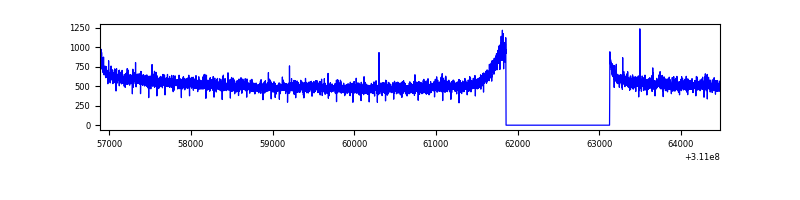 |
| B | 7592 | 6323 | 34 | 34 | 0.45% | 0.54% | 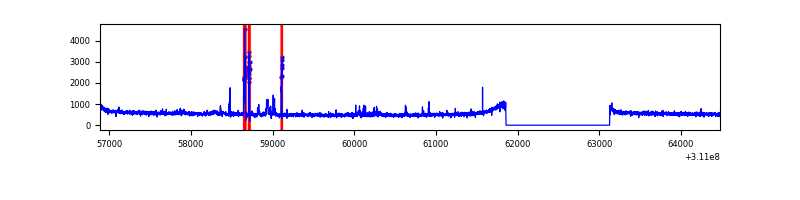 |
| C | 7592 | 6323 | 156 | 156 | 2.05% | 2.47% | 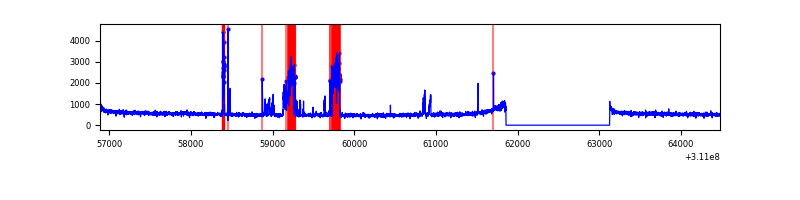 |
| D | 7592 | 6323 | 29 | 29 | 0.38% | 0.46% | 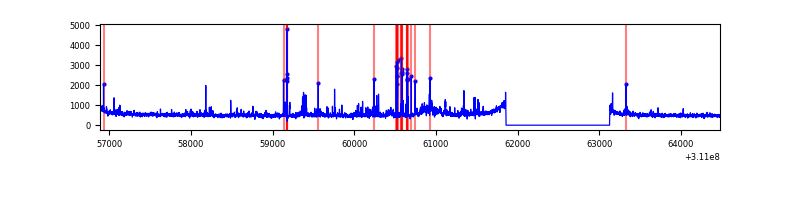 |
Top three noisy pixels from each quadrant. If the there are fewer than three noisy pixels in the level2.evt file, extra rows are filled as -1
| Pixel properties | Quadrant properties | ||||||
|---|---|---|---|---|---|---|---|
| Quadrant | DetID | PixID | Counts | Sigma | Mean | Median | Sigma |
| A | 13 | 254 | 9250 | 48.0 | 872 | 856 | 174.9 |
| A | 0 | 226 | 7580 | 38.45 | 872 | 856 | 174.9 |
| A | 3 | 137 | 6852 | 34.29 | 872 | 856 | 174.9 |
| B | 3 | 64 | 177263 | 1084.31 | 866 | 848 | 162.7 |
| B | 12 | 111 | 19459 | 114.39 | 866 | 848 | 162.7 |
| B | 11 | 111 | 17234 | 100.71 | 866 | 848 | 162.7 |
| C | 10 | 22 | 556458 | 2938.03 | 814 | 822 | 189.1 |
| C | 14 | 238 | 129934 | 682.71 | 814 | 822 | 189.1 |
| C | 3 | 9 | 5868 | 26.68 | 814 | 822 | 189.1 |
| D | 1 | 52 | 300914 | 1510.06 | 830 | 811 | 198.7 |
| D | 2 | 136 | 83159 | 414.36 | 830 | 811 | 198.7 |
| D | 13 | 172 | 52044 | 257.79 | 830 | 811 | 198.7 |
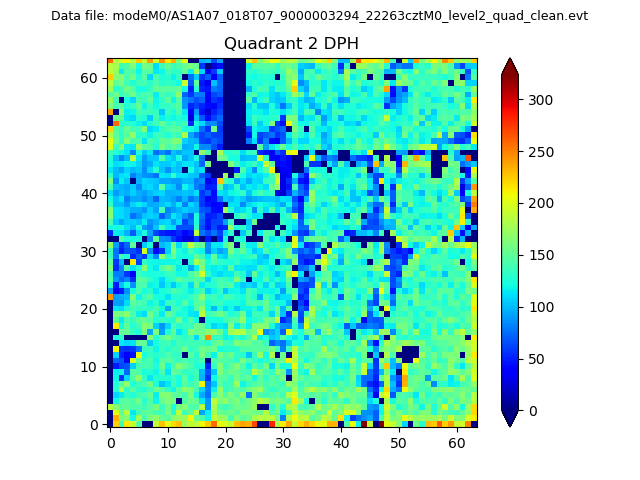
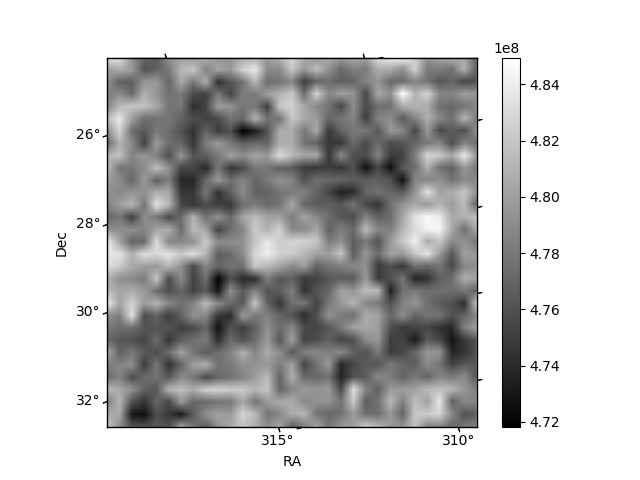
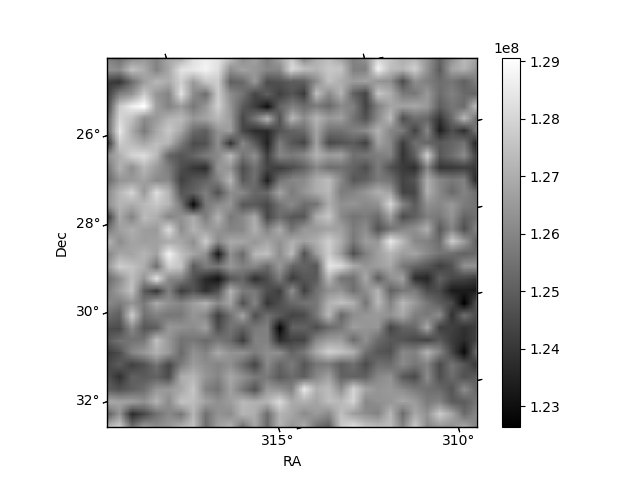
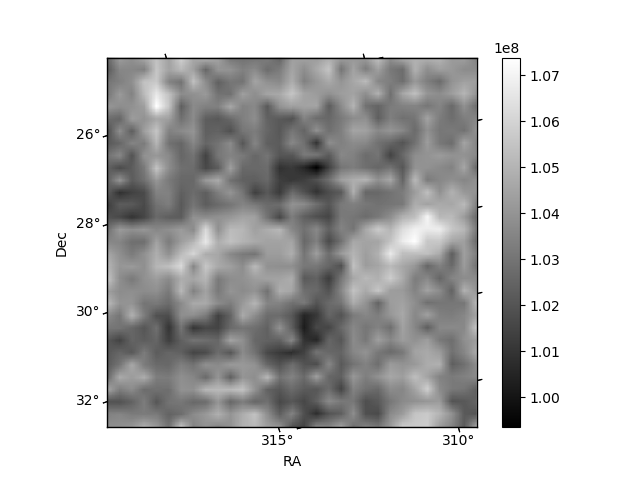
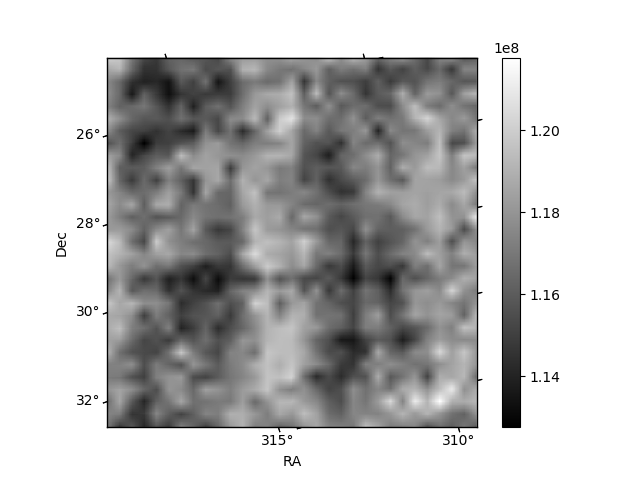
Histogram calculated using DETX and DETY for each event in the final _common_clean file
| Quadrant A | 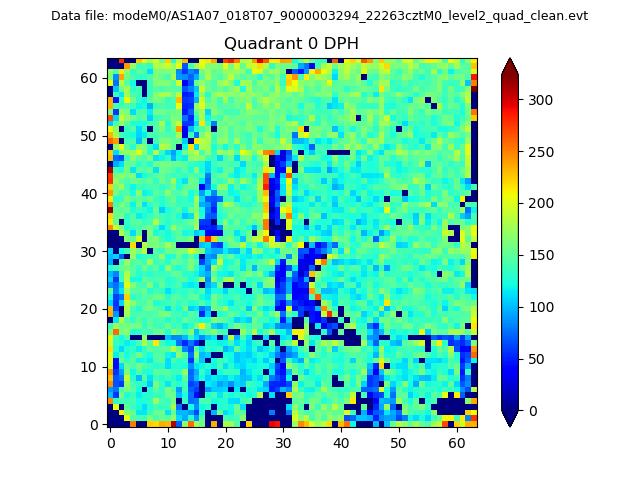 |
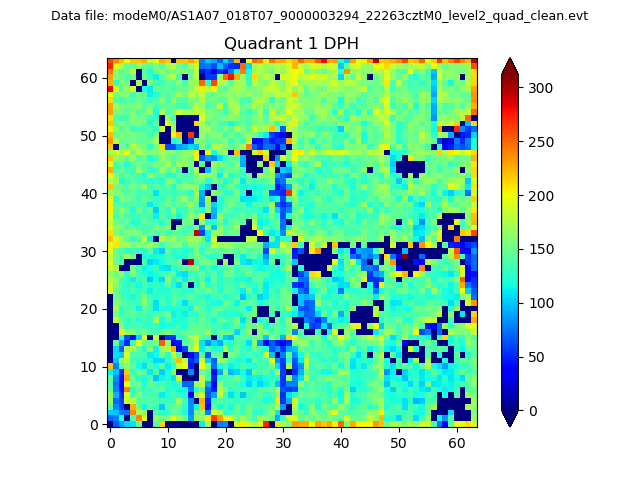 |
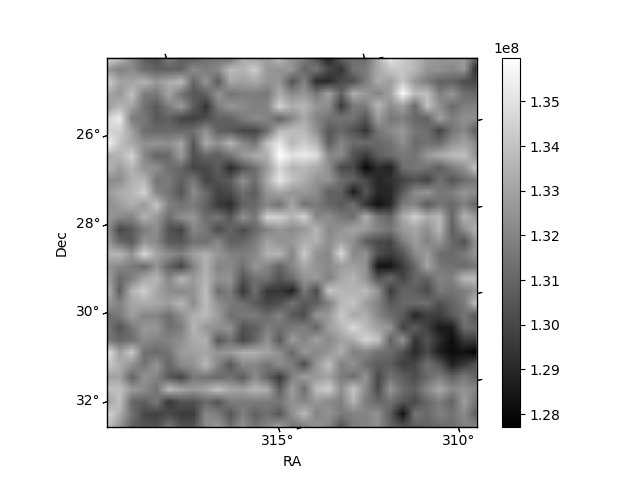
Quadrant B |
|---|---|---|---|
| Quadrant D | 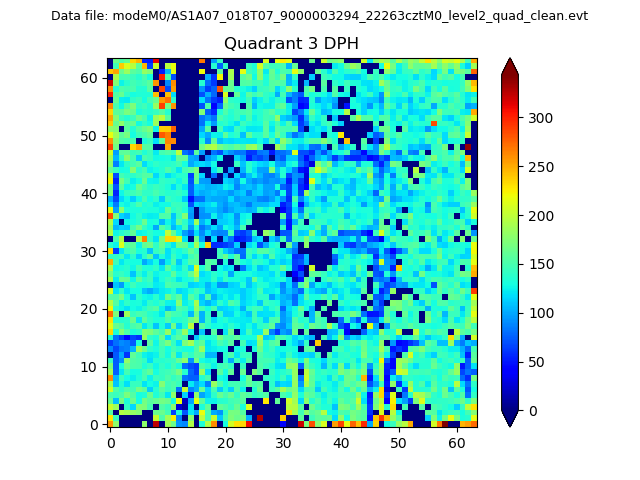 |
 |
Quadrant C |
| Plot type | Count rate plots | Images |
|---|---|---|
| Comparison with Poisson distribution Blue bars denote a histogram of data divided into 1 sec bins. Red curve is a Poisson curve with rate = median count rate of data. |
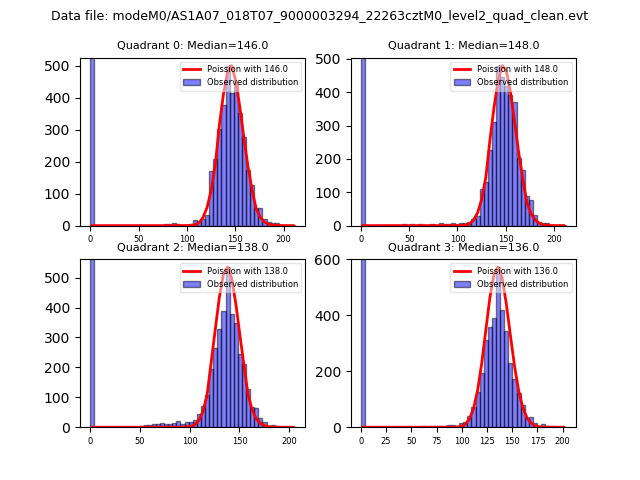 |
 |
| Quadrant-wise count rates Data is divided into 100 sec bins |
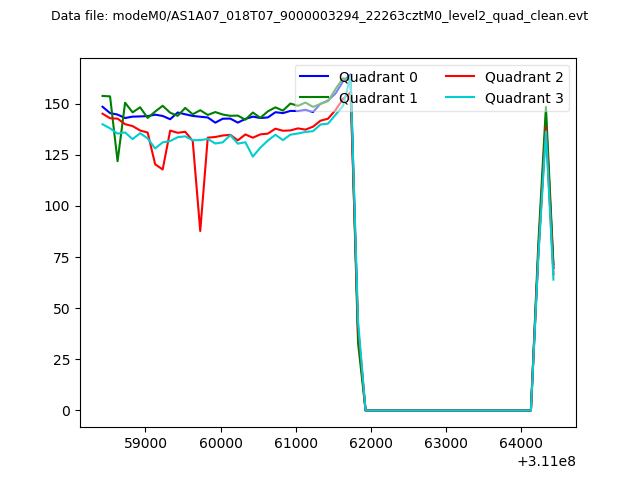 |
|
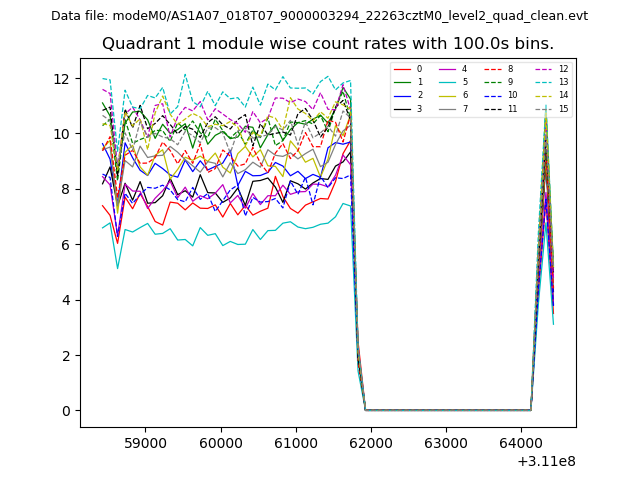
| Module-wise count rates for Quadrant A Data is divided into 100 sec bins |
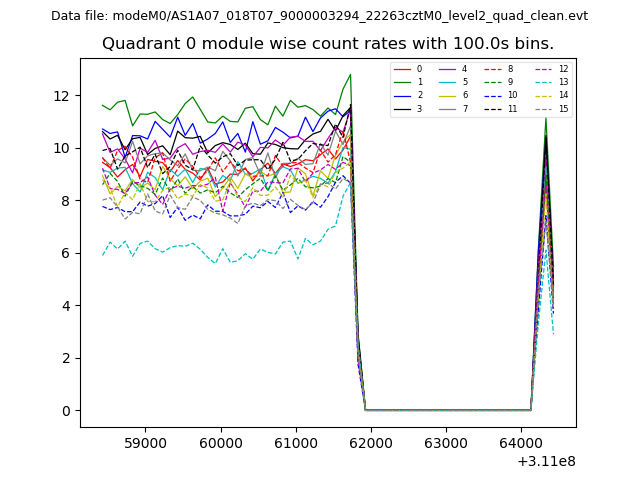 |
 |
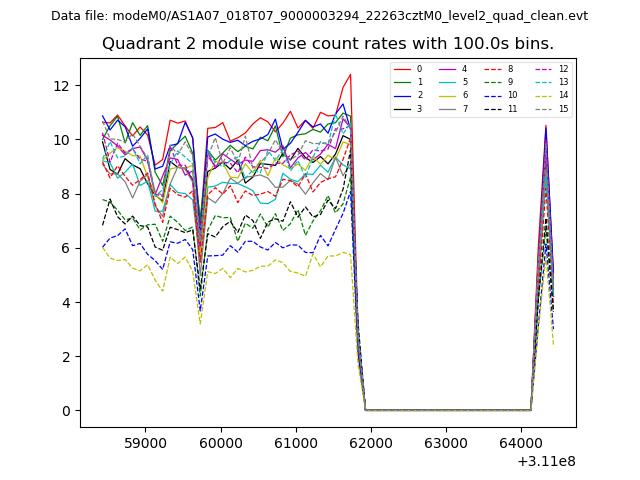
| Module-wise count rates for Quadrant B Data is divided into 100 sec bins |
 |
 |
| Module-wise count rates for Quadrant C Data is divided into 100 sec bins |
 |
 |
| Module-wise count rates for Quadrant D Data is divided into 100 sec bins |
 |
 |
| Parameter | Plot |
|---|---|
| CZT HV Monitor | 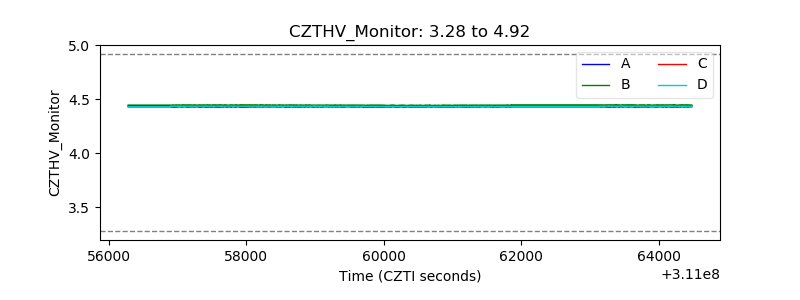 |
| D_VDD | 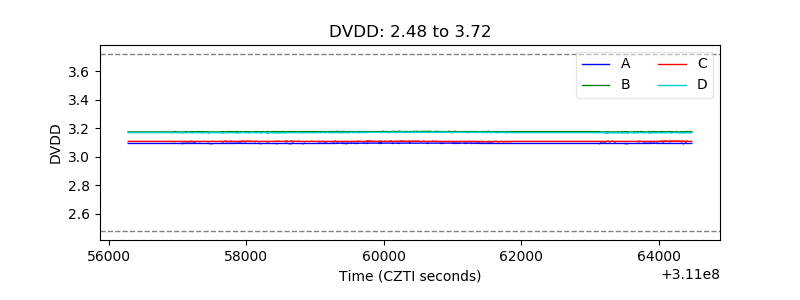 |
| Temperature 1 |  |
| Veto HV Monitor | 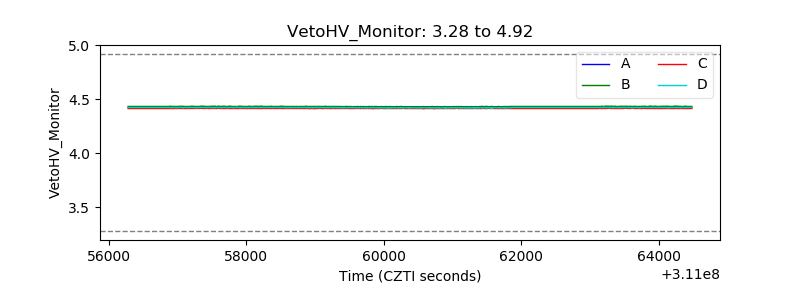 |
| Veto LLD | 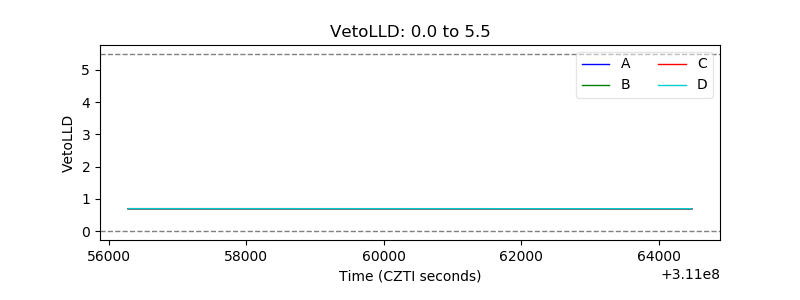 |
| Alpha Counter | 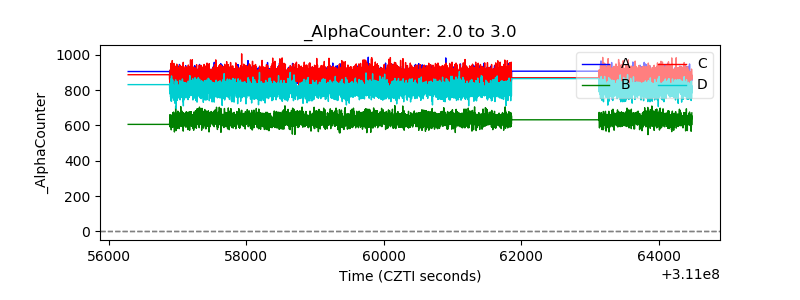 |
| _CPM_Rate | 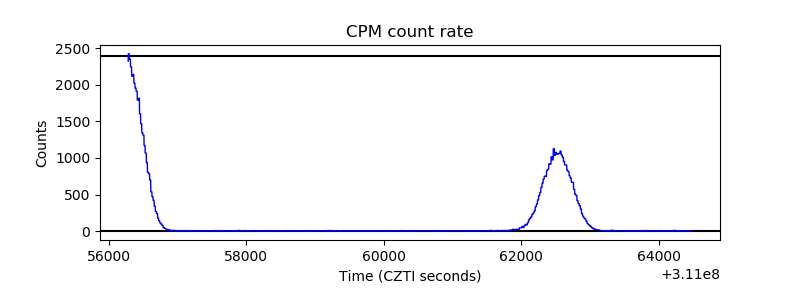 |
| CZT Counter | 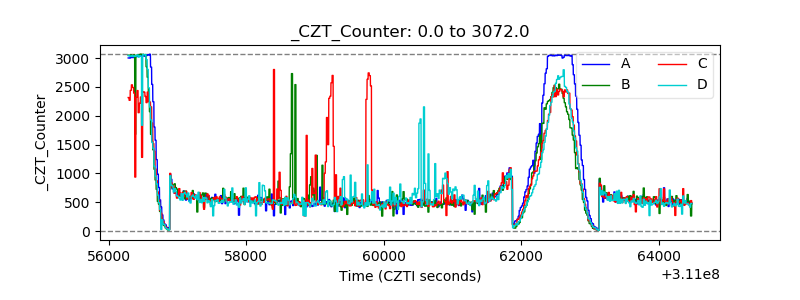 |
| +2.5 Volts monitor |  |
| +5 Volts monitor |  |
| _ROLL_ROT |  |
| _Roll_DEC |  |
| _Roll_RA | 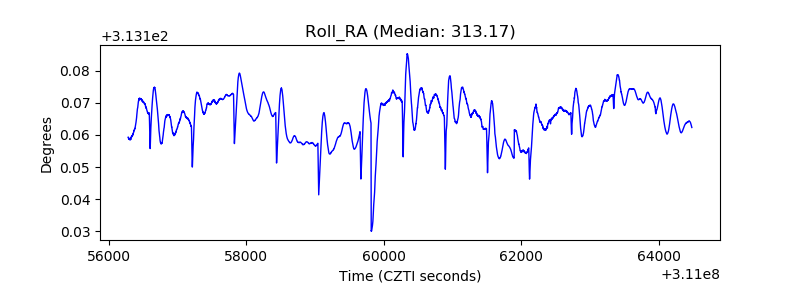 |
| Veto Counter | 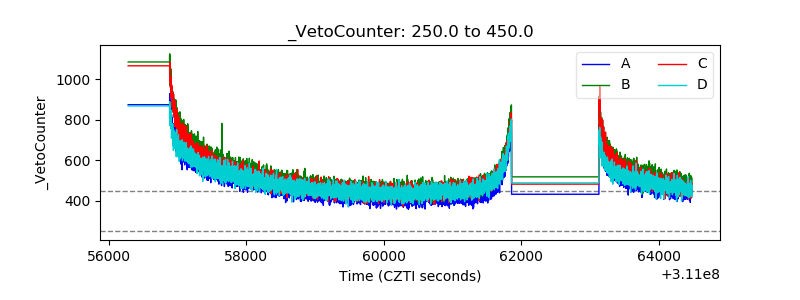 |