| Param | Original file | Final file |
|---|---|---|
| Filename | modeM0/AS1A07_018T07_9000003294_22267cztM0_level2.evt | modeM0/AS1A07_018T07_9000003294_22267cztM0_level2_quad_clean.evt |
| Size (bytes) | 483,505,920 | 95,428,800 |
| Size | 461.1 MB | 91.0 MB |
| Events in quadrant A | 3,331,558 | 613,868 |
| Events in quadrant B | 3,406,403 | 623,258 |
| Events in quadrant C | 3,338,808 | 588,128 |
| Events in quadrant D | 4,089,553 | 576,031 |
| Mode M9 | |||
|---|---|---|---|
| Quadrant | BADHDUFLAG | Total packets | Discarded packets |
| A | 0 | 2 | 0 |
| B | 0 | 2 | 0 |
| C | 0 | 2 | 0 |
| D | 0 | 2 | 0 |
| Mode M0 | |||
|---|---|---|---|
| Quadrant | BADHDUFLAG | Total packets | Discarded packets |
| A | 0 | 14564 | 1 |
| B | 0 | 14655 | 1 |
| C | 0 | 14541 | 1 |
| D | 0 | 16776 | 1 |
| Mode SS | |||
|---|---|---|---|
| Quadrant | BADHDUFLAG | Total packets | Discarded packets |
| A | 0 | 142 | 0 |
| B | 0 | 142 | 0 |
| C | 0 | 142 | 0 |
| D | 0 | 142 | 0 |
| Quadrant | Total seconds | Saturated seconds | Saturation percentage |
|---|---|---|---|
| A | 7012 | 144 | 2.053622% |
| B | 7013 | 162 | 2.309996% |
| C | 7013 | 172 | 2.452588% |
| D | 7013 | 205 | 2.923143% |
Noise dominated data is calculated using 1-second bins in cleaned event files. If a bin has >2000 counts, and if more than 50% of those come from <1% of pixels, then it is considered to be noise-dominated and hence unusable.
| Quadrant | # 1 sec bins | Bins with >0 counts | Bins with >2000 counts | High rate bins dominated by noise | Noise dominated (total time) | Noise dominated (detector-on time) | Marked lightcurve |
|---|---|---|---|---|---|---|---|
| A | 7177 | 7014 | 0 | 0 | 0.00% | 0.00% | 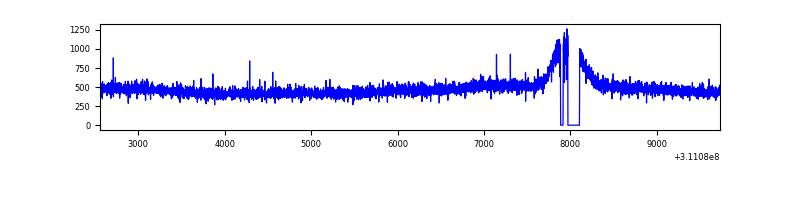 |
| B | 7178 | 7015 | 2 | 2 | 0.03% | 0.03% | 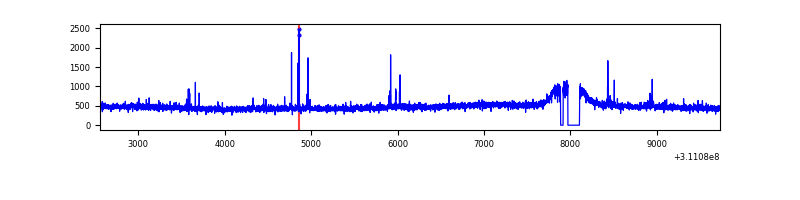 |
| C | 7178 | 7015 | 0 | 0 | 0.00% | 0.00% | 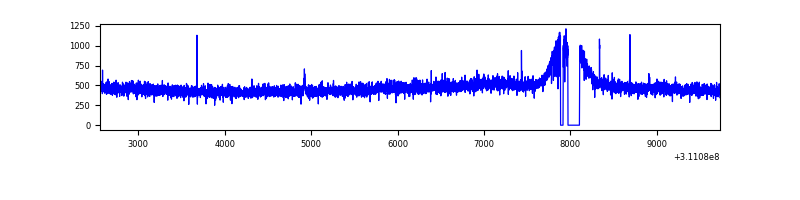 |
| D | 7178 | 7015 | 96 | 96 | 1.34% | 1.37% | 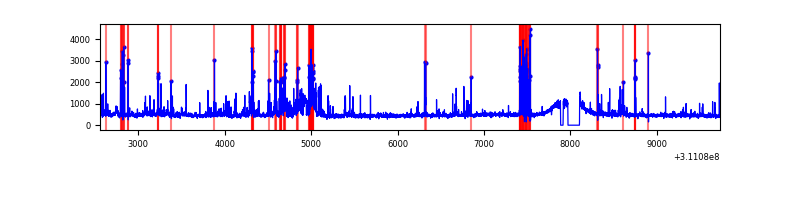 |
Top three noisy pixels from each quadrant. If the there are fewer than three noisy pixels in the level2.evt file, extra rows are filled as -1
| Pixel properties | Quadrant properties | ||||||
|---|---|---|---|---|---|---|---|
| Quadrant | DetID | PixID | Counts | Sigma | Mean | Median | Sigma |
| A | 13 | 254 | 8771 | 45.14 | 864 | 844 | 175.6 |
| A | 3 | 137 | 7712 | 39.11 | 864 | 844 | 175.6 |
| A | 0 | 226 | 7356 | 37.08 | 864 | 844 | 175.6 |
| B | 3 | 64 | 24753 | 143.19 | 856 | 833 | 167.0 |
| B | 12 | 111 | 20901 | 120.13 | 856 | 833 | 167.0 |
| B | 11 | 111 | 18475 | 105.61 | 856 | 833 | 167.0 |
| C | 14 | 238 | 128657 | 660.74 | 821 | 827 | 193.5 |
| C | 10 | 22 | 7475 | 34.36 | 821 | 827 | 193.5 |
| C | 13 | 61 | 5628 | 24.82 | 821 | 827 | 193.5 |
| D | 1 | 52 | 708441 | 3424.52 | 838 | 813 | 206.6 |
| D | 12 | 227 | 126482 | 608.17 | 838 | 813 | 206.6 |
| D | 13 | 104 | 47619 | 226.51 | 838 | 813 | 206.6 |
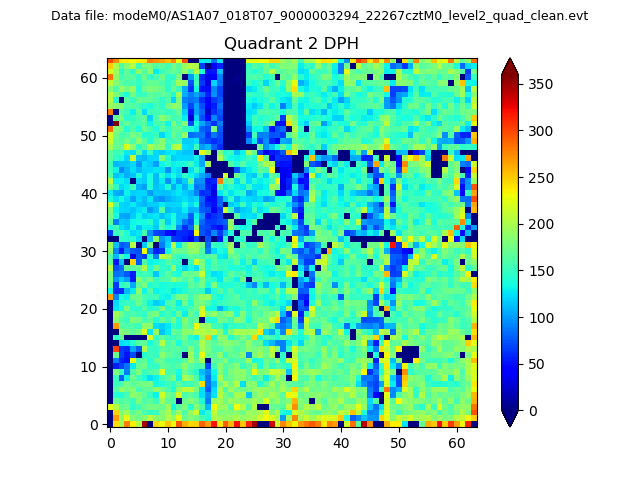
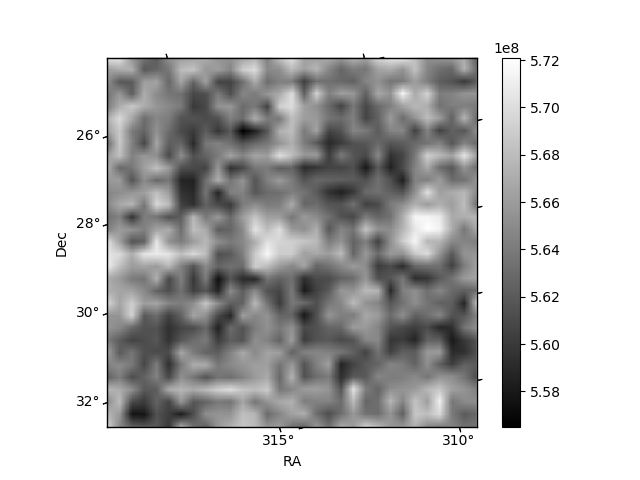
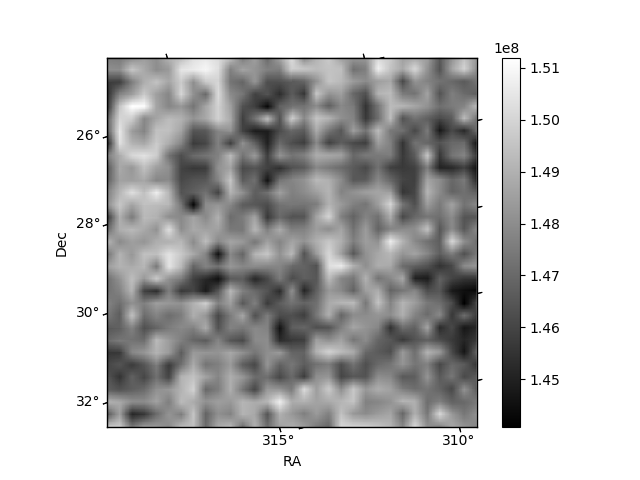
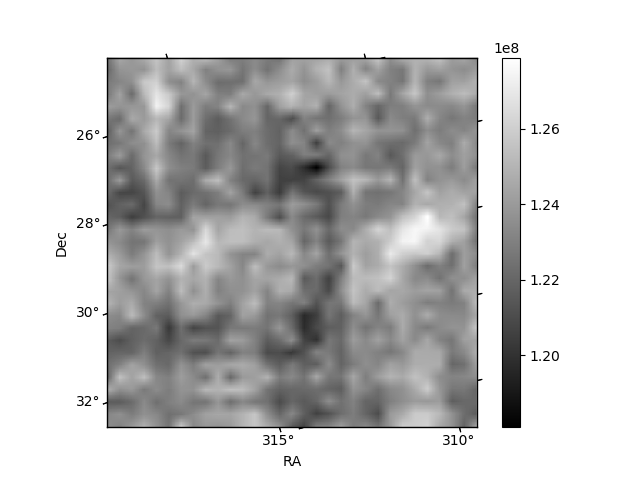
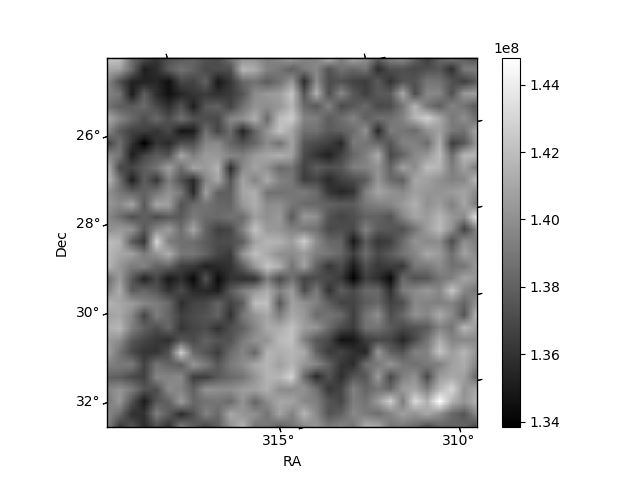
Histogram calculated using DETX and DETY for each event in the final _common_clean file
| Quadrant A | 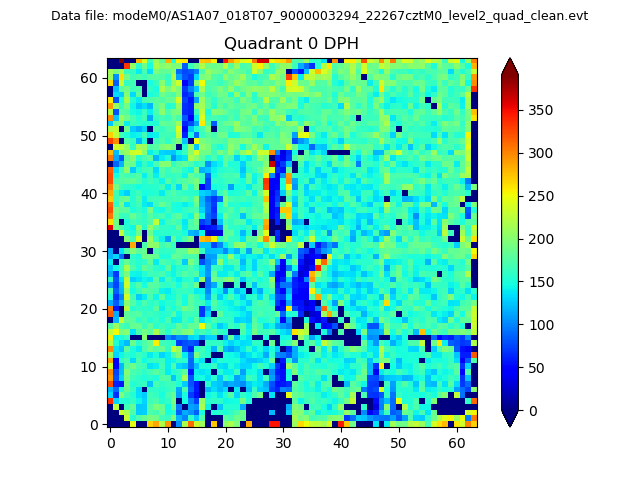 |
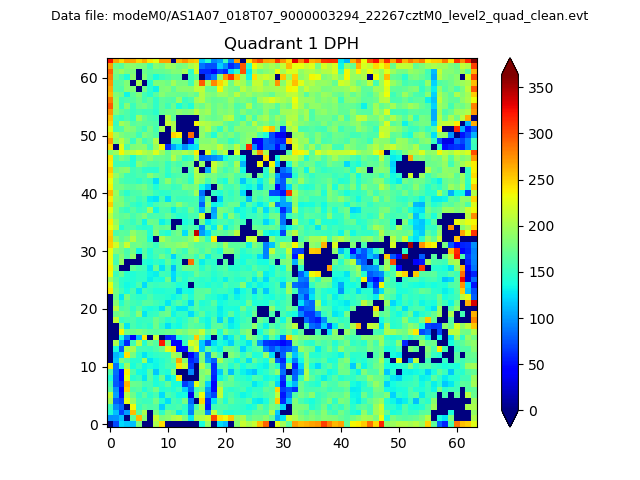 |
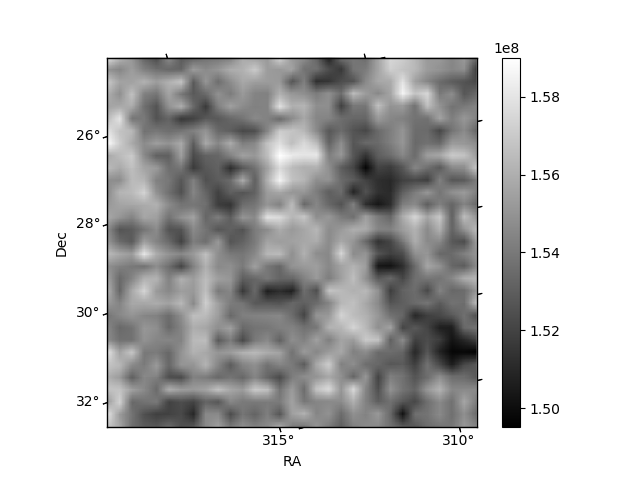
Quadrant B |
|---|---|---|---|
| Quadrant D | 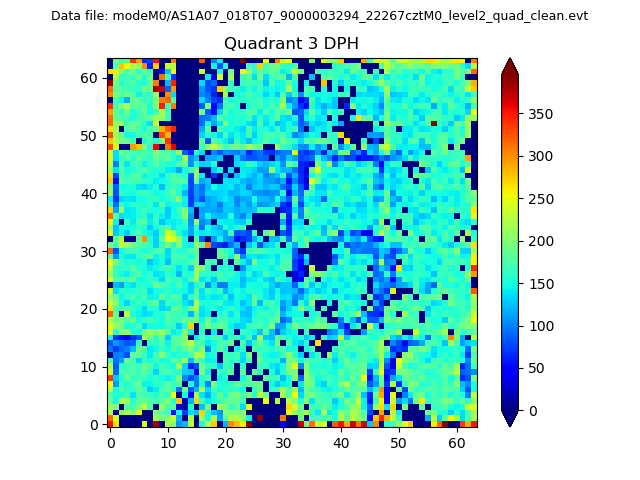 |
 |
Quadrant C |
| Plot type | Count rate plots | Images |
|---|---|---|
| Comparison with Poisson distribution Blue bars denote a histogram of data divided into 1 sec bins. Red curve is a Poisson curve with rate = median count rate of data. |
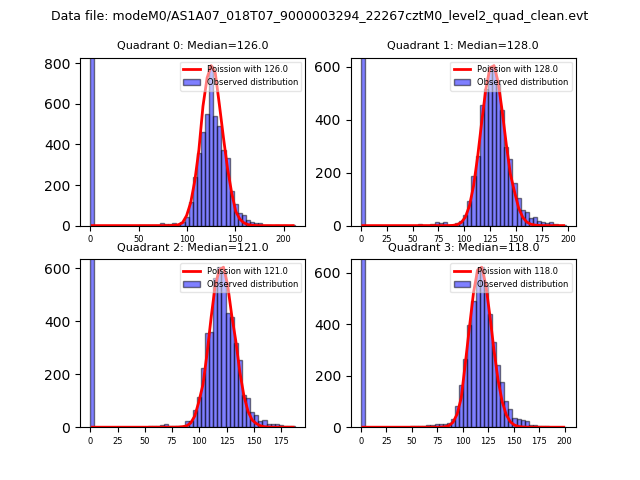 |
 |
| Quadrant-wise count rates Data is divided into 100 sec bins |
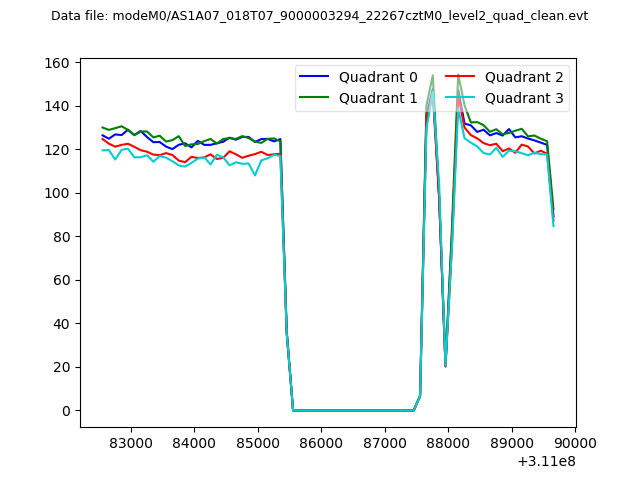 |
|
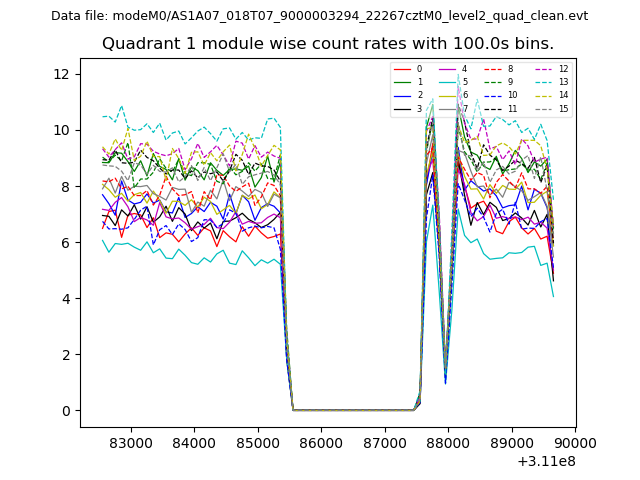
| Module-wise count rates for Quadrant A Data is divided into 100 sec bins |
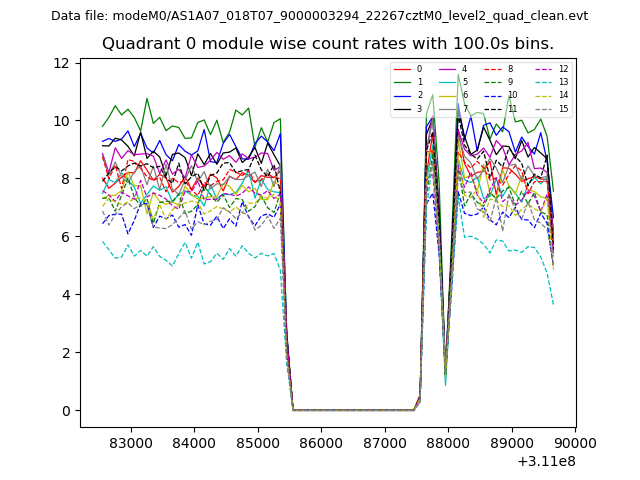 |
 |
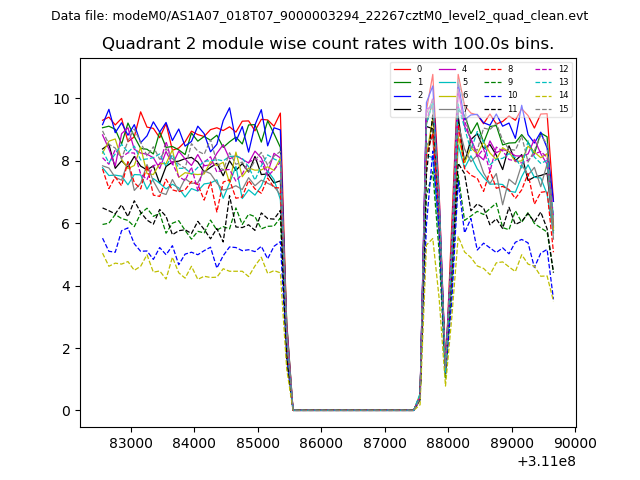
| Module-wise count rates for Quadrant B Data is divided into 100 sec bins |
 |
 |
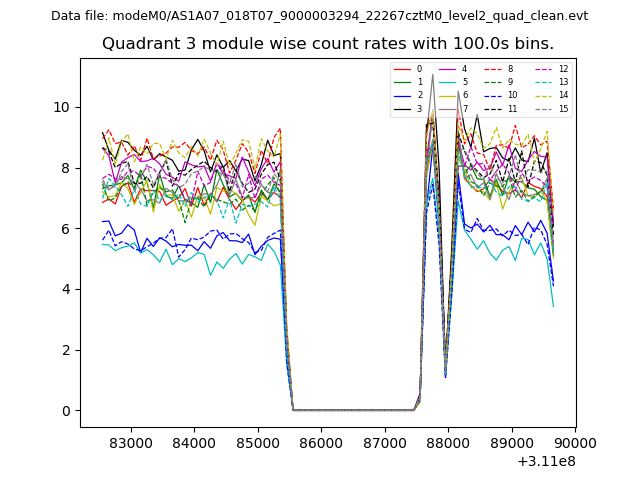
| Module-wise count rates for Quadrant C Data is divided into 100 sec bins |
 |
 |
| Module-wise count rates for Quadrant D Data is divided into 100 sec bins |
 |
 |
| Parameter | Plot |
|---|---|
| CZT HV Monitor | 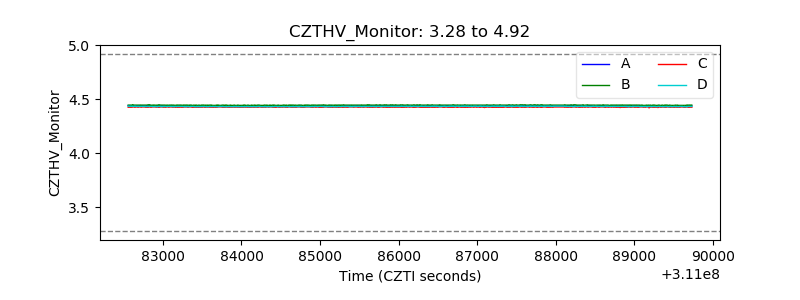 |
| D_VDD | 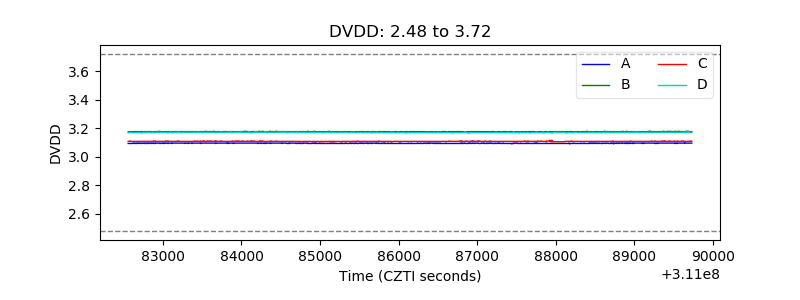 |
| Temperature 1 | 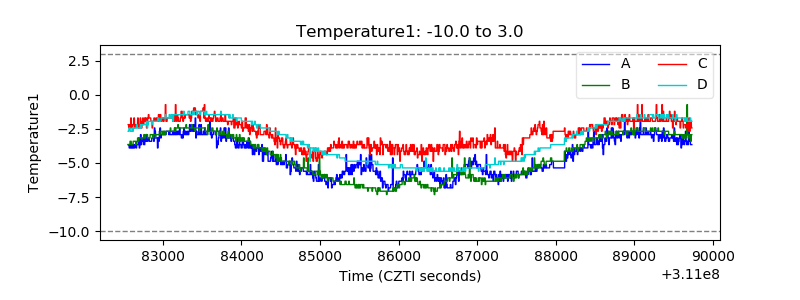 |
| Veto HV Monitor | 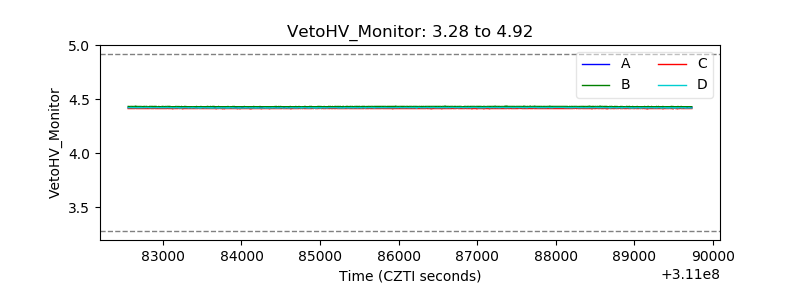 |
| Veto LLD | 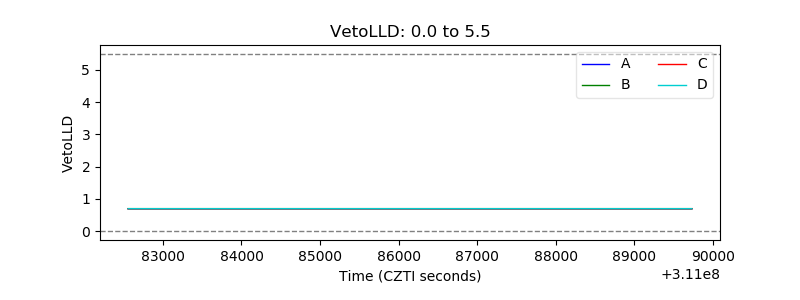 |
| Alpha Counter | 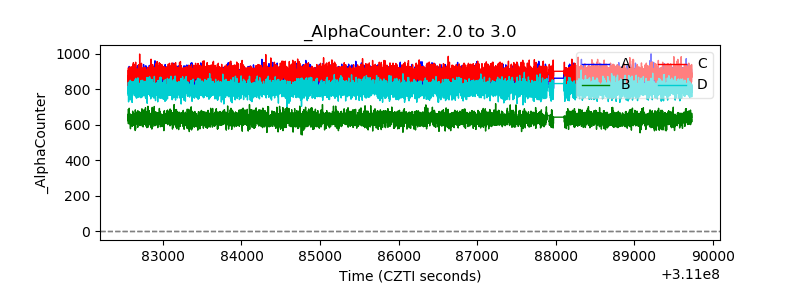 |
| _CPM_Rate | 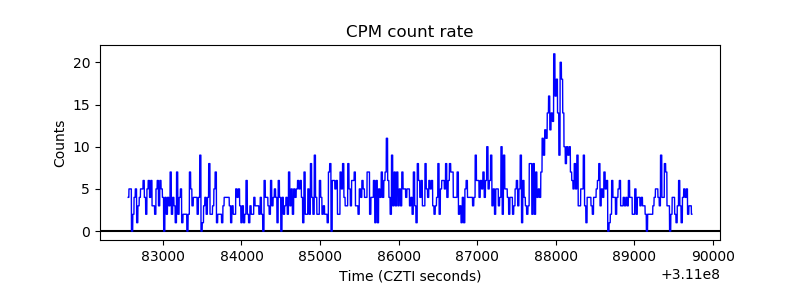 |
| CZT Counter | 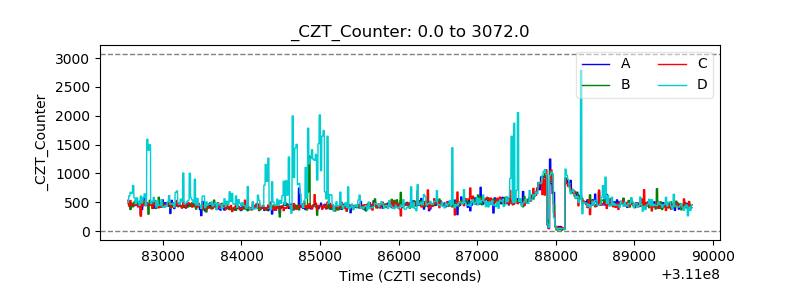 |
| +2.5 Volts monitor |  |
| +5 Volts monitor | 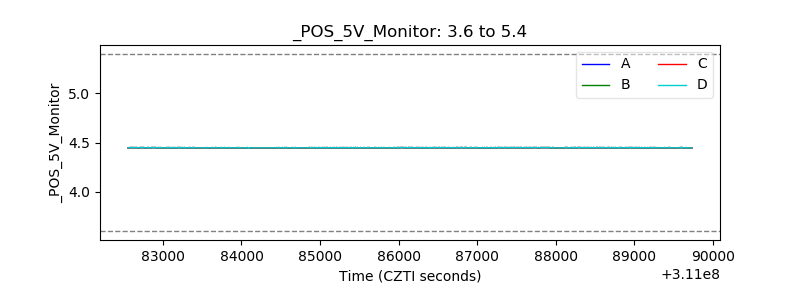 |
| _ROLL_ROT | 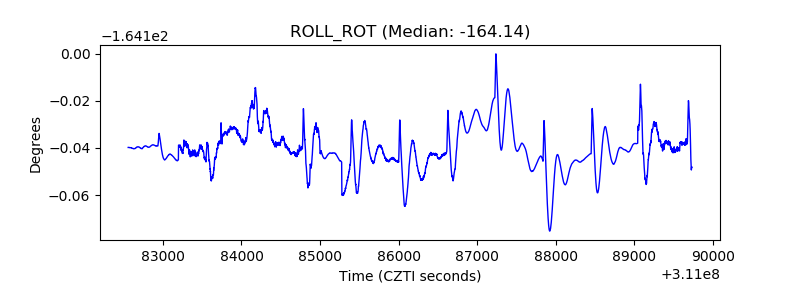 |
| _Roll_DEC | 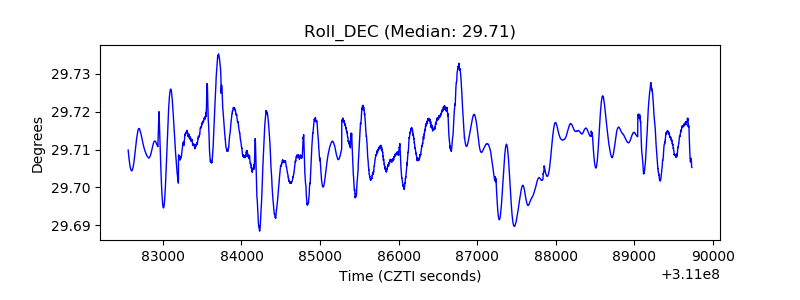 |
| _Roll_RA | 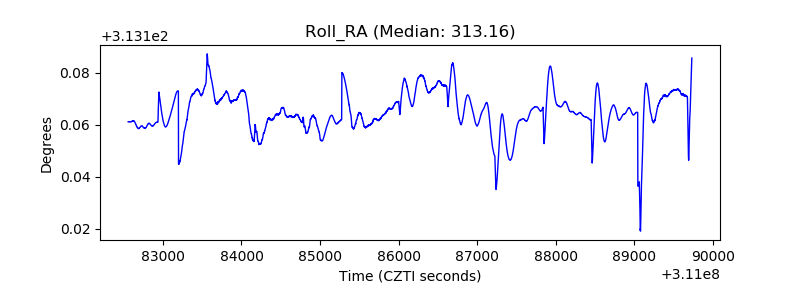 |
| Veto Counter | 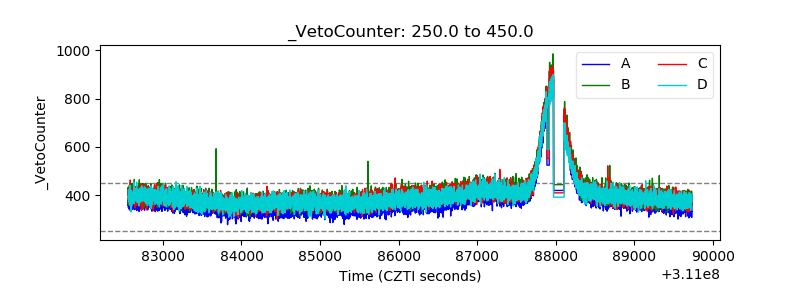 |