| Param | Original file | Final file |
|---|---|---|
| Filename | modeM0/AS1A07_018T07_9000003294_22268cztM0_level2.evt | modeM0/AS1A07_018T07_9000003294_22268cztM0_level2_quad_clean.evt |
| Size (bytes) | 481,993,920 | 100,923,840 |
| Size | 459.7 MB | 96.2 MB |
| Events in quadrant A | 3,417,728 | 651,347 |
| Events in quadrant B | 3,495,856 | 656,054 |
| Events in quadrant C | 3,432,208 | 625,553 |
| Events in quadrant D | 3,752,976 | 612,909 |
| Mode M9 | |||
|---|---|---|---|
| Quadrant | BADHDUFLAG | Total packets | Discarded packets |
| A | 0 | 4 | 0 |
| B | 0 | 4 | 0 |
| C | 0 | 4 | 0 |
| D | 0 | 4 | 0 |
| Mode M0 | |||
|---|---|---|---|
| Quadrant | BADHDUFLAG | Total packets | Discarded packets |
| A | 0 | 15037 | 1 |
| B | 0 | 15155 | 1 |
| C | 0 | 15039 | 1 |
| D | 0 | 16095 | 1 |
| Mode SS | |||
|---|---|---|---|
| Quadrant | BADHDUFLAG | Total packets | Discarded packets |
| A | 0 | 150 | 0 |
| B | 0 | 150 | 0 |
| C | 0 | 150 | 0 |
| D | 0 | 150 | 0 |
| Quadrant | Total seconds | Saturated seconds | Saturation percentage |
|---|---|---|---|
| A | 7330 | 78 | 1.064120% |
| B | 7331 | 91 | 1.241304% |
| C | 7331 | 90 | 1.227663% |
| D | 7331 | 106 | 1.445915% |
Noise dominated data is calculated using 1-second bins in cleaned event files. If a bin has >2000 counts, and if more than 50% of those come from <1% of pixels, then it is considered to be noise-dominated and hence unusable.
| Quadrant | # 1 sec bins | Bins with >0 counts | Bins with >2000 counts | High rate bins dominated by noise | Noise dominated (total time) | Noise dominated (detector-on time) | Marked lightcurve |
|---|---|---|---|---|---|---|---|
| A | 7725 | 7331 | 0 | 0 | 0.00% | 0.00% |  |
| B | 7726 | 7332 | 1 | 1 | 0.01% | 0.01% |  |
| C | 7726 | 7332 | 1 | 1 | 0.01% | 0.01% |  |
| D | 7726 | 7332 | 41 | 41 | 0.53% | 0.56% |  |
Top three noisy pixels from each quadrant. If the there are fewer than three noisy pixels in the level2.evt file, extra rows are filled as -1
| Pixel properties | Quadrant properties | ||||||
|---|---|---|---|---|---|---|---|
| Quadrant | DetID | PixID | Counts | Sigma | Mean | Median | Sigma |
| A | 13 | 254 | 9408 | 47.42 | 887 | 867 | 180.1 |
| A | 3 | 137 | 7860 | 38.83 | 887 | 867 | 180.1 |
| A | 0 | 226 | 7430 | 36.44 | 887 | 867 | 180.1 |
| B | 12 | 111 | 21238 | 120.09 | 878 | 855 | 169.7 |
| B | 11 | 111 | 19007 | 106.94 | 878 | 855 | 169.7 |
| B | 3 | 64 | 18941 | 106.55 | 878 | 855 | 169.7 |
| C | 14 | 238 | 132626 | 662.64 | 845 | 852 | 198.9 |
| C | 10 | 22 | 8387 | 37.89 | 845 | 852 | 198.9 |
| C | 13 | 61 | 5863 | 25.2 | 845 | 852 | 198.9 |
| D | 1 | 52 | 385963 | 1845.58 | 861 | 837 | 208.7 |
| D | 2 | 234 | 31109 | 145.07 | 861 | 837 | 208.7 |
| D | 13 | 172 | 26271 | 121.88 | 861 | 837 | 208.7 |
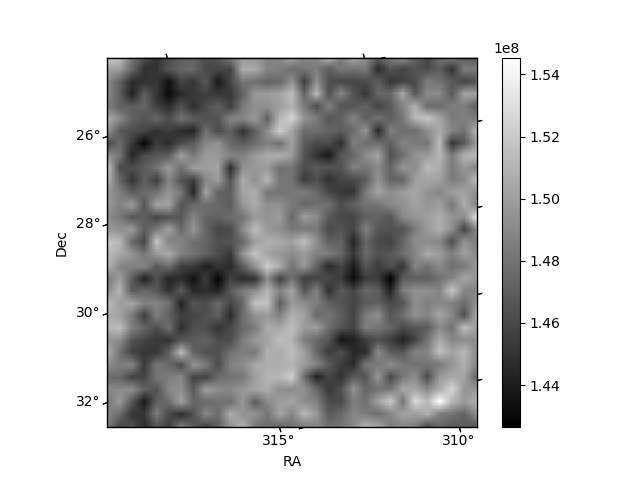
Histogram calculated using DETX and DETY for each event in the final _common_clean file
| Quadrant A | 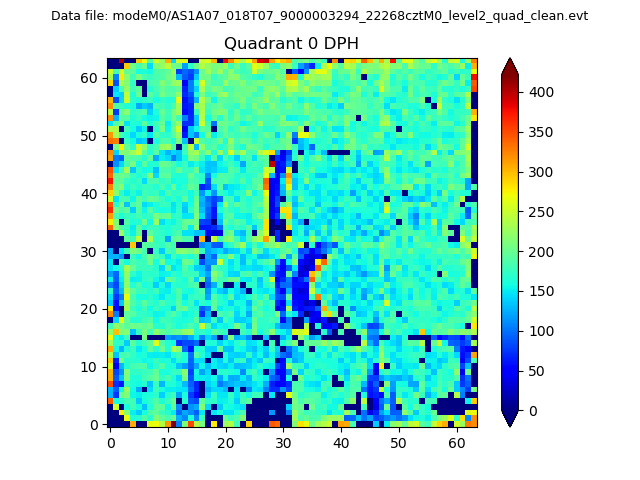 |
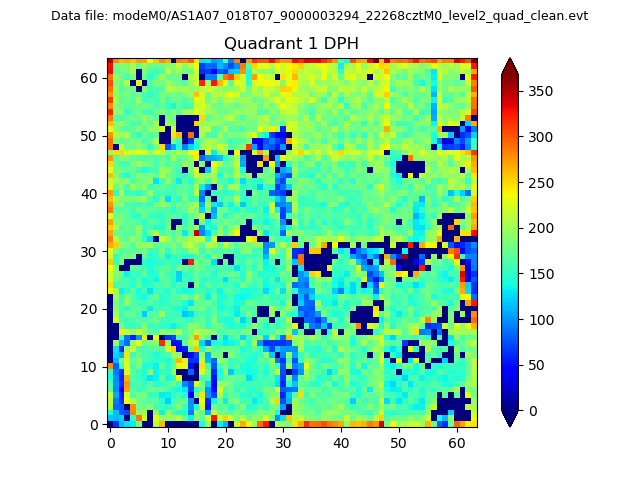 |
Quadrant B |
|---|---|---|---|
| Quadrant D | 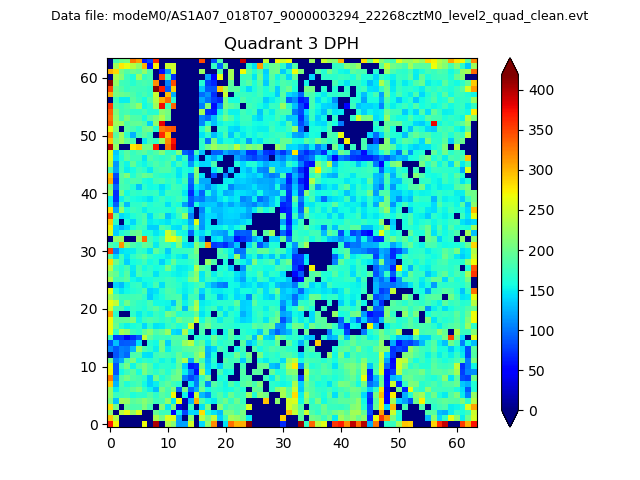 |
 |
Quadrant C |
| Plot type | Count rate plots | Images |
|---|---|---|
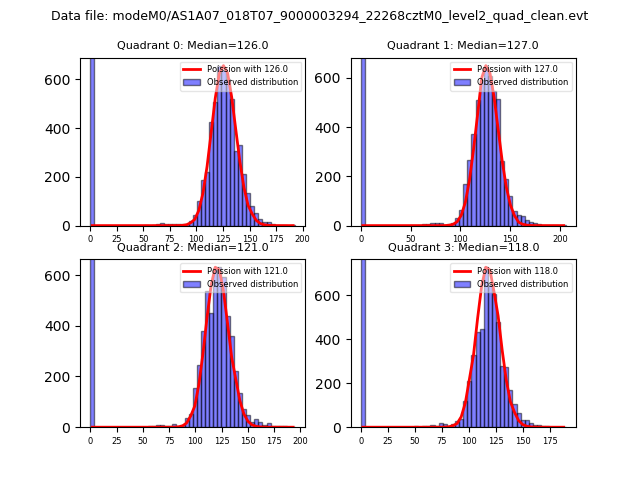
| Comparison with Poisson distribution Blue bars denote a histogram of data divided into 1 sec bins. Red curve is a Poisson curve with rate = median count rate of data. |
 |
 |
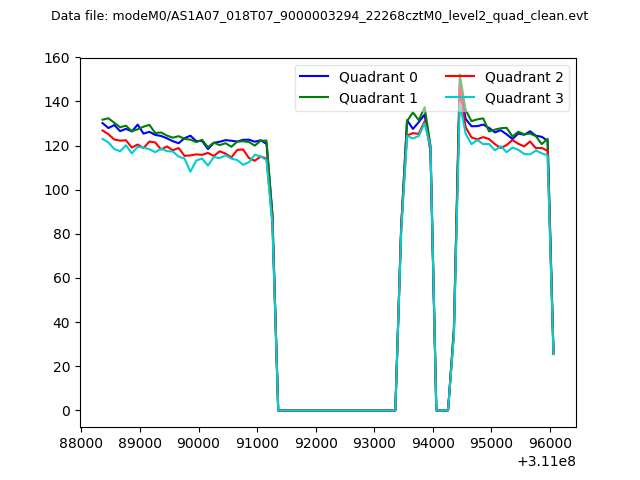
| Quadrant-wise count rates Data is divided into 100 sec bins |
 |
|
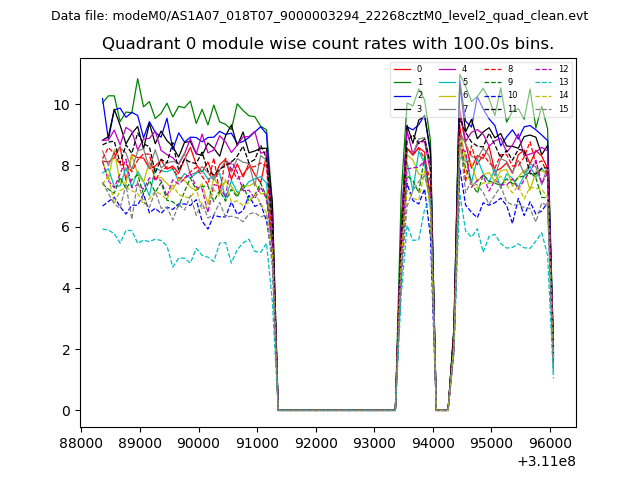
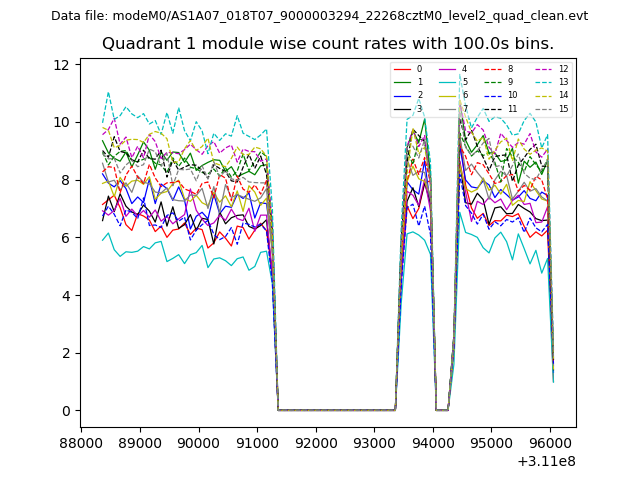
| Module-wise count rates for Quadrant A Data is divided into 100 sec bins |
 |
 |
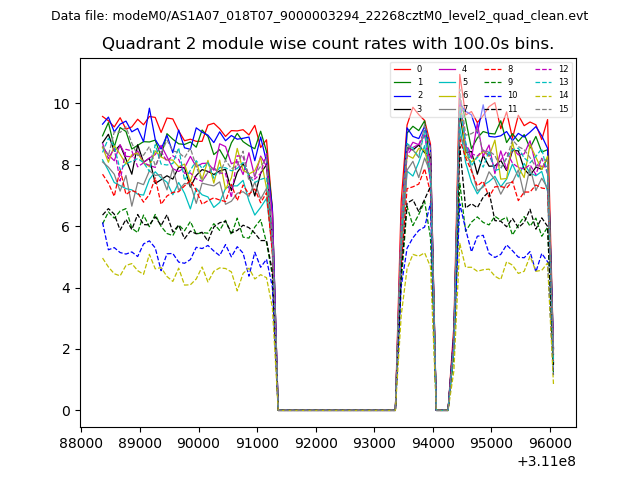
| Module-wise count rates for Quadrant B Data is divided into 100 sec bins |
 |
 |
| Module-wise count rates for Quadrant C Data is divided into 100 sec bins |
 |
 |
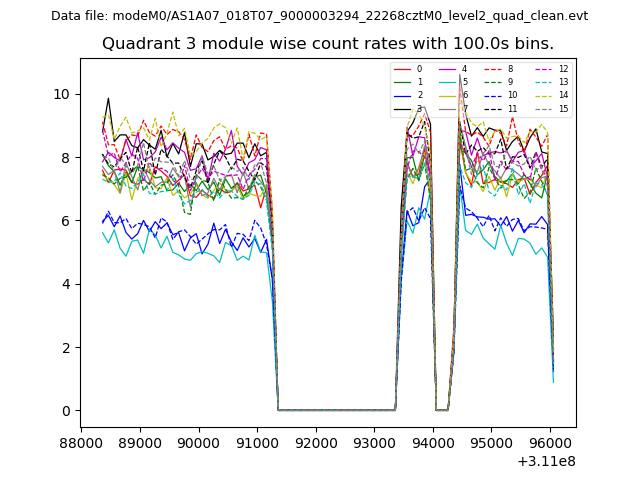
| Module-wise count rates for Quadrant D Data is divided into 100 sec bins |
 |
 |
| Parameter | Plot |
|---|---|
| CZT HV Monitor | 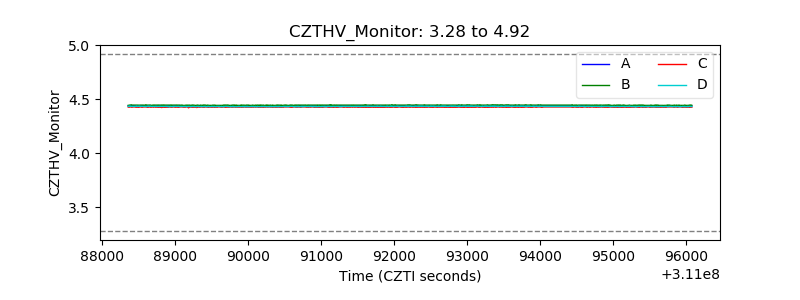 |
| D_VDD | 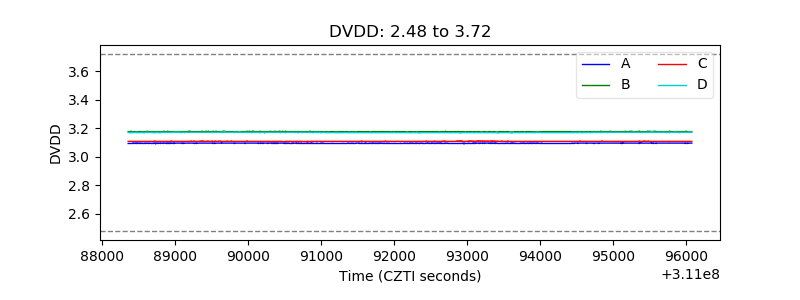 |
| Temperature 1 | 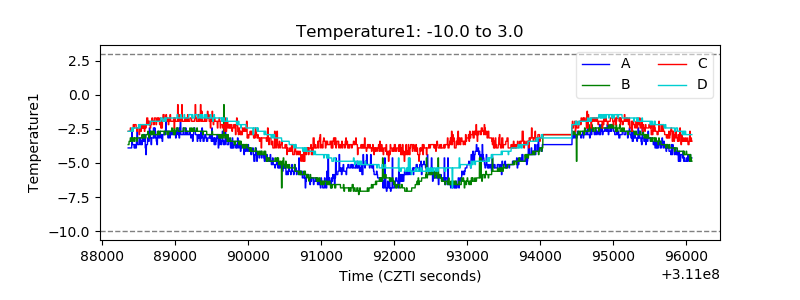 |
| Veto HV Monitor | 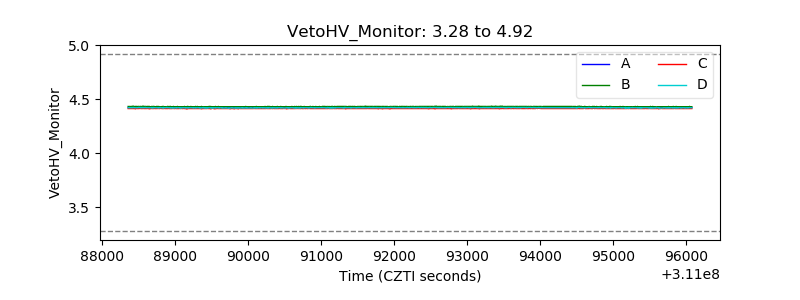 |
| Veto LLD | 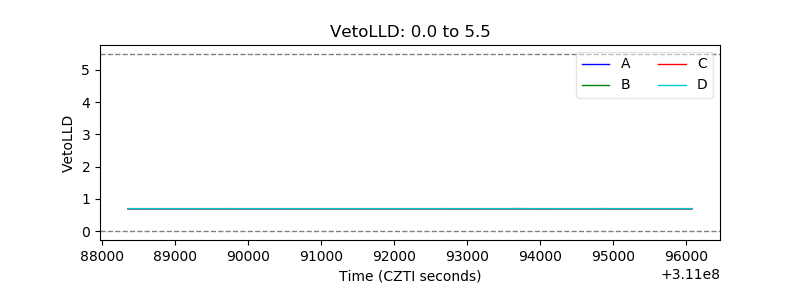 |
| Alpha Counter | 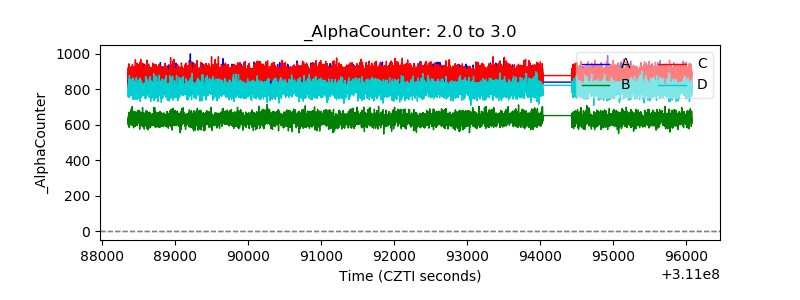 |
| _CPM_Rate | 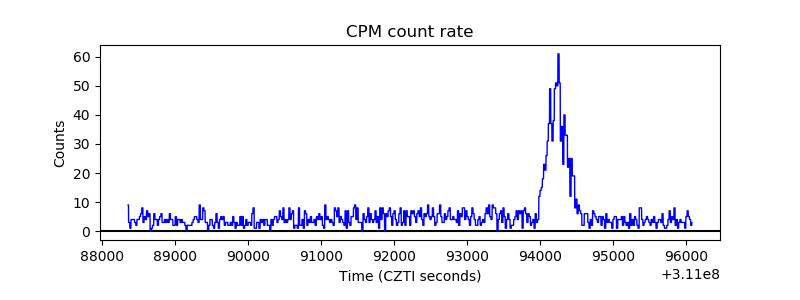 |
| CZT Counter | 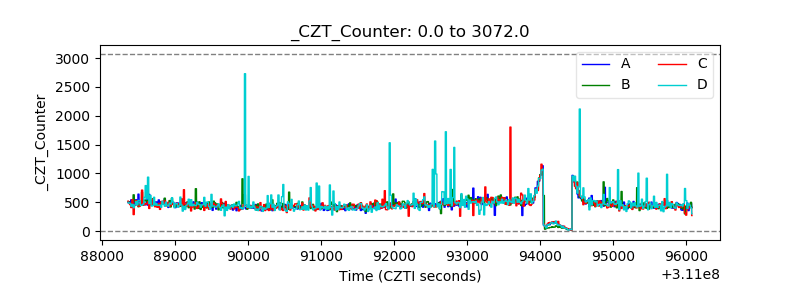 |
| +2.5 Volts monitor |  |
| +5 Volts monitor | 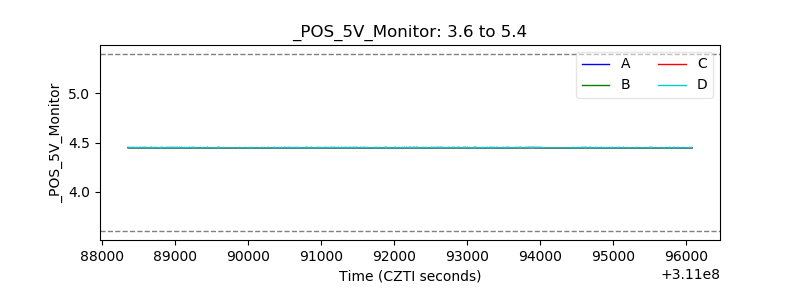 |
| _ROLL_ROT | 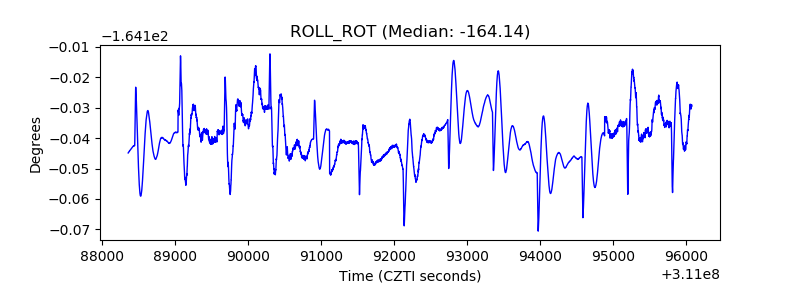 |
| _Roll_DEC | 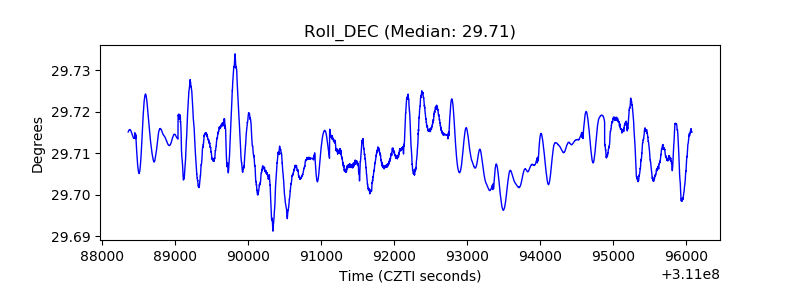 |
| _Roll_RA | 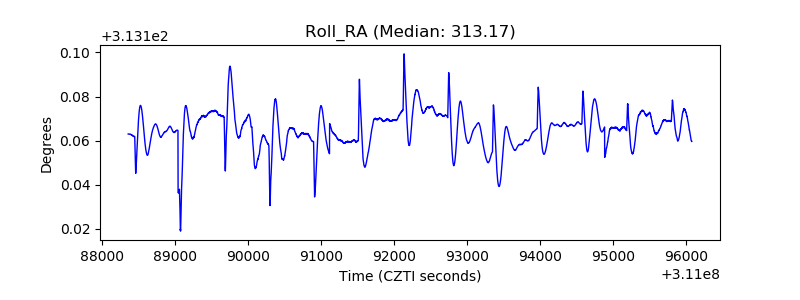 |
| Veto Counter | 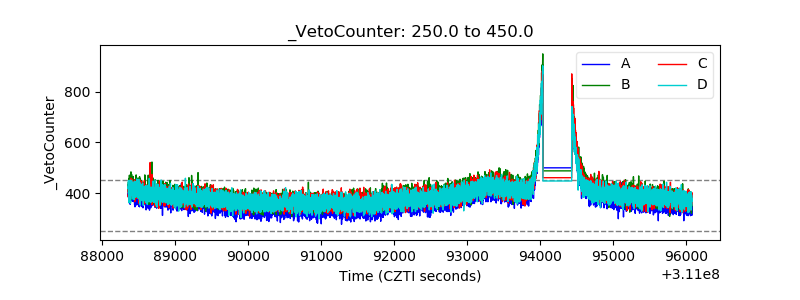 |