| Param | Original file | Final file |
|---|---|---|
| Filename | modeM0/AS1A07_018T08_9000003296cztM0_level2.fits | modeM0/AS1A07_018T08_9000003296cztM0_level2_quad_clean.evt |
| Size (bytes) | 1,131,140,160 | 998,409,600 |
| Size | 1.1 GB | 952.2 MB |
| Events in quadrant A | 7,125,420 | 5,968,759 |
| Events in quadrant B | 6,844,636 | 6,027,637 |
| Events in quadrant C | 6,813,208 | 5,602,569 |
| Events in quadrant D | 5,880,558 | 5,043,707 |
| Mode M9 | |||
|---|---|---|---|
| Quadrant | BADHDUFLAG | Total packets | Discarded packets |
| A | 0 | 205 | 0 |
| B | 0 | 206 | 0 |
| C | 0 | 206 | 0 |
| D | 0 | 206 | 0 |
| Mode M0 | |||
|---|---|---|---|
| Quadrant | BADHDUFLAG | Total packets | Discarded packets |
| A | 0 | 230888 | 0 |
| B | 0 | 235957 | 0 |
| C | 0 | 234981 | 0 |
| D | 0 | 283221 | 0 |
| Mode SS | |||
|---|---|---|---|
| Quadrant | BADHDUFLAG | Total packets | Discarded packets |
| A | 0 | 2256 | 0 |
| B | 0 | 2256 | 0 |
| C | 0 | 2256 | 0 |
| D | 0 | 2256 | 0 |
| Quadrant | Total seconds | Saturated seconds | Saturation percentage |
|---|---|---|---|
| A | 110792 | 1351 | 1.219402% |
| B | 110793 | 1786 | 1.612015% |
| C | 110793 | 2053 | 1.853005% |
| D | 110793 | 4366 | 3.940682% |
Noise dominated data is calculated using 1-second bins in cleaned event files. If a bin has >2000 counts, and if more than 50% of those come from <1% of pixels, then it is considered to be noise-dominated and hence unusable.
| Quadrant | # 1 sec bins | Bins with >0 counts | Bins with >2000 counts | High rate bins dominated by noise | Noise dominated (total time) | Noise dominated (detector-on time) | Marked lightcurve |
|---|---|---|---|---|---|---|---|
| A | 141864 | 110791 | 0 | 0 | 0.00% | 0.00% |  |
| B | 141865 | 110792 | 0 | 0 | 0.00% | 0.00% |  |
| C | 141865 | 110794 | 0 | 0 | 0.00% | 0.00% |  |
| D | 141865 | 110737 | 0 | 0 | 0.00% | 0.00% | 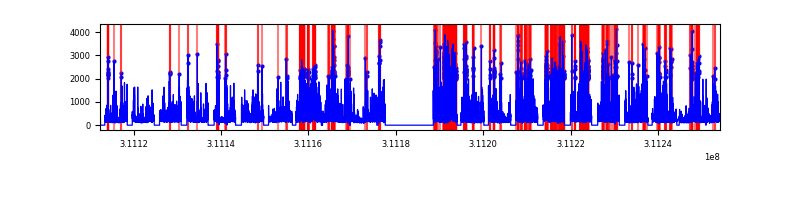 |
Top three noisy pixels from each quadrant. If the there are fewer than three noisy pixels in the level2.evt file, extra rows are filled as -1
| Pixel properties | Quadrant properties | ||||||
|---|---|---|---|---|---|---|---|
| Quadrant | DetID | PixID | Counts | Sigma | Mean | Median | Sigma |
| A | 0 | 29 | 6778 | 11.05 | 1856 | 1740 | 455.9 |
| A | 7 | 110 | 5608 | 8.49 | 1856 | 1740 | 455.9 |
| A | 0 | 30 | 5258 | 7.72 | 1856 | 1740 | 455.9 |
| B | 2 | 9 | 5366 | 10.37 | 1809 | 1731 | 350.6 |
| B | 2 | 8 | 4600 | 8.18 | 1809 | 1731 | 350.6 |
| B | 5 | 225 | 4363 | 7.51 | 1809 | 1731 | 350.6 |
| C | 12 | 241 | 4756 | 6.69 | 1798 | 1682 | 459.3 |
| C | 3 | 234 | 4728 | 6.63 | 1798 | 1682 | 459.3 |
| C | 3 | 126 | 4590 | 6.33 | 1798 | 1682 | 459.3 |
| D | 3 | 14 | 4215 | 6.1 | 1675 | 1525 | 441.0 |
| D | 15 | 46 | 4190 | 6.04 | 1675 | 1525 | 441.0 |
| D | 6 | 231 | 4127 | 5.9 | 1675 | 1525 | 441.0 |
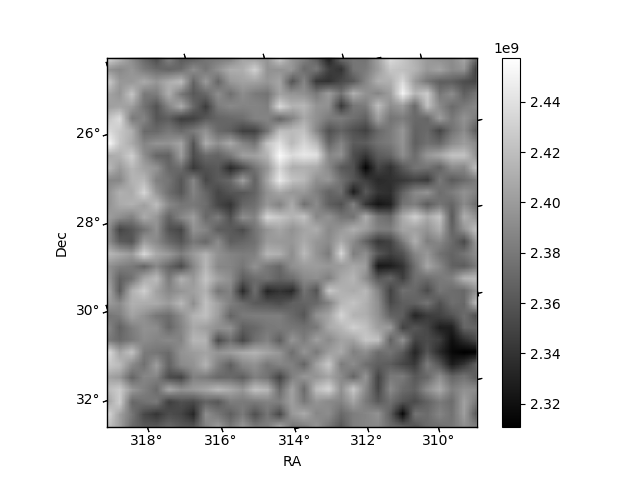
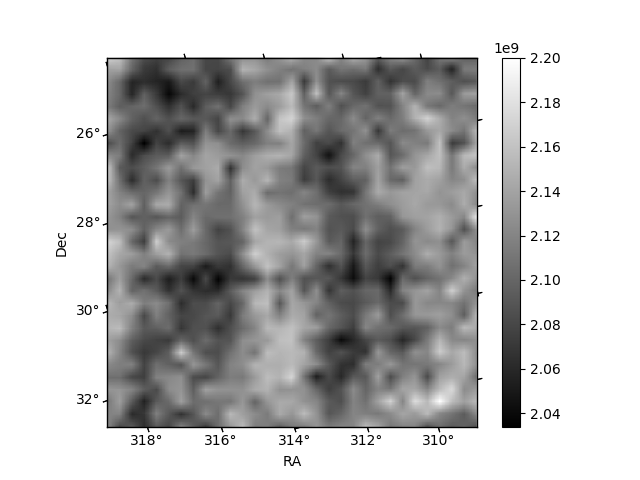
Histogram calculated using DETX and DETY for each event in the final _common_clean file
| Quadrant A | 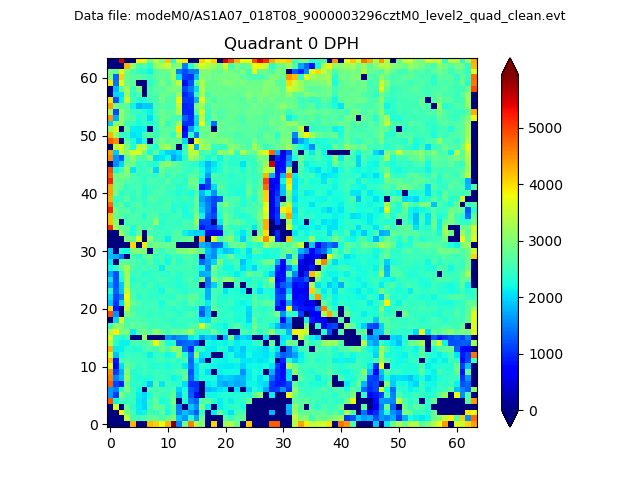 |
 |
Quadrant B |
|---|---|---|---|
| Quadrant D | 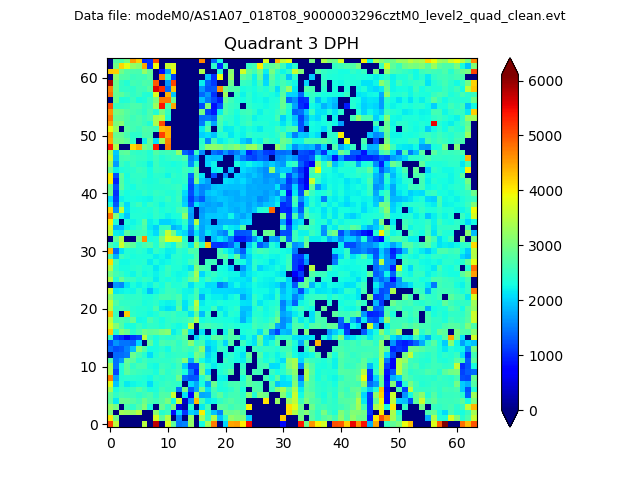 |
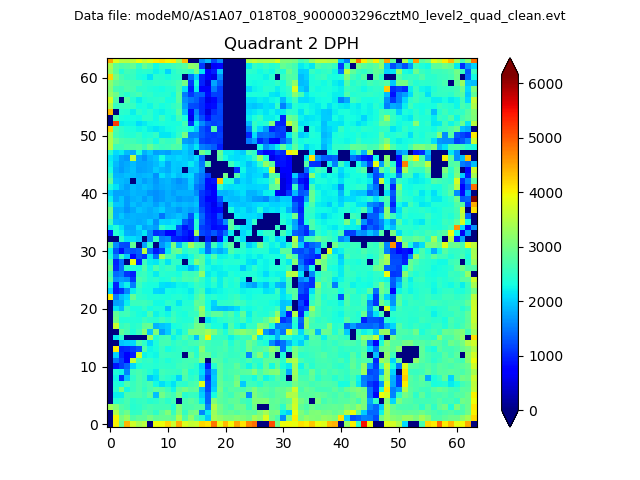 |
Quadrant C |
| Plot type | Count rate plots | Images |
|---|---|---|
| Comparison with Poisson distribution Blue bars denote a histogram of data divided into 1 sec bins. Red curve is a Poisson curve with rate = median count rate of data. |
 |
 |
| Quadrant-wise count rates Data is divided into 100 sec bins |
 |
|
| Module-wise count rates for Quadrant A Data is divided into 100 sec bins |
 |
 |
| Module-wise count rates for Quadrant B Data is divided into 100 sec bins |
 |
 |
| Module-wise count rates for Quadrant C Data is divided into 100 sec bins |
 |
 |
| Module-wise count rates for Quadrant D Data is divided into 100 sec bins |
 |
 |
| Parameter | Plot |
|---|---|
| CZT HV Monitor |  |
| D_VDD |  |
| Temperature 1 |  |
| Veto HV Monitor |  |
| Veto LLD | 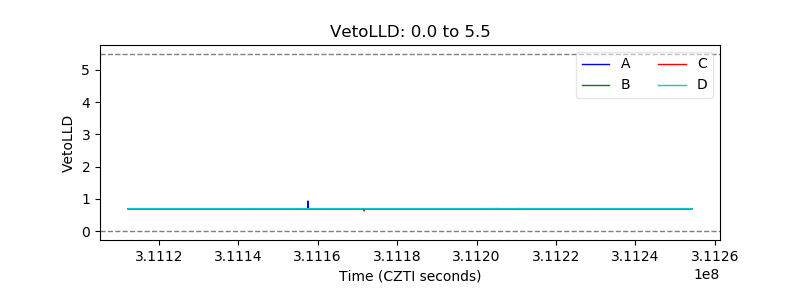 |
| Alpha Counter |  |
| _CPM_Rate |  |
| CZT Counter | 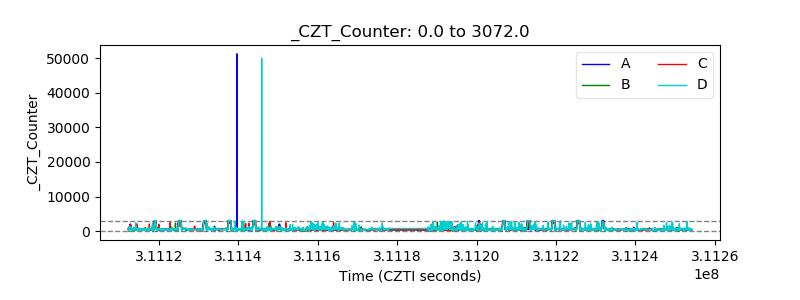 |
| +2.5 Volts monitor |  |
| +5 Volts monitor |  |
| _ROLL_ROT | 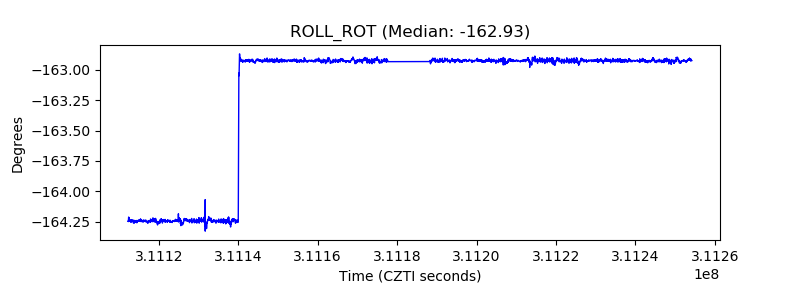 |
| _Roll_DEC |  |
| _Roll_RA |  |
| Veto Counter |  |