| Param | Original file | Final file |
|---|---|---|
| Filename | modeM0/AS1A07_018T08_9000003296_22274cztM0_level2.evt | modeM0/AS1A07_018T08_9000003296_22274cztM0_level2_quad_clean.evt |
| Size (bytes) | 457,845,120 | 79,087,680 |
| Size | 436.6 MB | 75.4 MB |
| Events in quadrant A | 3,269,236 | 494,047 |
| Events in quadrant B | 3,418,628 | 509,820 |
| Events in quadrant C | 3,349,764 | 473,829 |
| Events in quadrant D | 3,383,246 | 460,257 |
| Mode M9 | |||
|---|---|---|---|
| Quadrant | BADHDUFLAG | Total packets | Discarded packets |
| A | 0 | 18 | 0 |
| B | 0 | 19 | 0 |
| C | 0 | 19 | 0 |
| D | 0 | 19 | 0 |
| Mode M0 | |||
|---|---|---|---|
| Quadrant | BADHDUFLAG | Total packets | Discarded packets |
| A | 0 | 13714 | 2 |
| B | 0 | 14184 | 2 |
| C | 0 | 14012 | 2 |
| D | 0 | 14300 | 2 |
| Mode SS | |||
|---|---|---|---|
| Quadrant | BADHDUFLAG | Total packets | Discarded packets |
| A | 0 | 132 | 0 |
| B | 0 | 132 | 0 |
| C | 0 | 132 | 0 |
| D | 0 | 132 | 0 |
| Quadrant | Total seconds | Saturated seconds | Saturation percentage |
|---|---|---|---|
| A | 6555 | 19 | 0.289855% |
| B | 6555 | 49 | 0.747521% |
| C | 6555 | 64 | 0.976354% |
| D | 6555 | 21 | 0.320366% |
Noise dominated data is calculated using 1-second bins in cleaned event files. If a bin has >2000 counts, and if more than 50% of those come from <1% of pixels, then it is considered to be noise-dominated and hence unusable.
| Quadrant | # 1 sec bins | Bins with >0 counts | Bins with >2000 counts | High rate bins dominated by noise | Noise dominated (total time) | Noise dominated (detector-on time) | Marked lightcurve |
|---|---|---|---|---|---|---|---|
| A | 7785 | 6556 | 0 | 0 | 0.00% | 0.00% | 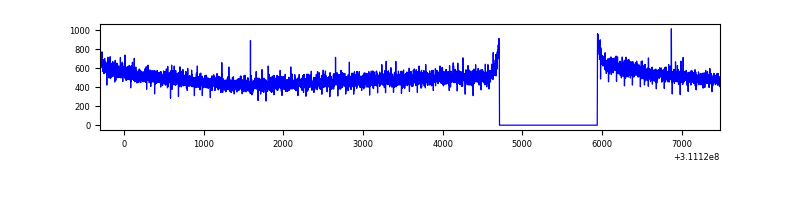 |
| B | 7785 | 6556 | 10 | 10 | 0.13% | 0.15% | 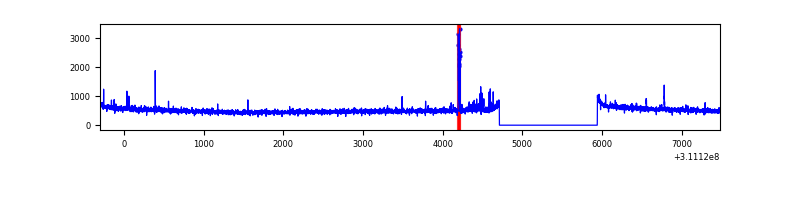 |
| C | 7785 | 6556 | 4 | 4 | 0.05% | 0.06% | 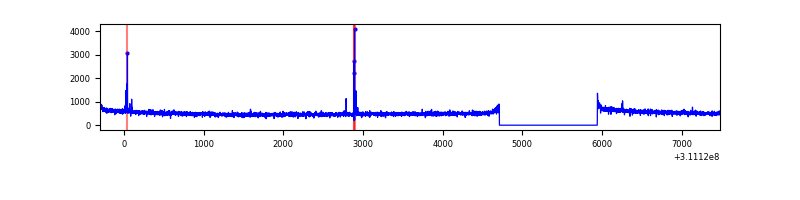 |
| D | 7785 | 6556 | 4 | 4 | 0.05% | 0.06% | 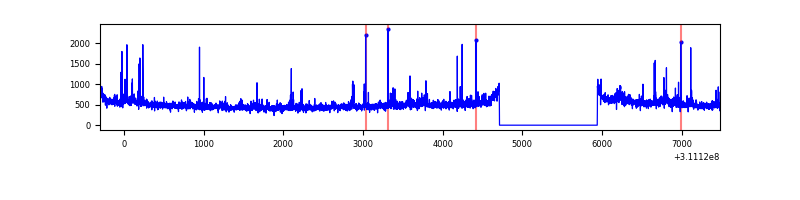 |
Top three noisy pixels from each quadrant. If the there are fewer than three noisy pixels in the level2.evt file, extra rows are filled as -1
| Pixel properties | Quadrant properties | ||||||
|---|---|---|---|---|---|---|---|
| Quadrant | DetID | PixID | Counts | Sigma | Mean | Median | Sigma |
| A | 13 | 254 | 9407 | 50.59 | 849 | 833 | 169.5 |
| A | 0 | 226 | 7319 | 38.27 | 849 | 833 | 169.5 |
| A | 3 | 137 | 7122 | 37.11 | 849 | 833 | 169.5 |
| B | 4 | 171 | 58921 | 365.05 | 852 | 833 | 159.1 |
| B | 3 | 64 | 24677 | 149.84 | 852 | 833 | 159.1 |
| B | 12 | 111 | 19192 | 115.37 | 852 | 833 | 159.1 |
| C | 14 | 238 | 130575 | 683.96 | 816 | 823 | 189.7 |
| C | 10 | 22 | 32760 | 168.35 | 816 | 823 | 189.7 |
| C | 13 | 61 | 5617 | 25.27 | 816 | 823 | 189.7 |
| D | 1 | 52 | 177913 | 898.99 | 819 | 797 | 197.0 |
| D | 2 | 136 | 43650 | 217.51 | 819 | 797 | 197.0 |
| D | 2 | 234 | 25008 | 122.89 | 819 | 797 | 197.0 |
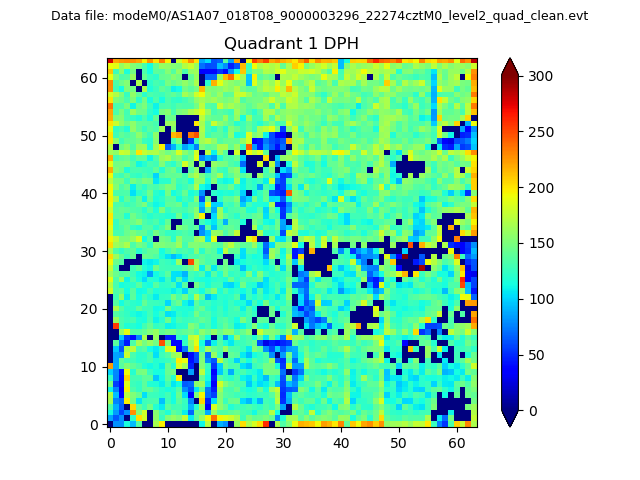
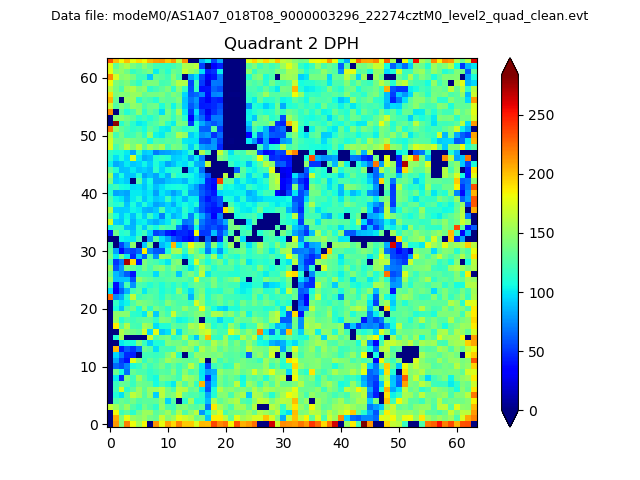
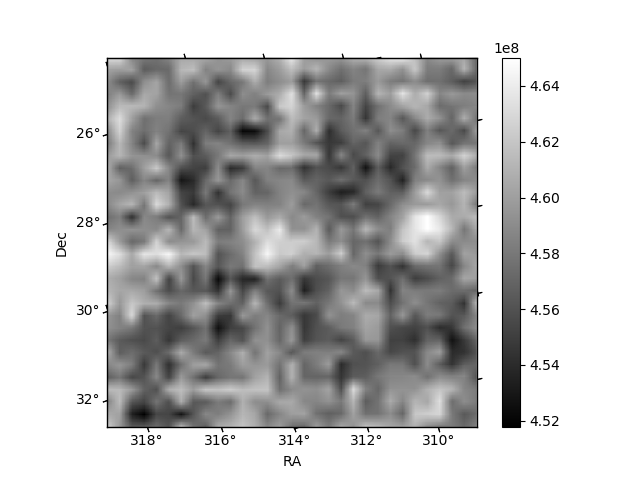
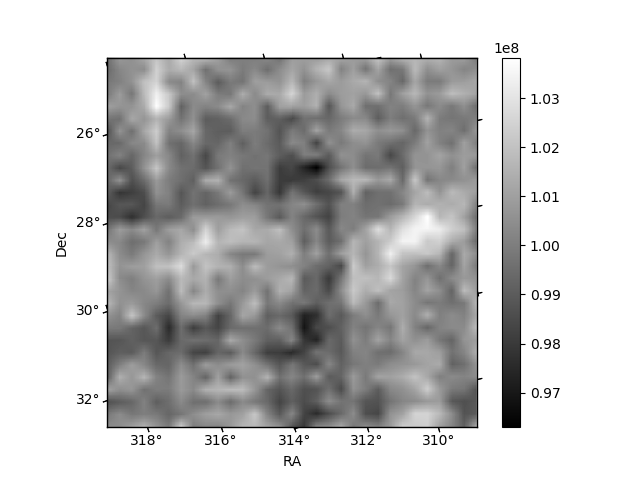
Histogram calculated using DETX and DETY for each event in the final _common_clean file
| Quadrant A | 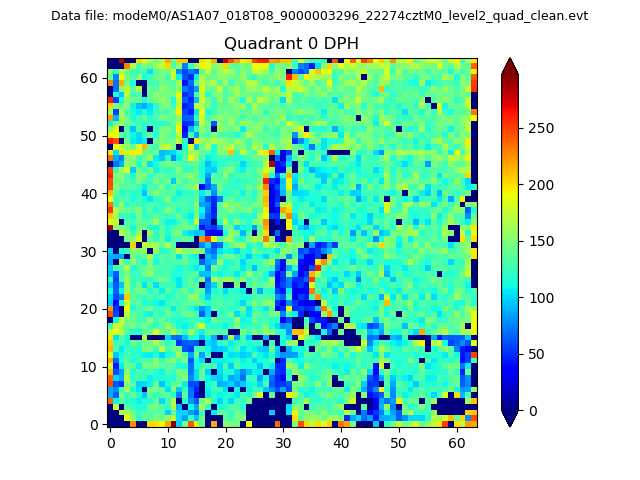 |
 |
Quadrant B |
|---|---|---|---|
| Quadrant D |  |
 |
Quadrant C |
| Plot type | Count rate plots | Images |
|---|---|---|
| Comparison with Poisson distribution Blue bars denote a histogram of data divided into 1 sec bins. Red curve is a Poisson curve with rate = median count rate of data. |
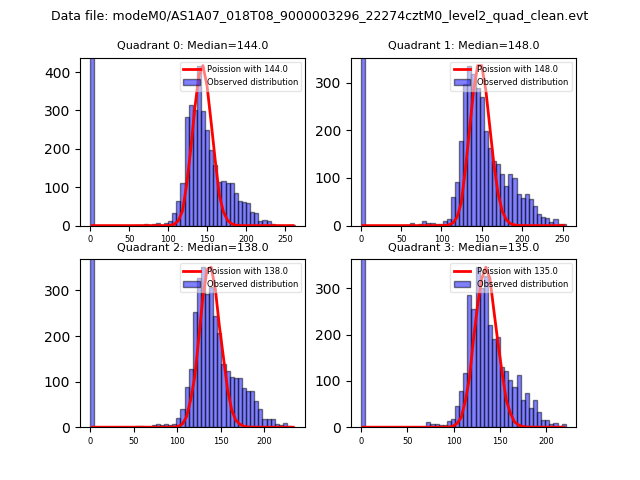 |
 |
| Quadrant-wise count rates Data is divided into 100 sec bins |
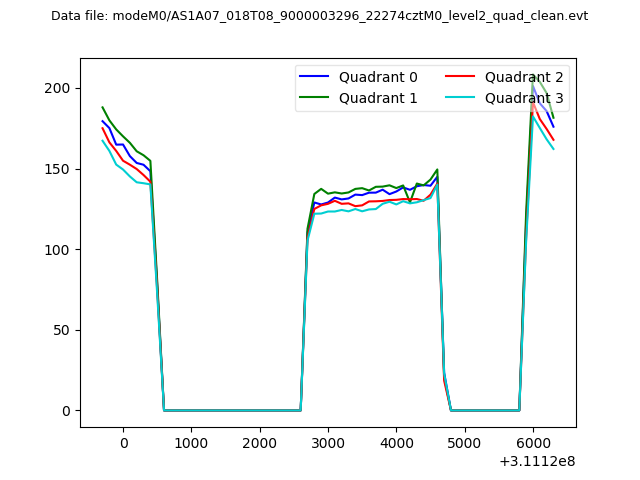 |
|
| Module-wise count rates for Quadrant A Data is divided into 100 sec bins |
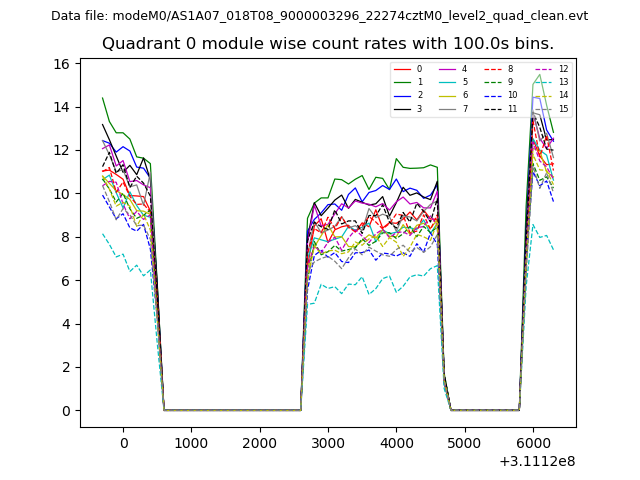 |
 |
| Module-wise count rates for Quadrant B Data is divided into 100 sec bins |
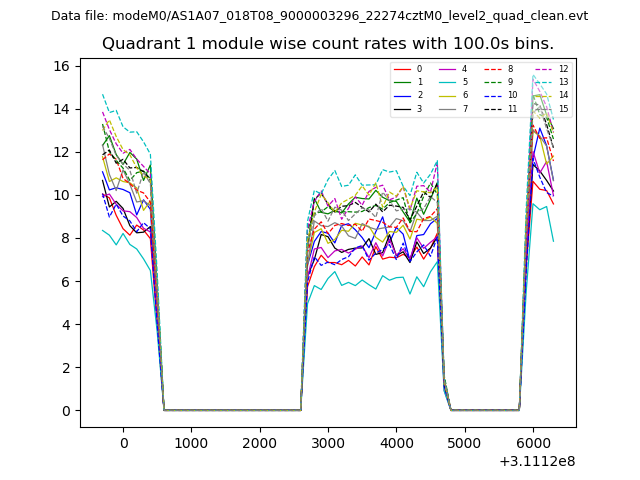 |
 |
| Module-wise count rates for Quadrant C Data is divided into 100 sec bins |
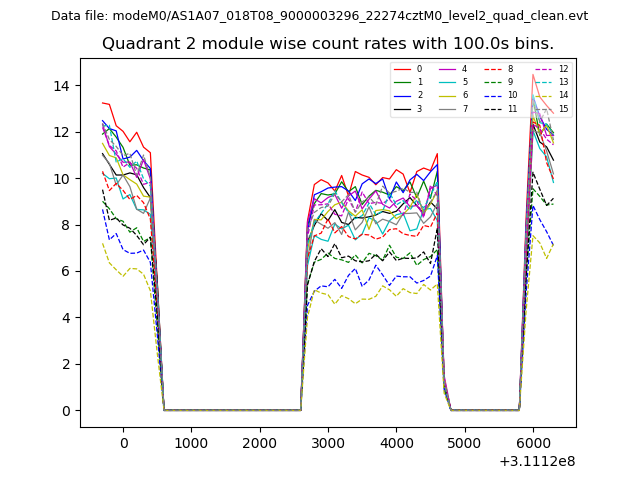 |
 |
| Module-wise count rates for Quadrant D Data is divided into 100 sec bins |
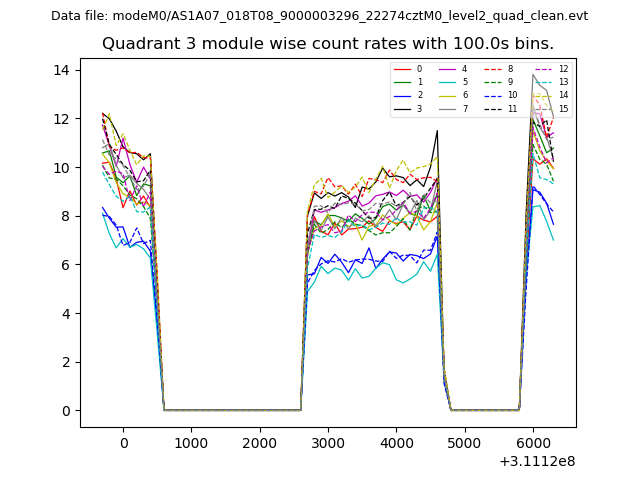 |
 |
| Parameter | Plot |
|---|---|
| CZT HV Monitor | 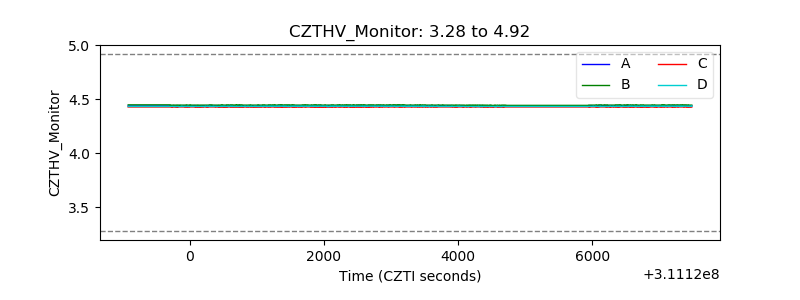 |
| D_VDD | 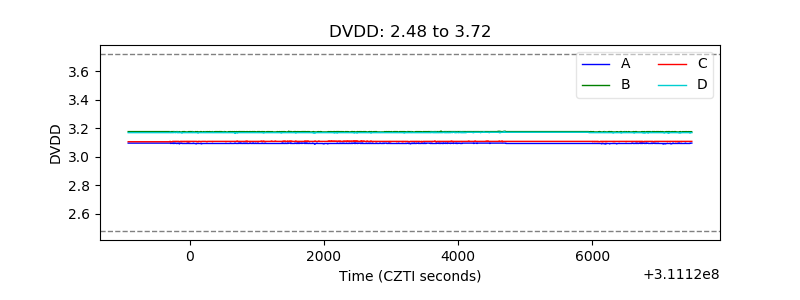 |
| Temperature 1 | 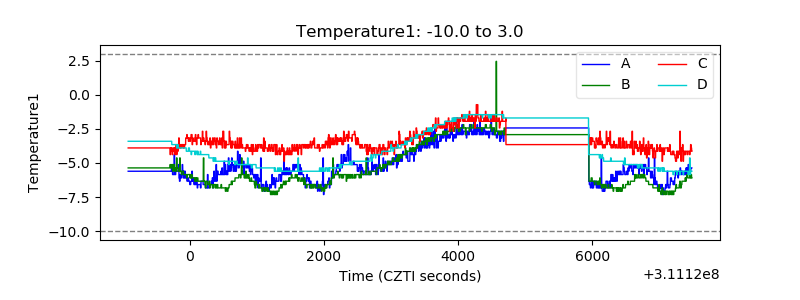 |
| Veto HV Monitor | 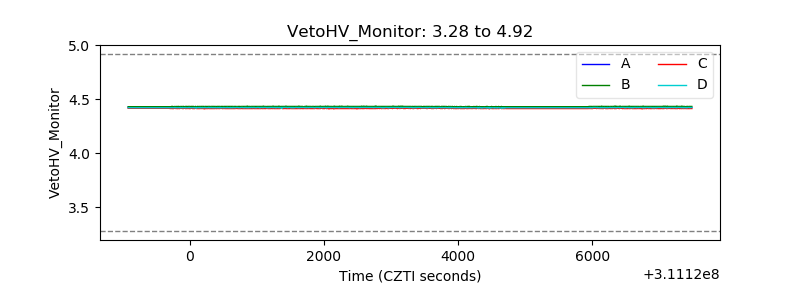 |
| Veto LLD | 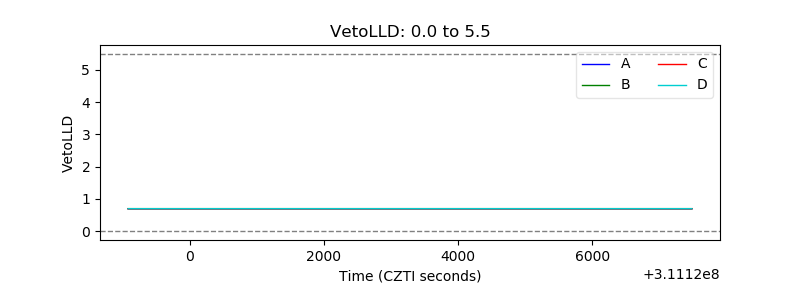 |
| Alpha Counter | 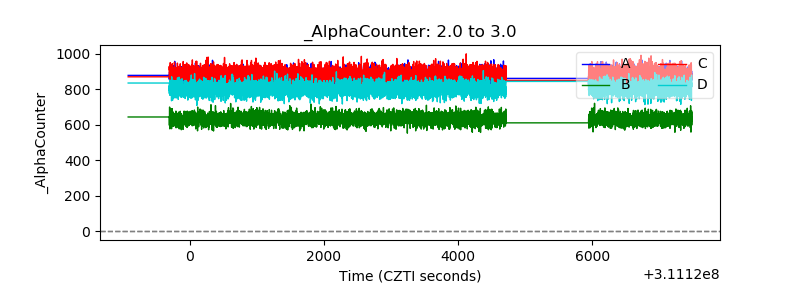 |
| _CPM_Rate | 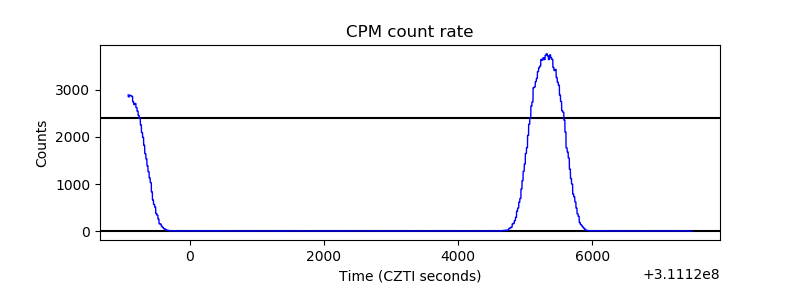 |
| CZT Counter | 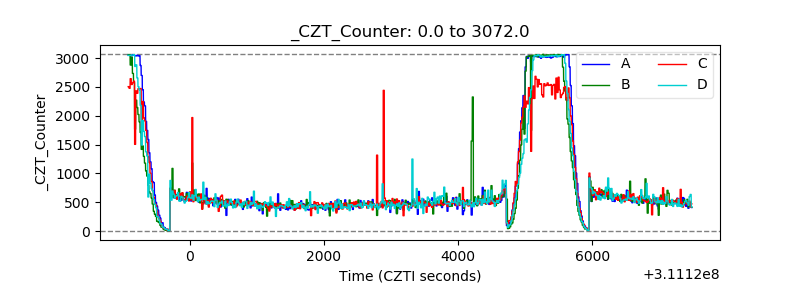 |
| +2.5 Volts monitor |  |
| +5 Volts monitor |  |
| _ROLL_ROT | 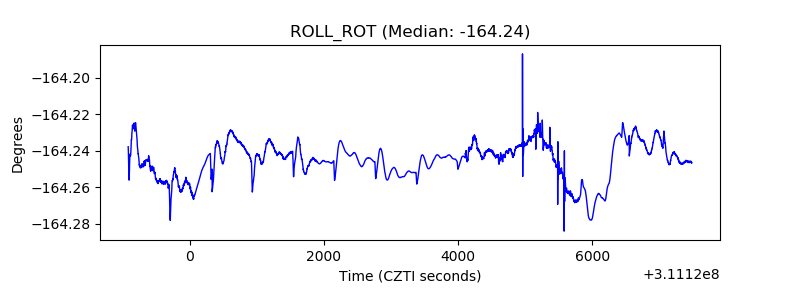 |
| _Roll_DEC | 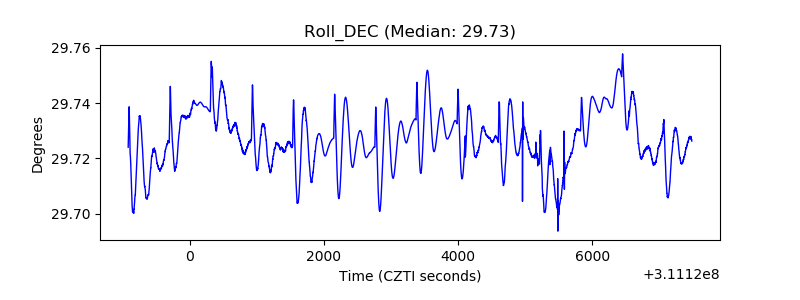 |
| _Roll_RA | 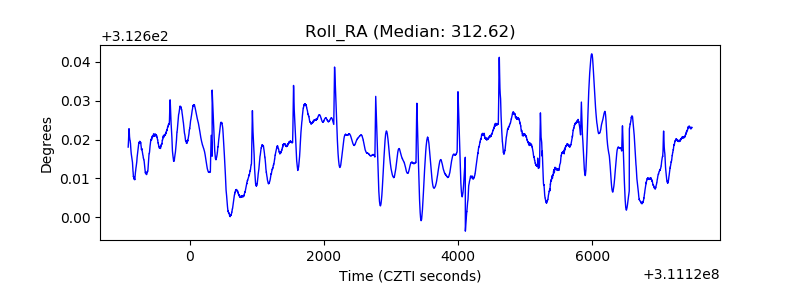 |
| Veto Counter | 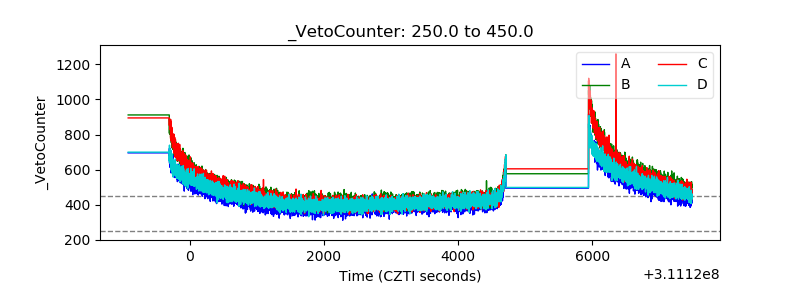 |