| Param | Original file | Final file |
|---|---|---|
| Filename | modeM0/AS1A07_018T08_9000003296_22275cztM0_level2.evt | modeM0/AS1A07_018T08_9000003296_22275cztM0_level2_quad_clean.evt |
| Size (bytes) | 477,596,160 | 68,904,000 |
| Size | 455.5 MB | 65.7 MB |
| Events in quadrant A | 3,328,490 | 421,518 |
| Events in quadrant B | 3,450,687 | 437,346 |
| Events in quadrant C | 3,457,700 | 405,658 |
| Events in quadrant D | 3,798,598 | 381,087 |
| Mode M9 | |||
|---|---|---|---|
| Quadrant | BADHDUFLAG | Total packets | Discarded packets |
| A | 0 | 13 | 0 |
| B | 0 | 14 | 0 |
| C | 0 | 14 | 0 |
| D | 0 | 14 | 0 |
| Mode M0 | |||
|---|---|---|---|
| Quadrant | BADHDUFLAG | Total packets | Discarded packets |
| A | 0 | 13633 | 2 |
| B | 0 | 14077 | 2 |
| C | 0 | 14135 | 2 |
| D | 0 | 15302 | 2 |
| Mode SS | |||
|---|---|---|---|
| Quadrant | BADHDUFLAG | Total packets | Discarded packets |
| A | 0 | 128 | 0 |
| B | 0 | 128 | 0 |
| C | 0 | 128 | 0 |
| D | 0 | 128 | 0 |
| Quadrant | Total seconds | Saturated seconds | Saturation percentage |
|---|---|---|---|
| A | 6314 | 25 | 0.395946% |
| B | 6314 | 50 | 0.791891% |
| C | 6314 | 108 | 1.710485% |
| D | 6314 | 137 | 2.169781% |
Noise dominated data is calculated using 1-second bins in cleaned event files. If a bin has >2000 counts, and if more than 50% of those come from <1% of pixels, then it is considered to be noise-dominated and hence unusable.
| Quadrant | # 1 sec bins | Bins with >0 counts | Bins with >2000 counts | High rate bins dominated by noise | Noise dominated (total time) | Noise dominated (detector-on time) | Marked lightcurve |
|---|---|---|---|---|---|---|---|
| A | 7634 | 6315 | 0 | 0 | 0.00% | 0.00% | 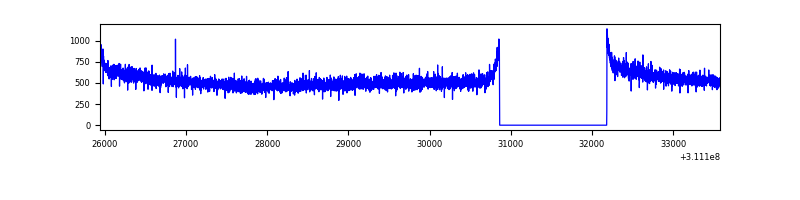 |
| B | 7634 | 6315 | 5 | 5 | 0.07% | 0.08% | 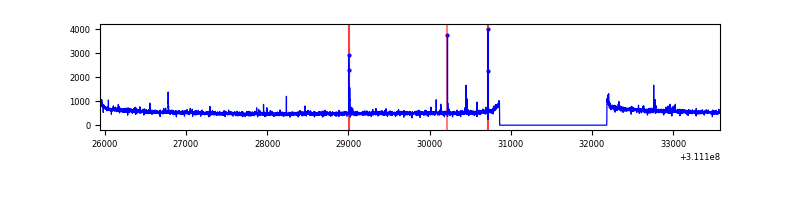 |
| C | 7634 | 6315 | 15 | 15 | 0.20% | 0.24% | 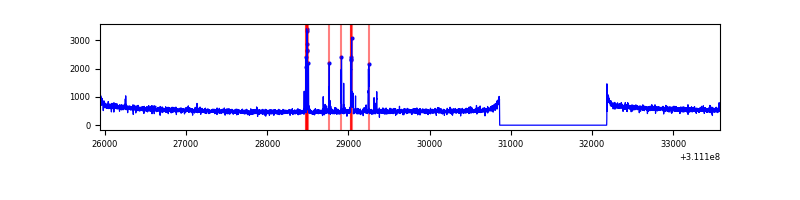 |
| D | 7634 | 6314 | 119 | 119 | 1.56% | 1.88% | 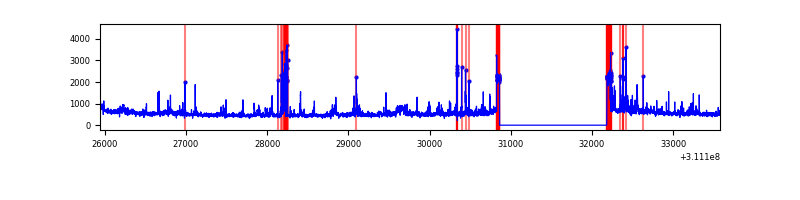 |
Top three noisy pixels from each quadrant. If the there are fewer than three noisy pixels in the level2.evt file, extra rows are filled as -1
| Pixel properties | Quadrant properties | ||||||
|---|---|---|---|---|---|---|---|
| Quadrant | DetID | PixID | Counts | Sigma | Mean | Median | Sigma |
| A | 13 | 254 | 9059 | 47.82 | 864 | 850 | 171.6 |
| A | 0 | 226 | 7428 | 38.32 | 864 | 850 | 171.6 |
| A | 3 | 137 | 7070 | 36.24 | 864 | 850 | 171.6 |
| B | 3 | 64 | 40043 | 241.21 | 868 | 850 | 162.5 |
| B | 4 | 171 | 18967 | 111.5 | 868 | 850 | 162.5 |
| B | 12 | 111 | 18882 | 110.98 | 868 | 850 | 162.5 |
| C | 14 | 238 | 134500 | 702.88 | 823 | 833 | 190.2 |
| C | 10 | 22 | 111901 | 584.05 | 823 | 833 | 190.2 |
| C | 13 | 61 | 5699 | 25.59 | 823 | 833 | 190.2 |
| D | 1 | 52 | 465482 | 2398.72 | 811 | 789 | 193.7 |
| D | 2 | 136 | 176830 | 908.71 | 811 | 789 | 193.7 |
| D | 13 | 104 | 36793 | 185.85 | 811 | 789 | 193.7 |
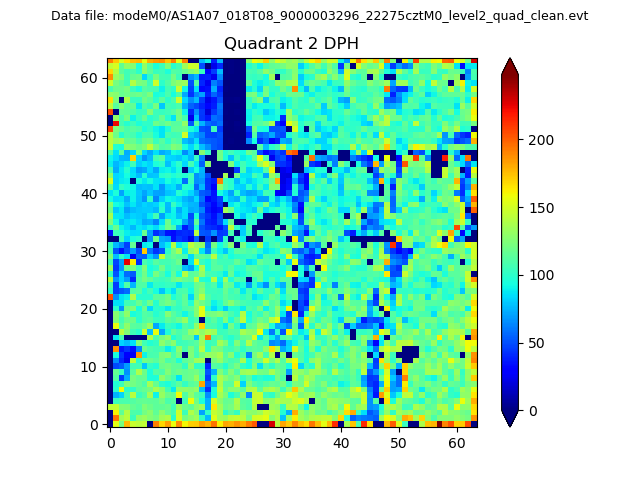
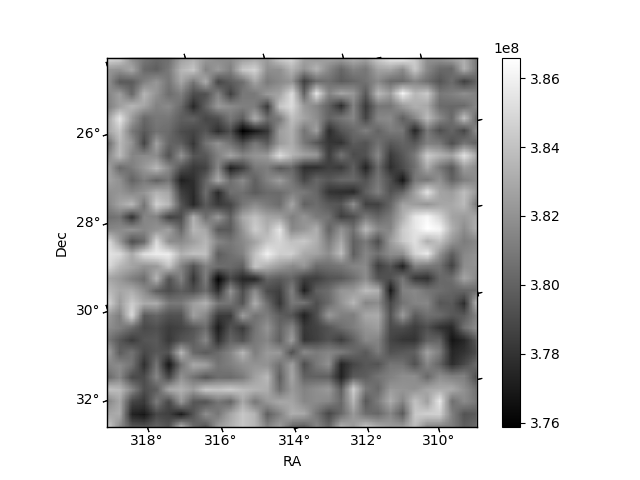
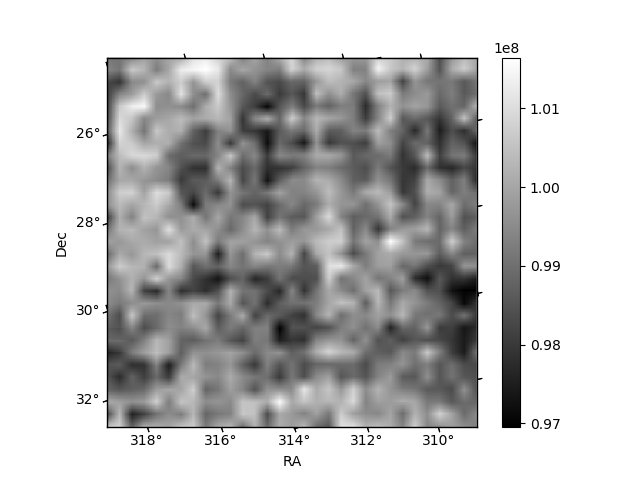
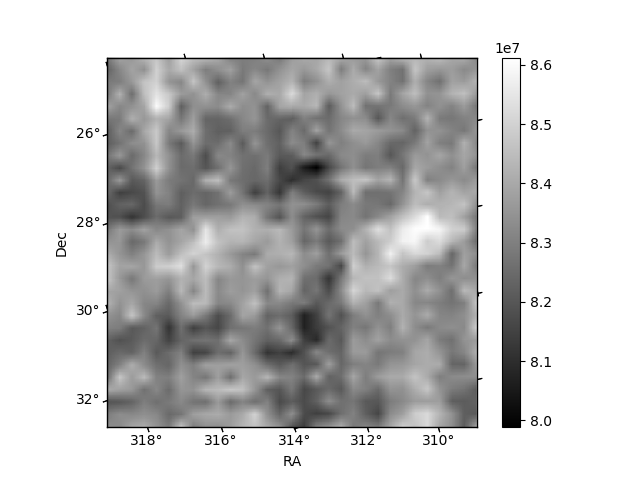
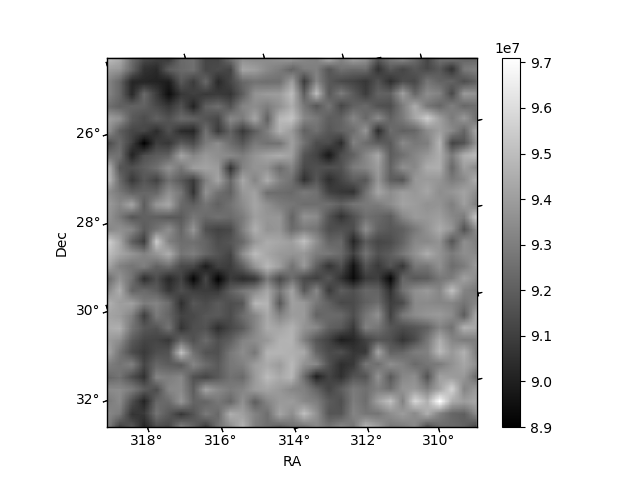
Histogram calculated using DETX and DETY for each event in the final _common_clean file
| Quadrant A | 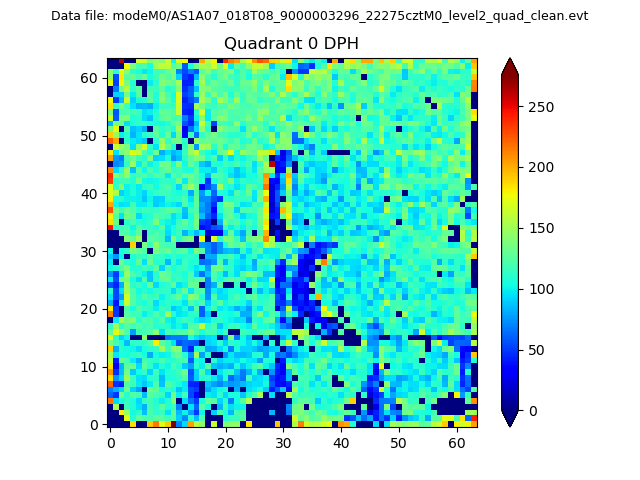 |
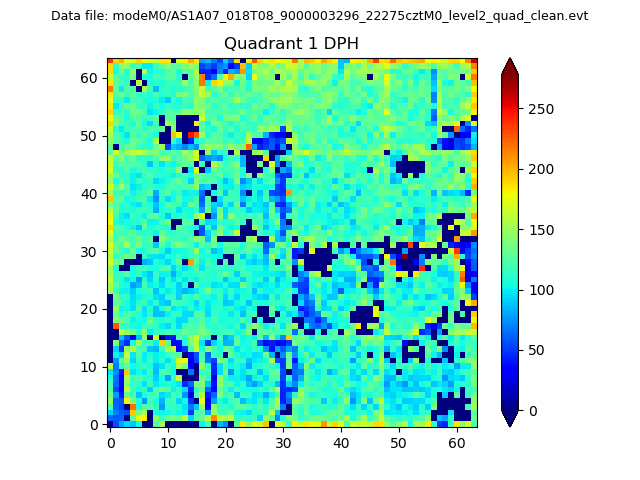 |
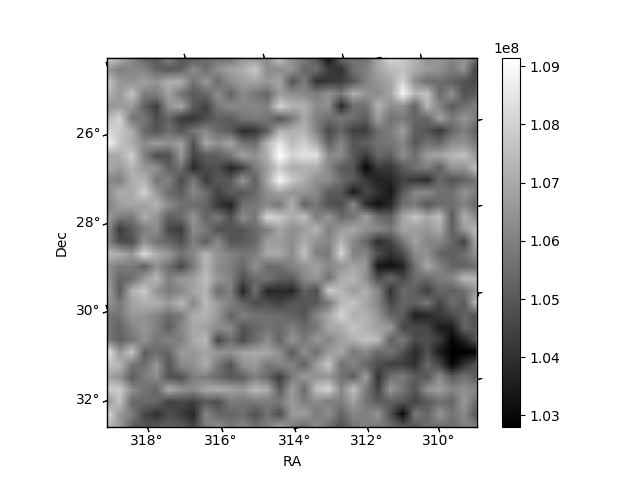
Quadrant B |
|---|---|---|---|
| Quadrant D | 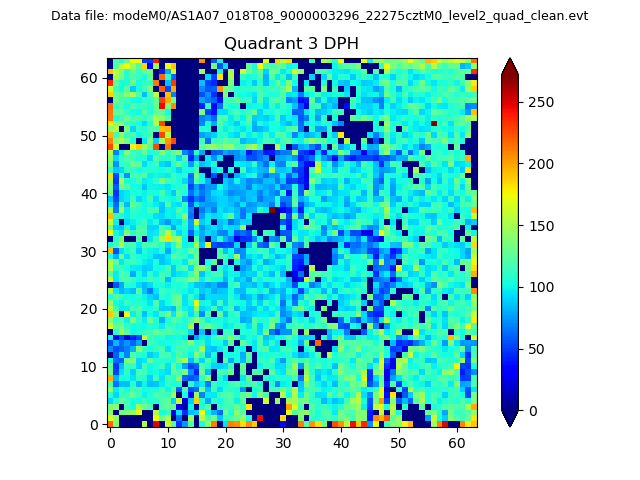 |
 |
Quadrant C |
| Plot type | Count rate plots | Images |
|---|---|---|
| Comparison with Poisson distribution Blue bars denote a histogram of data divided into 1 sec bins. Red curve is a Poisson curve with rate = median count rate of data. |
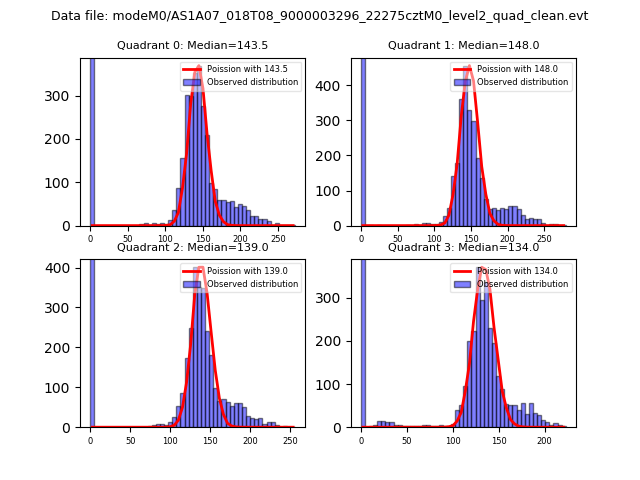 |
 |
| Quadrant-wise count rates Data is divided into 100 sec bins |
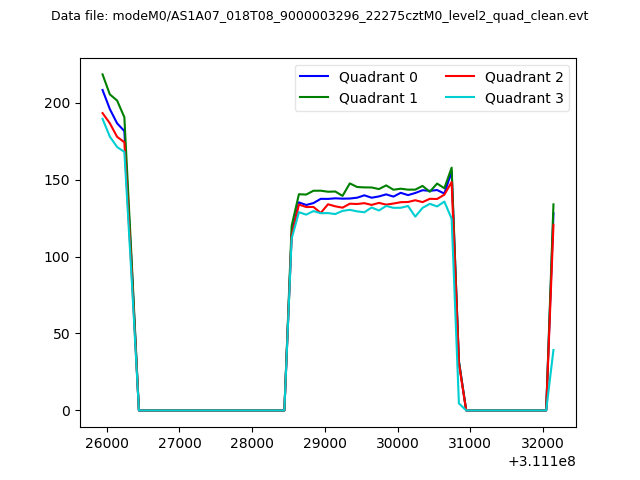 |
|
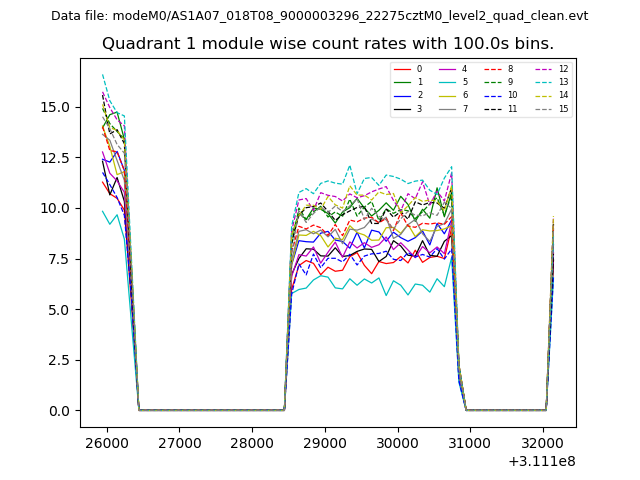
| Module-wise count rates for Quadrant A Data is divided into 100 sec bins |
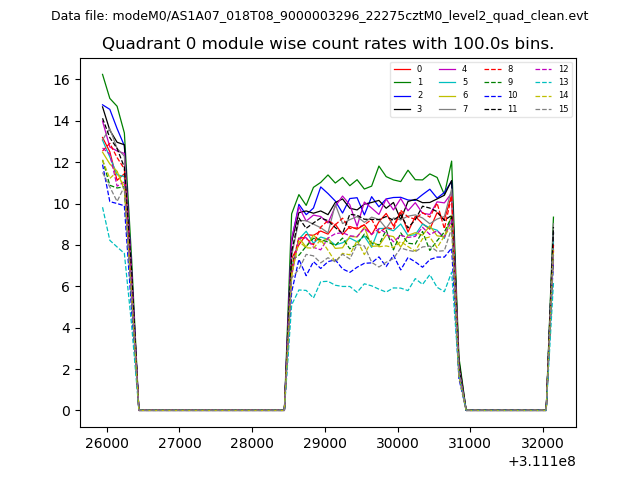 |
 |
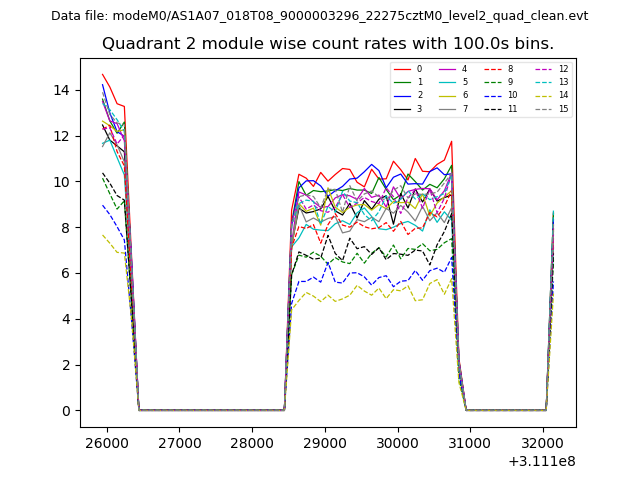
| Module-wise count rates for Quadrant B Data is divided into 100 sec bins |
 |
 |
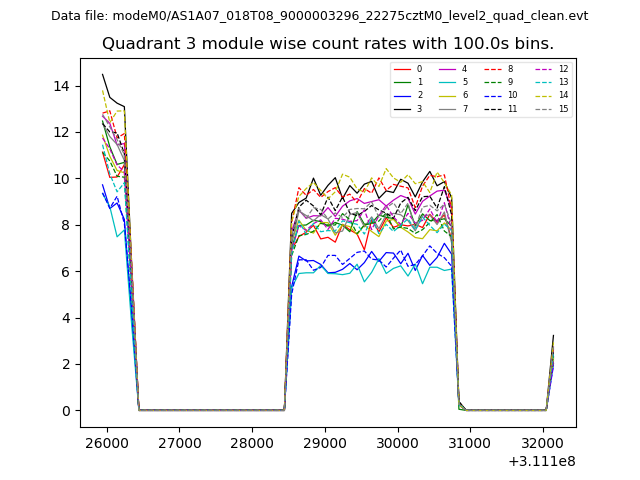
| Module-wise count rates for Quadrant C Data is divided into 100 sec bins |
 |
 |
| Module-wise count rates for Quadrant D Data is divided into 100 sec bins |
 |
 |
| Parameter | Plot |
|---|---|
| CZT HV Monitor | 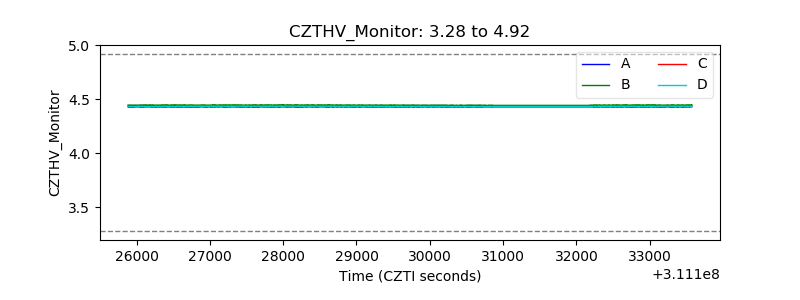 |
| D_VDD | 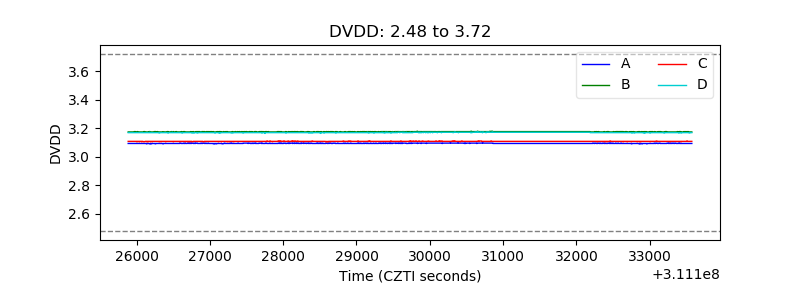 |
| Temperature 1 |  |
| Veto HV Monitor | 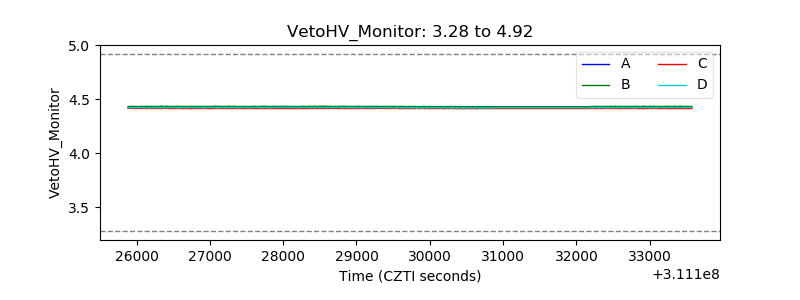 |
| Veto LLD | 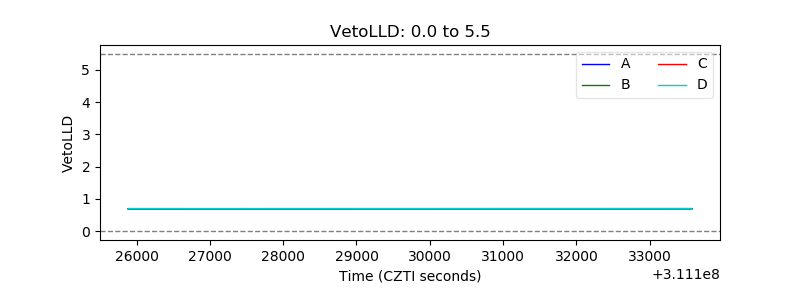 |
| Alpha Counter | 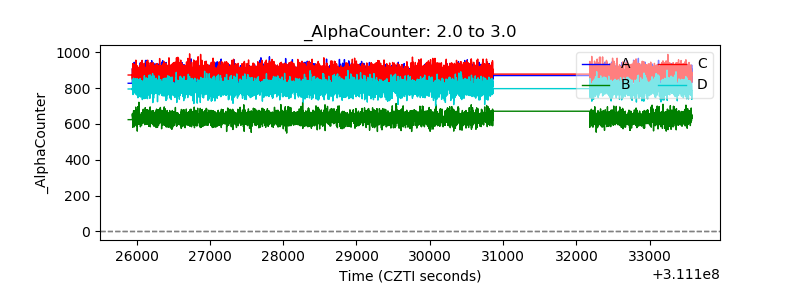 |
| _CPM_Rate | 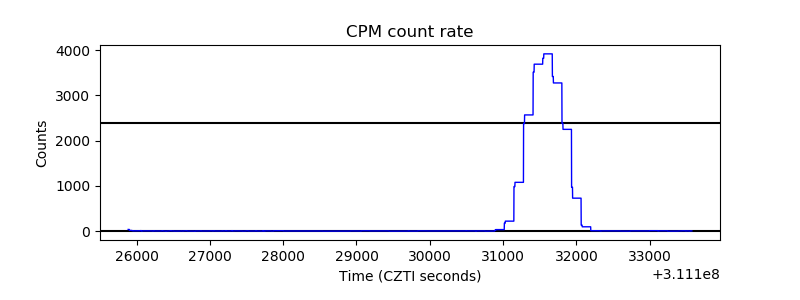 |
| CZT Counter | 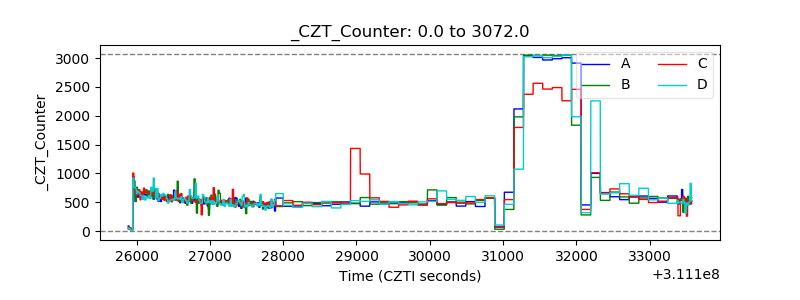 |
| +2.5 Volts monitor |  |
| +5 Volts monitor |  |
| _ROLL_ROT | 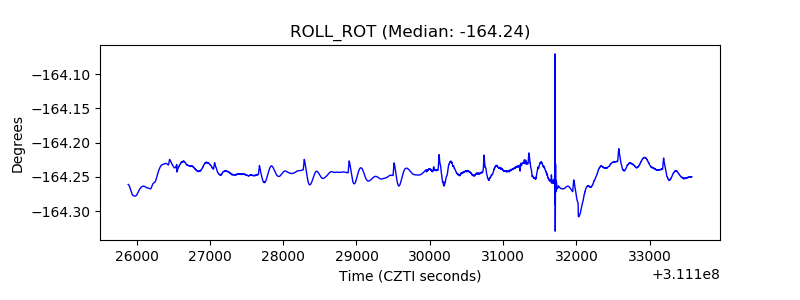 |
| _Roll_DEC | 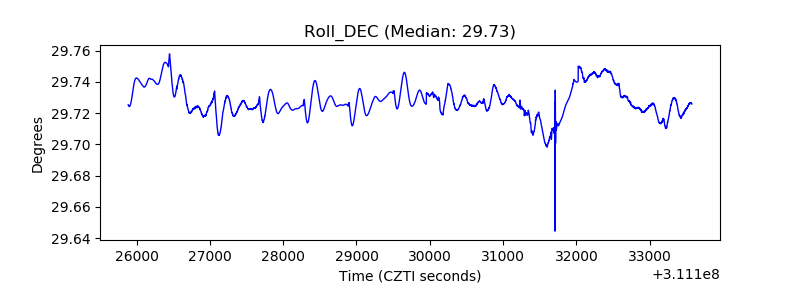 |
| _Roll_RA | 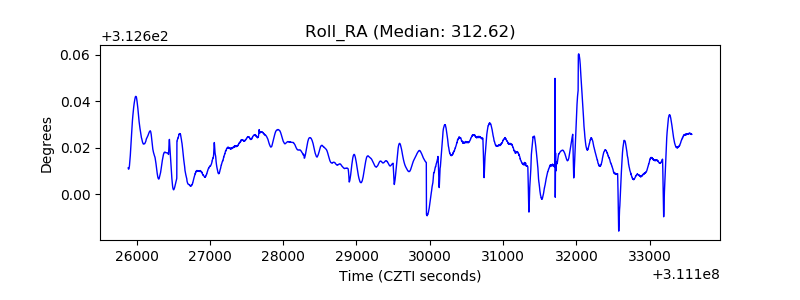 |
| Veto Counter | 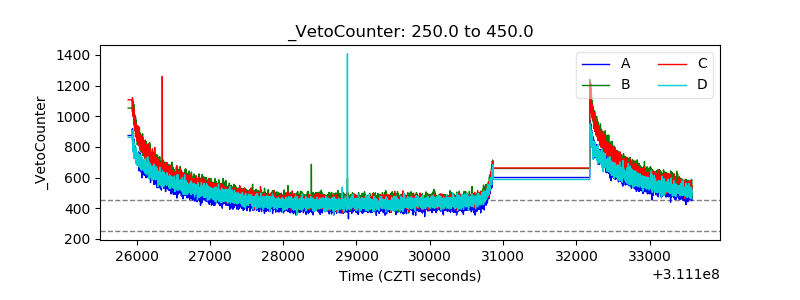 |