| Param | Original file | Final file |
|---|---|---|
| Filename | modeM0/AS1A07_018T08_9000003296_22276cztM0_level2.evt | modeM0/AS1A07_018T08_9000003296_22276cztM0_level2_quad_clean.evt |
| Size (bytes) | 452,479,680 | 63,881,280 |
| Size | 431.5 MB | 60.9 MB |
| Events in quadrant A | 3,261,413 | 384,462 |
| Events in quadrant B | 3,331,595 | 396,560 |
| Events in quadrant C | 3,299,000 | 368,021 |
| Events in quadrant D | 3,397,169 | 359,168 |
| Mode M9 | |||
|---|---|---|---|
| Quadrant | BADHDUFLAG | Total packets | Discarded packets |
| A | 0 | 14 | 0 |
| B | 0 | 14 | 0 |
| C | 0 | 14 | 0 |
| D | 0 | 14 | 0 |
| Mode M0 | |||
|---|---|---|---|
| Quadrant | BADHDUFLAG | Total packets | Discarded packets |
| A | 0 | 13160 | 1 |
| B | 0 | 13504 | 1 |
| C | 0 | 13403 | 1 |
| D | 0 | 13853 | 1 |
| Mode SS | |||
|---|---|---|---|
| Quadrant | BADHDUFLAG | Total packets | Discarded packets |
| A | 0 | 124 | 0 |
| B | 0 | 124 | 0 |
| C | 0 | 124 | 0 |
| D | 0 | 124 | 0 |
| Quadrant | Total seconds | Saturated seconds | Saturation percentage |
|---|---|---|---|
| A | 6100 | 24 | 0.393443% |
| B | 6100 | 41 | 0.672131% |
| C | 6100 | 95 | 1.557377% |
| D | 6100 | 73 | 1.196721% |
Noise dominated data is calculated using 1-second bins in cleaned event files. If a bin has >2000 counts, and if more than 50% of those come from <1% of pixels, then it is considered to be noise-dominated and hence unusable.
| Quadrant | # 1 sec bins | Bins with >0 counts | Bins with >2000 counts | High rate bins dominated by noise | Noise dominated (total time) | Noise dominated (detector-on time) | Marked lightcurve |
|---|---|---|---|---|---|---|---|
| A | 7490 | 6101 | 0 | 0 | 0.00% | 0.00% | 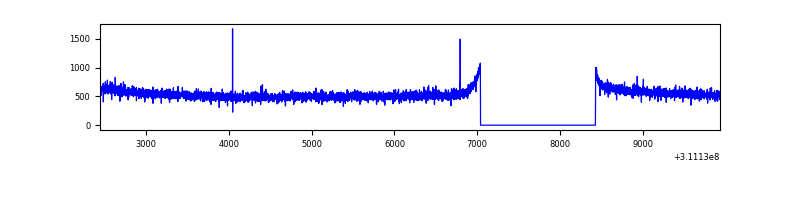 |
| B | 7490 | 6101 | 0 | 0 | 0.00% | 0.00% | 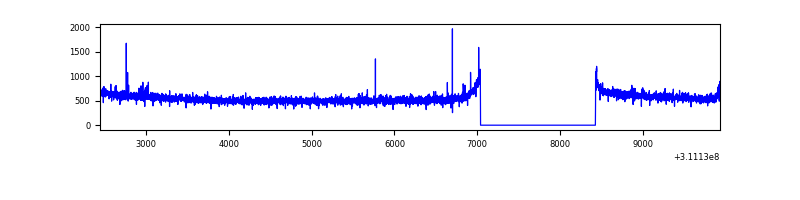 |
| C | 7490 | 6101 | 11 | 11 | 0.15% | 0.18% | 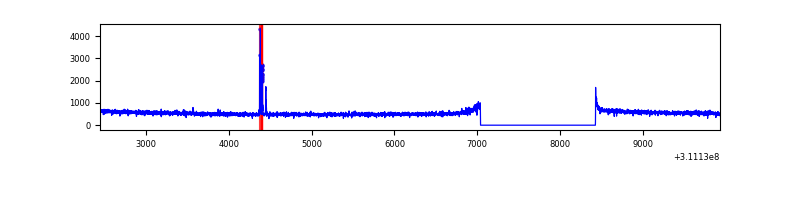 |
| D | 7490 | 6101 | 55 | 55 | 0.73% | 0.90% | 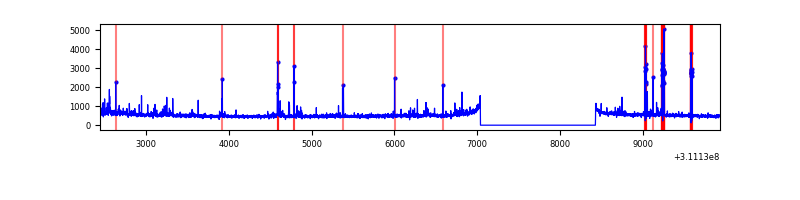 |
Top three noisy pixels from each quadrant. If the there are fewer than three noisy pixels in the level2.evt file, extra rows are filled as -1
| Pixel properties | Quadrant properties | ||||||
|---|---|---|---|---|---|---|---|
| Quadrant | DetID | PixID | Counts | Sigma | Mean | Median | Sigma |
| A | 13 | 254 | 8298 | 44.53 | 846 | 833 | 167.6 |
| A | 0 | 226 | 7287 | 38.5 | 846 | 833 | 167.6 |
| A | 3 | 137 | 6625 | 34.55 | 846 | 833 | 167.6 |
| B | 12 | 111 | 18166 | 110.04 | 849 | 832 | 157.5 |
| B | 11 | 111 | 16429 | 99.02 | 849 | 832 | 157.5 |
| B | 14 | 111 | 15281 | 91.73 | 849 | 832 | 157.5 |
| C | 14 | 238 | 130762 | 706.03 | 799 | 809 | 184.1 |
| C | 10 | 22 | 46463 | 248.04 | 799 | 809 | 184.1 |
| C | 0 | 10 | 7047 | 33.89 | 799 | 809 | 184.1 |
| D | 1 | 52 | 284224 | 1468.92 | 802 | 781 | 193.0 |
| D | 2 | 136 | 52376 | 267.39 | 802 | 781 | 193.0 |
| D | 2 | 234 | 22631 | 113.24 | 802 | 781 | 193.0 |
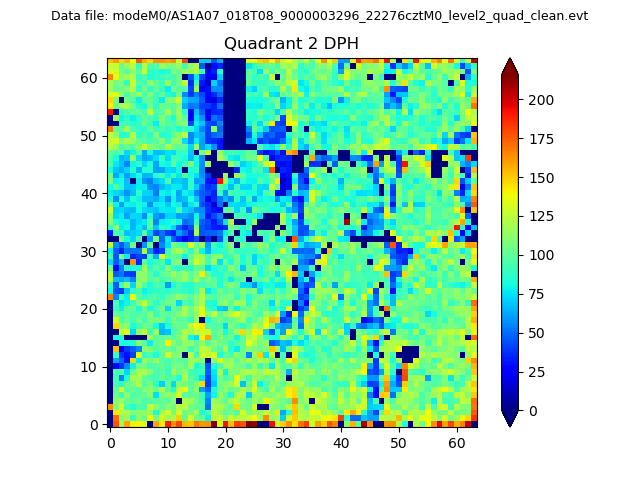
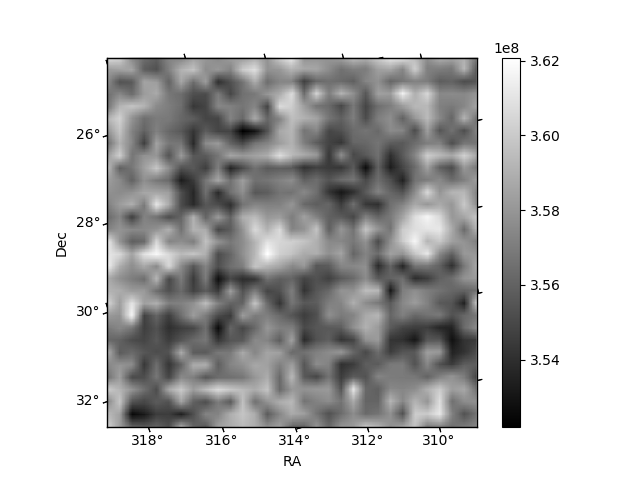
Histogram calculated using DETX and DETY for each event in the final _common_clean file
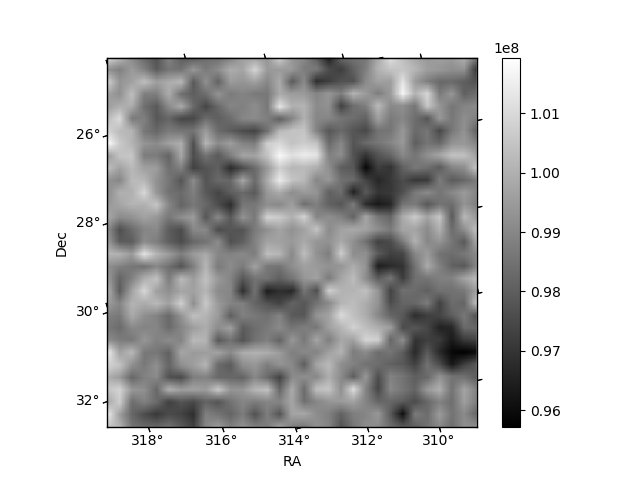
| Quadrant A | 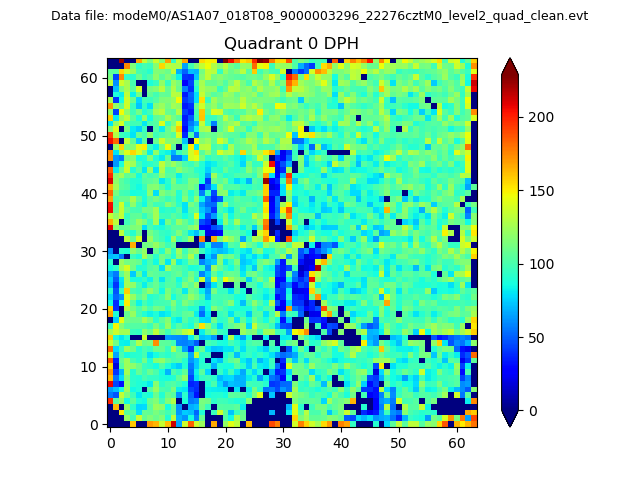 |
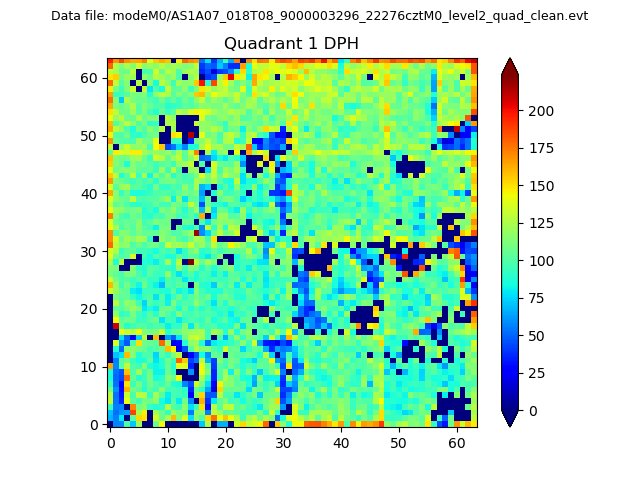 |
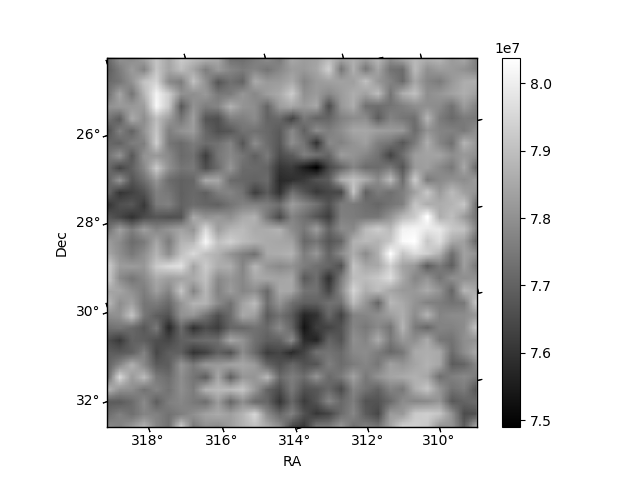
Quadrant B |
|---|---|---|---|
| Quadrant D | 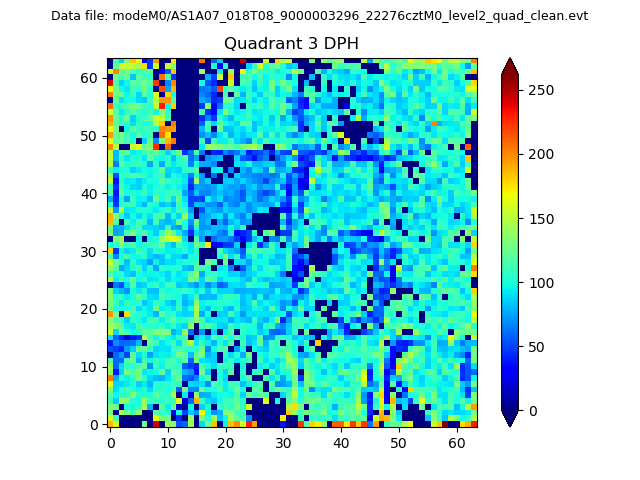 |
 |
Quadrant C |
| Plot type | Count rate plots | Images |
|---|---|---|
| Comparison with Poisson distribution Blue bars denote a histogram of data divided into 1 sec bins. Red curve is a Poisson curve with rate = median count rate of data. |
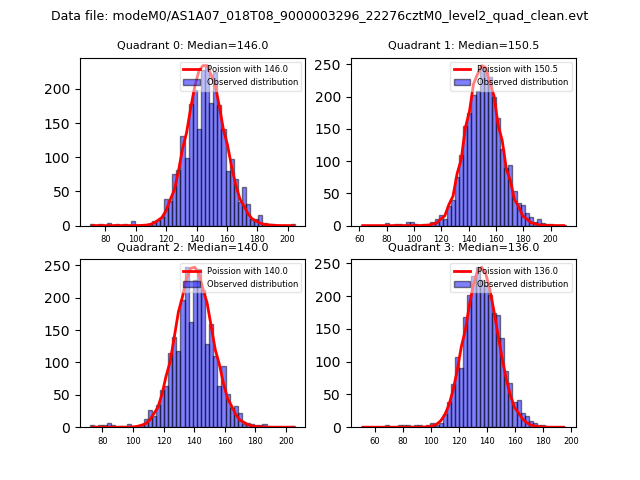 |
 |
| Quadrant-wise count rates Data is divided into 100 sec bins |
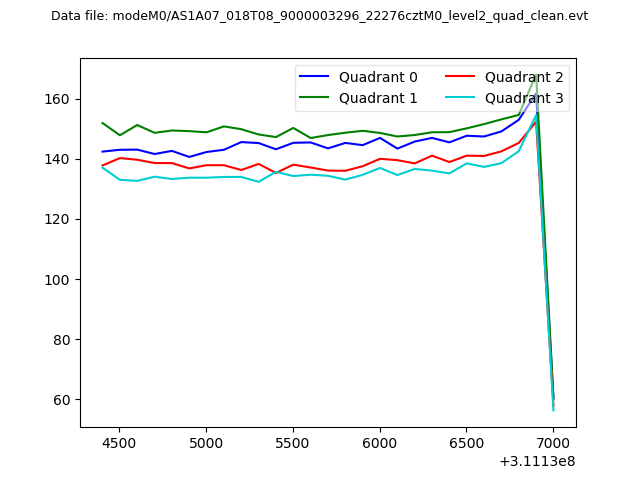 |
|
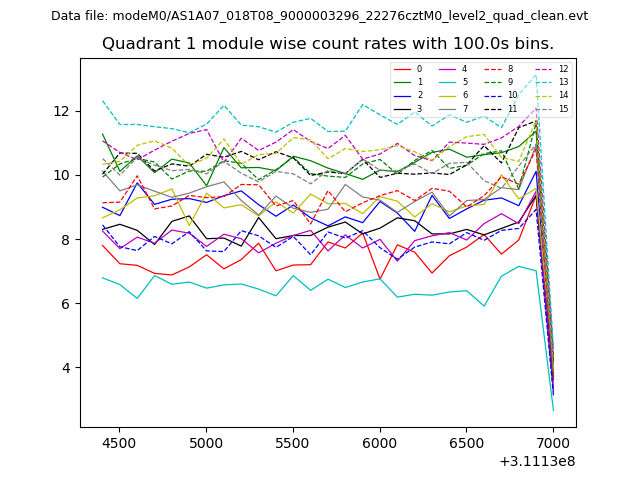
| Module-wise count rates for Quadrant A Data is divided into 100 sec bins |
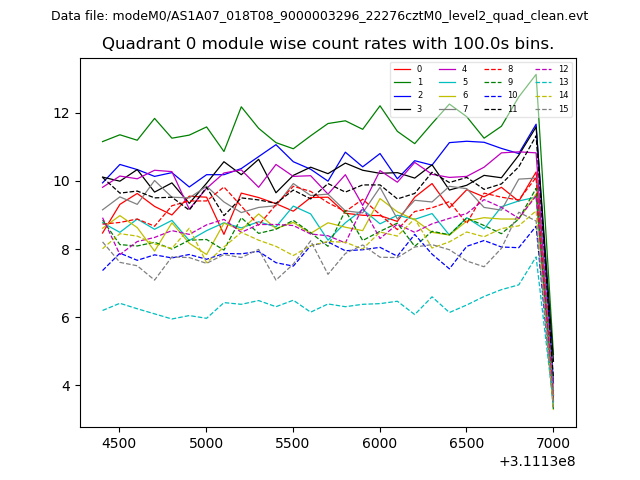 |
 |
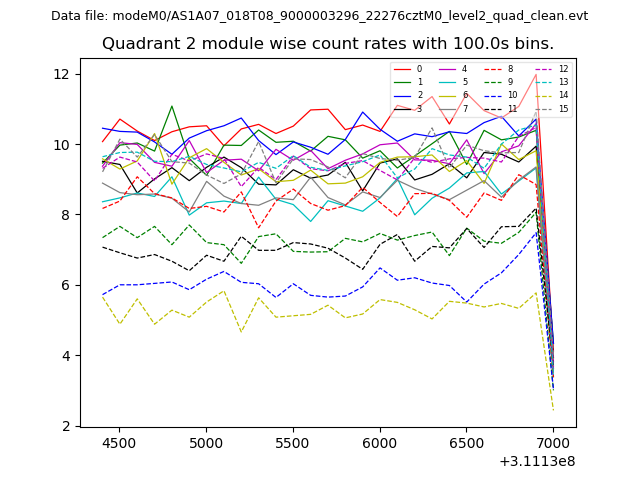
| Module-wise count rates for Quadrant B Data is divided into 100 sec bins |
 |
 |
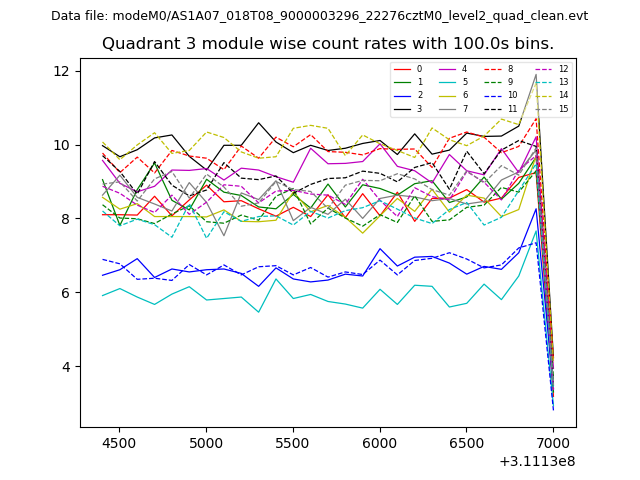
| Module-wise count rates for Quadrant C Data is divided into 100 sec bins |
 |
 |
| Module-wise count rates for Quadrant D Data is divided into 100 sec bins |
 |
 |
| Parameter | Plot |
|---|---|
| CZT HV Monitor | 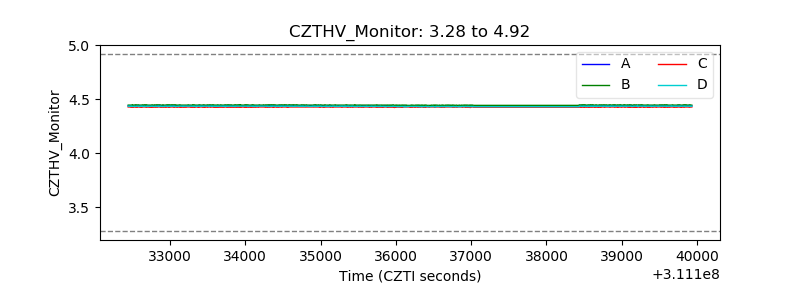 |
| D_VDD | 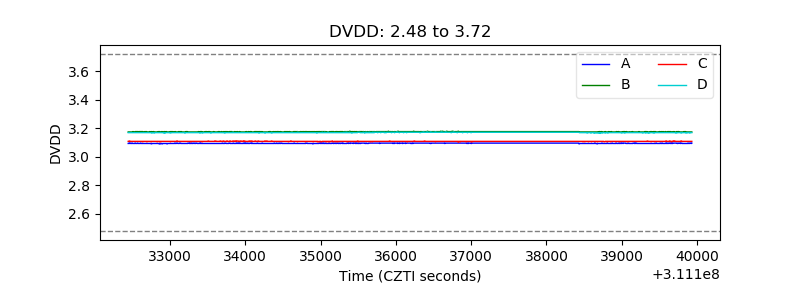 |
| Temperature 1 | 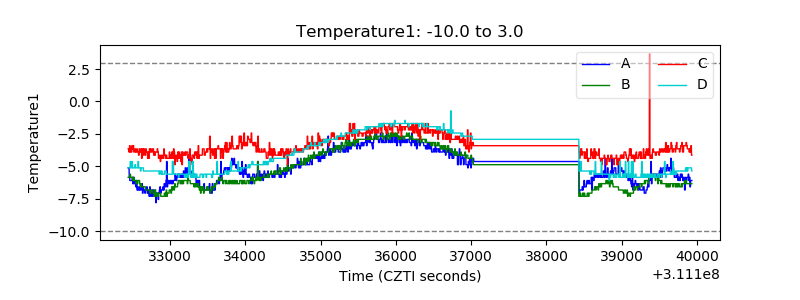 |
| Veto HV Monitor | 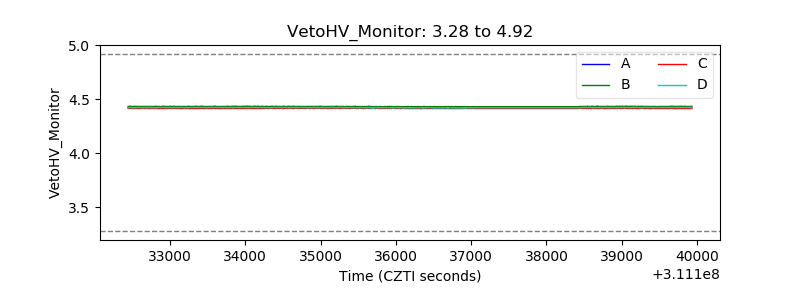 |
| Veto LLD | 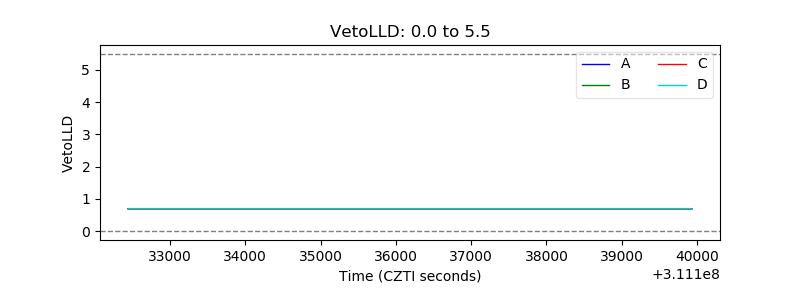 |
| Alpha Counter | 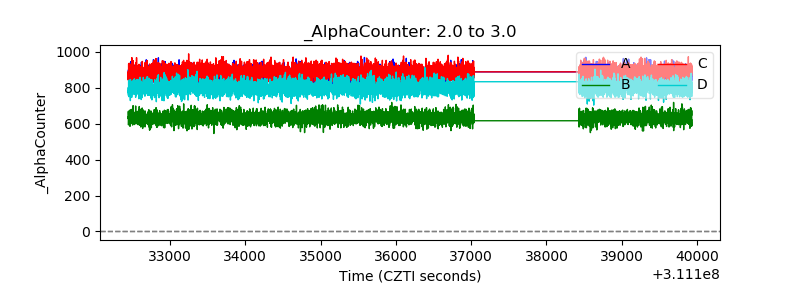 |
| _CPM_Rate | 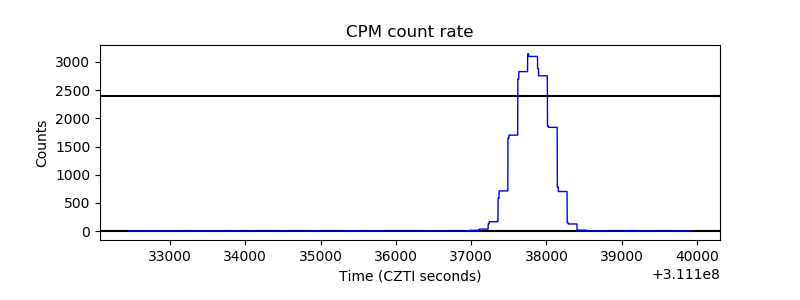 |
| CZT Counter | 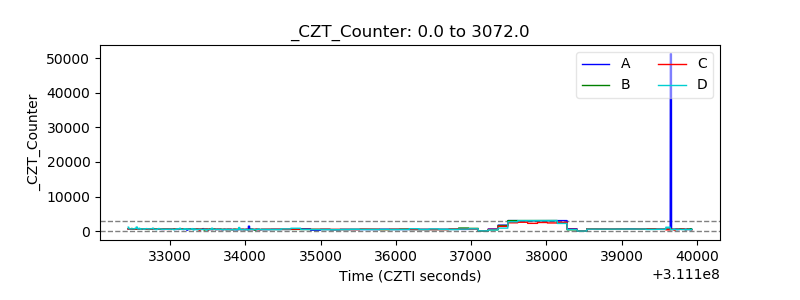 |
| +2.5 Volts monitor |  |
| +5 Volts monitor |  |
| _ROLL_ROT | 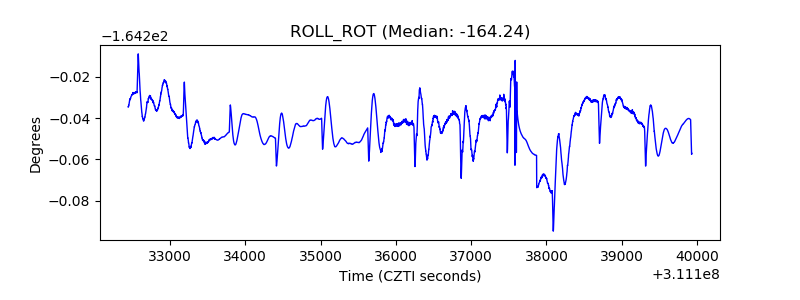 |
| _Roll_DEC | 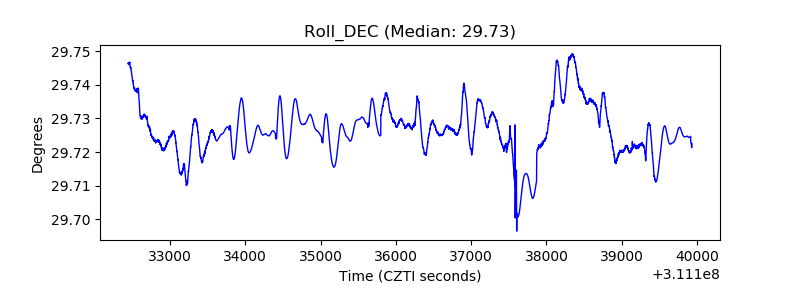 |
| _Roll_RA |  |
| Veto Counter | 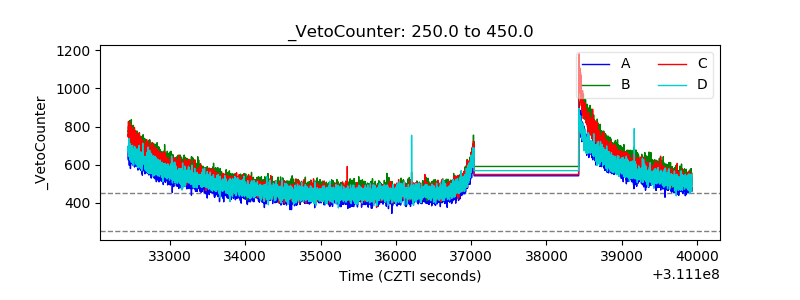 |