| Param | Original file | Final file |
|---|---|---|
| Filename | modeM0/AS1A07_018T08_9000003296_22278cztM0_level2.evt | modeM0/AS1A07_018T08_9000003296_22278cztM0_level2_quad_clean.evt |
| Size (bytes) | 475,482,240 | 88,551,360 |
| Size | 453.5 MB | 84.4 MB |
| Events in quadrant A | 3,380,388 | 571,391 |
| Events in quadrant B | 3,507,137 | 581,200 |
| Events in quadrant C | 3,505,791 | 543,326 |
| Events in quadrant D | 3,566,265 | 533,384 |
| Mode M9 | |||
|---|---|---|---|
| Quadrant | BADHDUFLAG | Total packets | Discarded packets |
| A | 0 | 14 | 0 |
| B | 0 | 15 | 0 |
| C | 0 | 15 | 0 |
| D | 0 | 15 | 0 |
| Mode M0 | |||
|---|---|---|---|
| Quadrant | BADHDUFLAG | Total packets | Discarded packets |
| A | 0 | 13761 | 2 |
| B | 0 | 14183 | 2 |
| C | 0 | 14243 | 2 |
| D | 0 | 14678 | 2 |
| Mode SS | |||
|---|---|---|---|
| Quadrant | BADHDUFLAG | Total packets | Discarded packets |
| A | 0 | 134 | 0 |
| B | 0 | 134 | 0 |
| C | 0 | 134 | 0 |
| D | 0 | 134 | 0 |
| Quadrant | Total seconds | Saturated seconds | Saturation percentage |
|---|---|---|---|
| A | 6477 | 120 | 1.852710% |
| B | 6477 | 174 | 2.686429% |
| C | 6477 | 184 | 2.840821% |
| D | 6477 | 109 | 1.682878% |
Noise dominated data is calculated using 1-second bins in cleaned event files. If a bin has >2000 counts, and if more than 50% of those come from <1% of pixels, then it is considered to be noise-dominated and hence unusable.
| Quadrant | # 1 sec bins | Bins with >0 counts | Bins with >2000 counts | High rate bins dominated by noise | Noise dominated (total time) | Noise dominated (detector-on time) | Marked lightcurve |
|---|---|---|---|---|---|---|---|
| A | 7612 | 6478 | 0 | 0 | 0.00% | 0.00% | 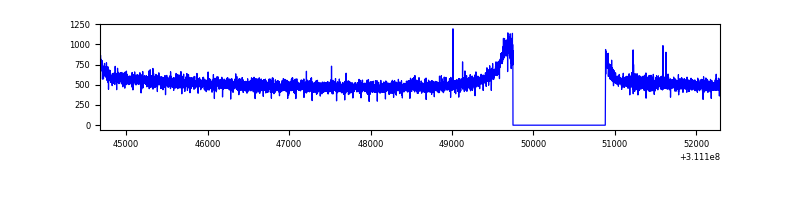 |
| B | 7612 | 6477 | 11 | 11 | 0.14% | 0.17% | 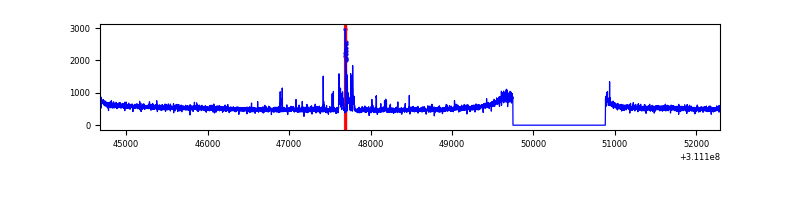 |
| C | 7612 | 6478 | 28 | 28 | 0.37% | 0.43% | 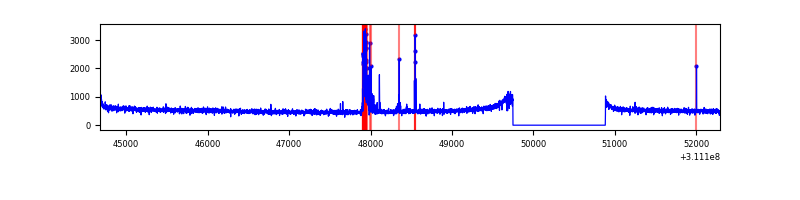 |
| D | 7612 | 6478 | 10 | 10 | 0.13% | 0.15% | 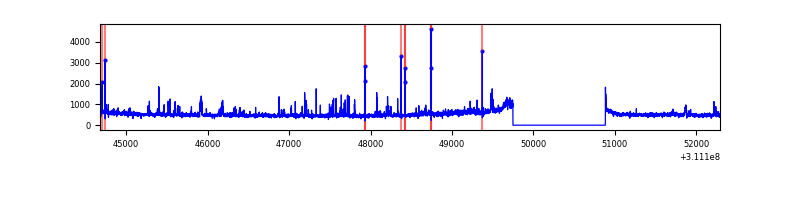 |
Top three noisy pixels from each quadrant. If the there are fewer than three noisy pixels in the level2.evt file, extra rows are filled as -1
| Pixel properties | Quadrant properties | ||||||
|---|---|---|---|---|---|---|---|
| Quadrant | DetID | PixID | Counts | Sigma | Mean | Median | Sigma |
| A | 13 | 254 | 9128 | 47.48 | 877 | 863 | 174.1 |
| A | 0 | 226 | 7592 | 38.65 | 877 | 863 | 174.1 |
| A | 3 | 137 | 7313 | 37.05 | 877 | 863 | 174.1 |
| B | 4 | 171 | 97785 | 584.66 | 871 | 851 | 165.8 |
| B | 12 | 111 | 19679 | 113.56 | 871 | 851 | 165.8 |
| B | 11 | 111 | 17950 | 103.13 | 871 | 851 | 165.8 |
| C | 10 | 22 | 157113 | 815.25 | 823 | 830 | 191.7 |
| C | 14 | 238 | 132386 | 686.26 | 823 | 830 | 191.7 |
| C | 0 | 10 | 7454 | 34.55 | 823 | 830 | 191.7 |
| D | 1 | 52 | 207533 | 1035.39 | 835 | 814 | 199.7 |
| D | 12 | 235 | 109631 | 545.03 | 835 | 814 | 199.7 |
| D | 2 | 136 | 51100 | 251.87 | 835 | 814 | 199.7 |
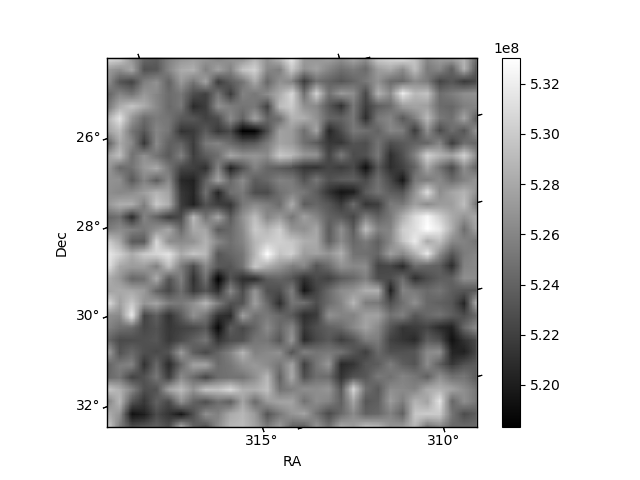
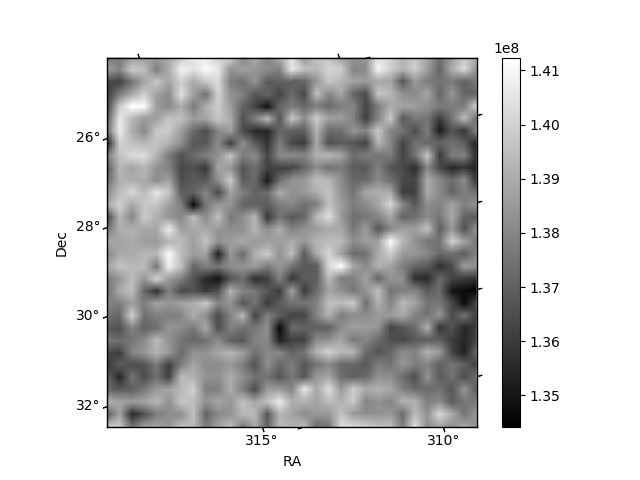
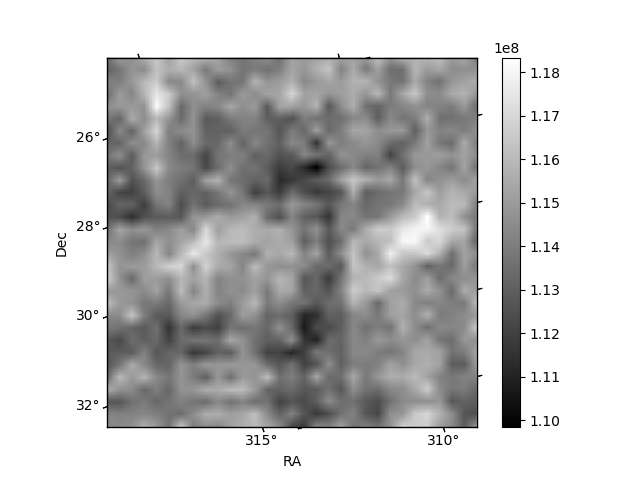
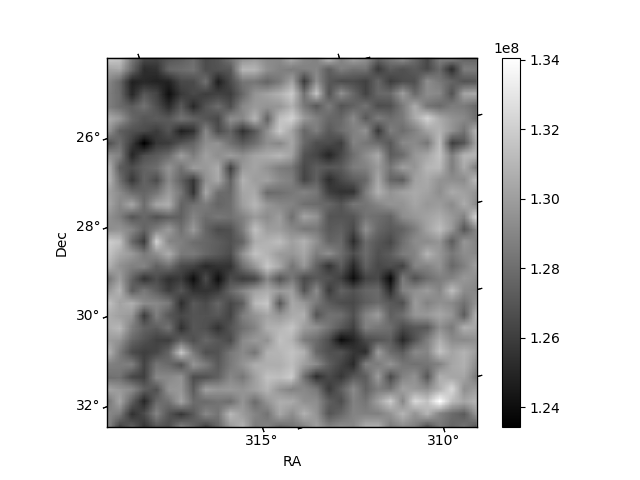
Histogram calculated using DETX and DETY for each event in the final _common_clean file
| Quadrant A | 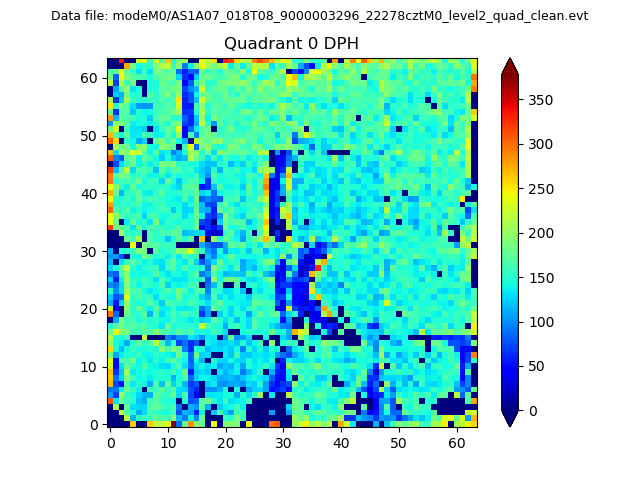 |
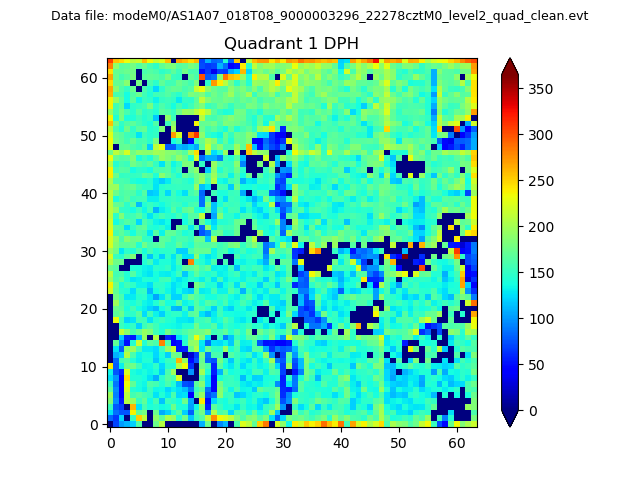 |
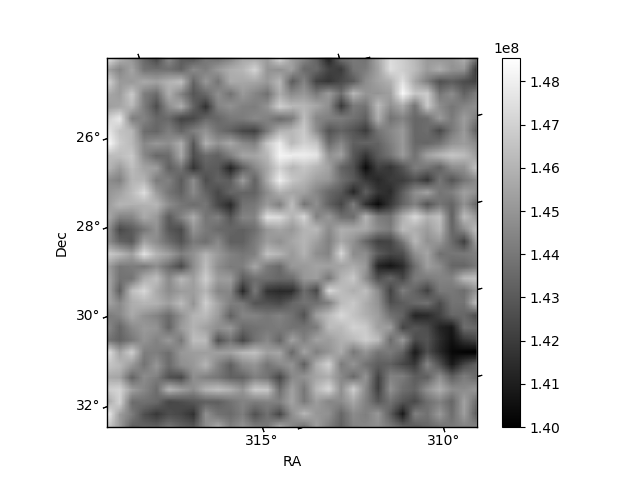
Quadrant B |
|---|---|---|---|
| Quadrant D | 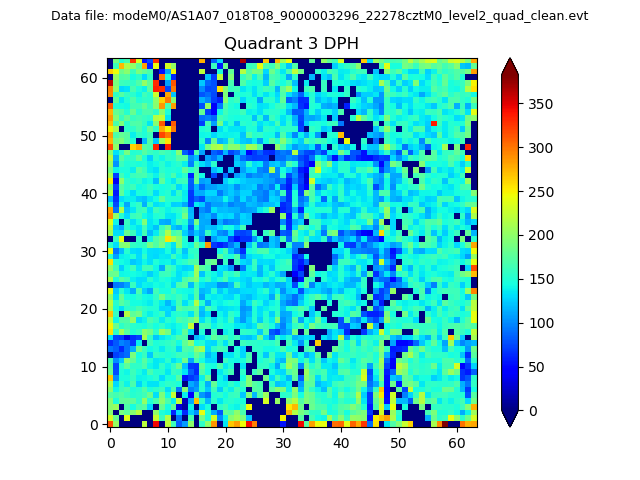 |
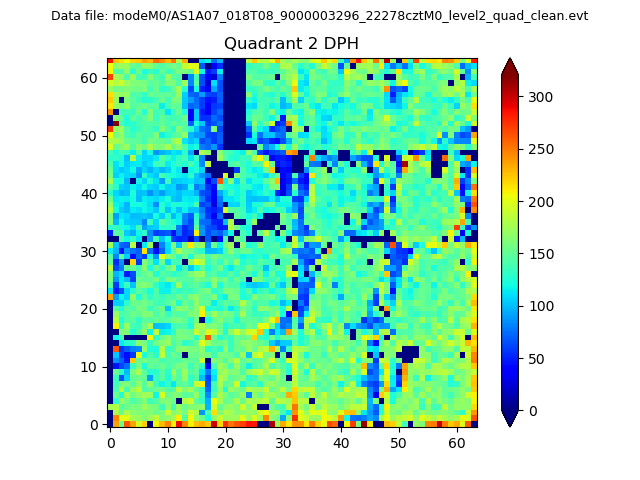 |
Quadrant C |
| Plot type | Count rate plots | Images |
|---|---|---|
| Comparison with Poisson distribution Blue bars denote a histogram of data divided into 1 sec bins. Red curve is a Poisson curve with rate = median count rate of data. |
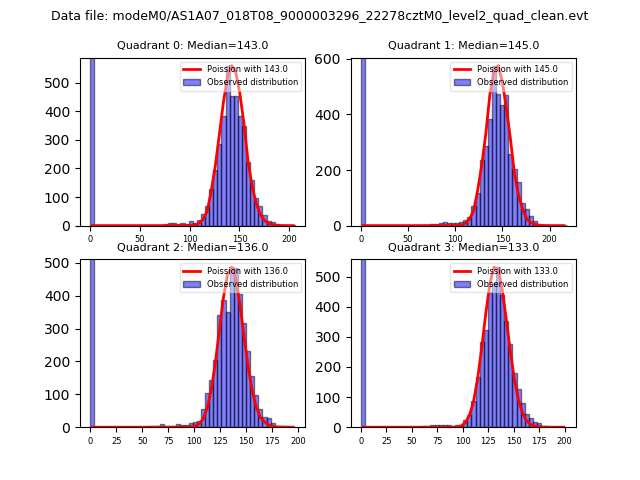 |
 |
| Quadrant-wise count rates Data is divided into 100 sec bins |
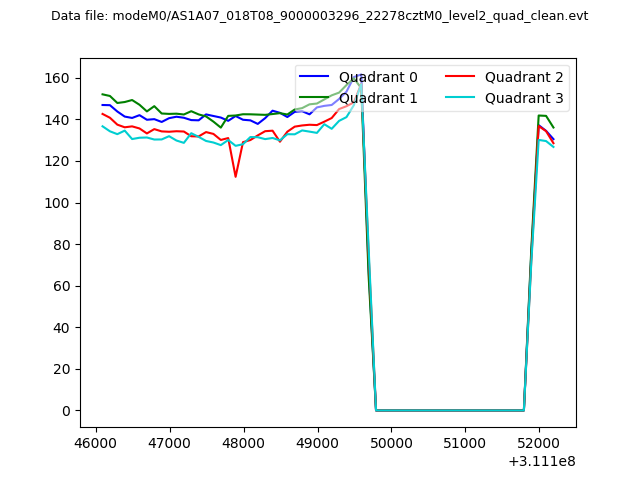 |
|
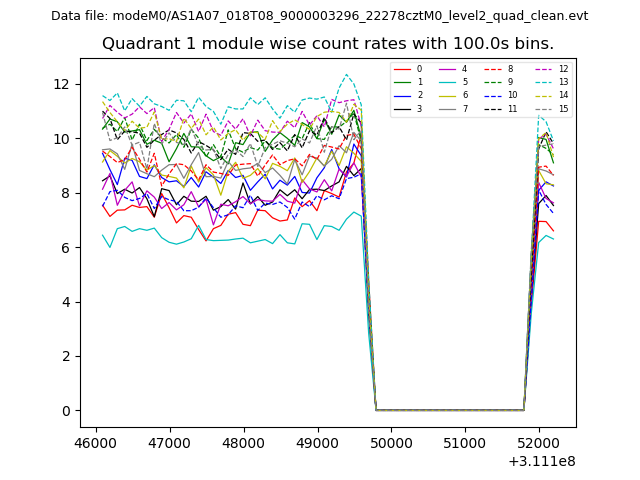
| Module-wise count rates for Quadrant A Data is divided into 100 sec bins |
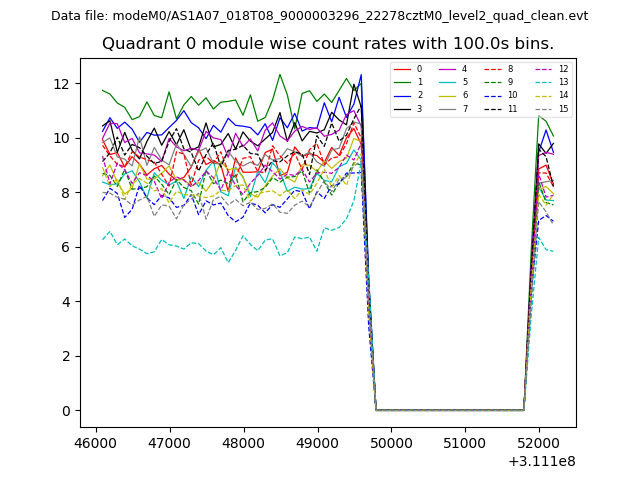 |
 |
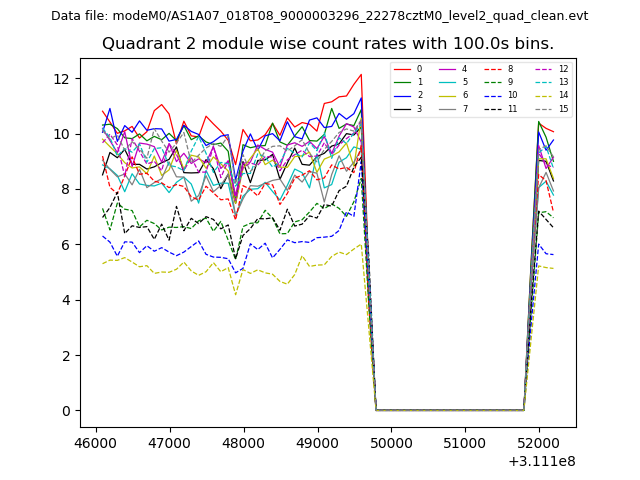
| Module-wise count rates for Quadrant B Data is divided into 100 sec bins |
 |
 |
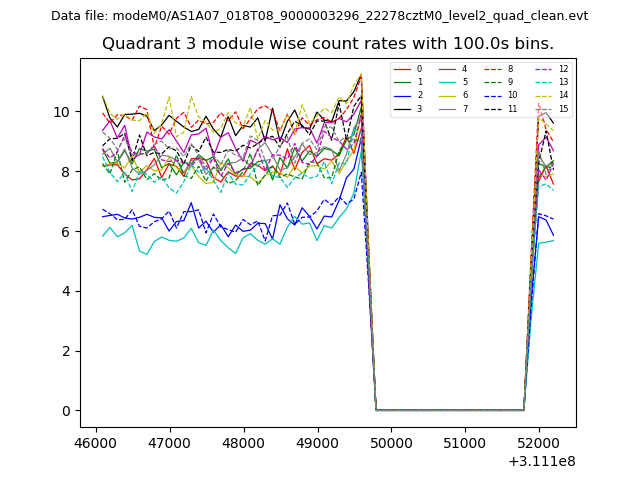
| Module-wise count rates for Quadrant C Data is divided into 100 sec bins |
 |
 |
| Module-wise count rates for Quadrant D Data is divided into 100 sec bins |
 |
 |
| Parameter | Plot |
|---|---|
| CZT HV Monitor | 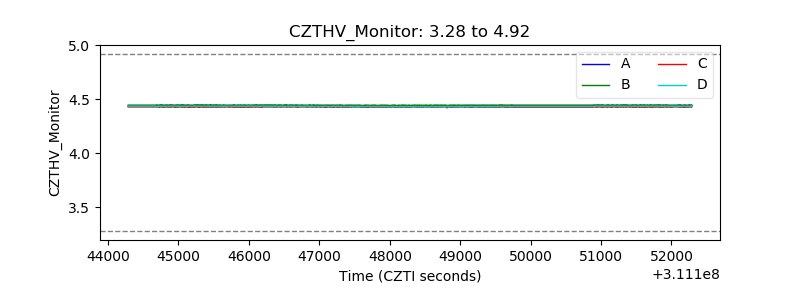 |
| D_VDD | 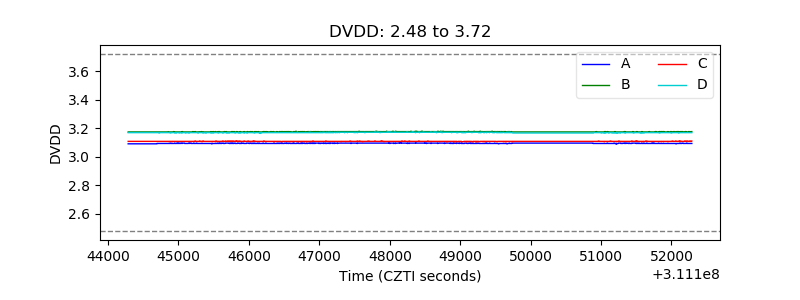 |
| Temperature 1 | 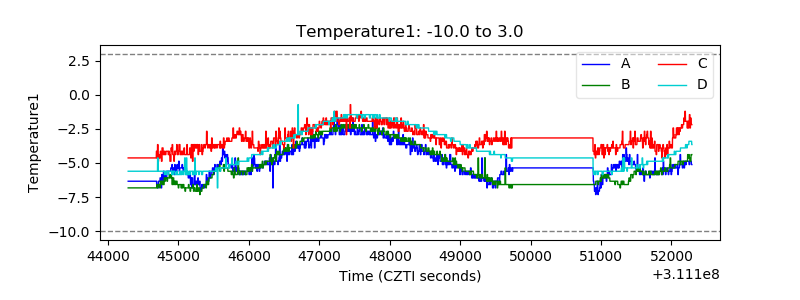 |
| Veto HV Monitor | 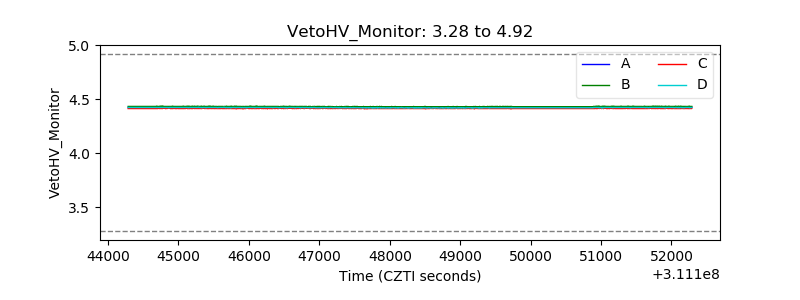 |
| Veto LLD | 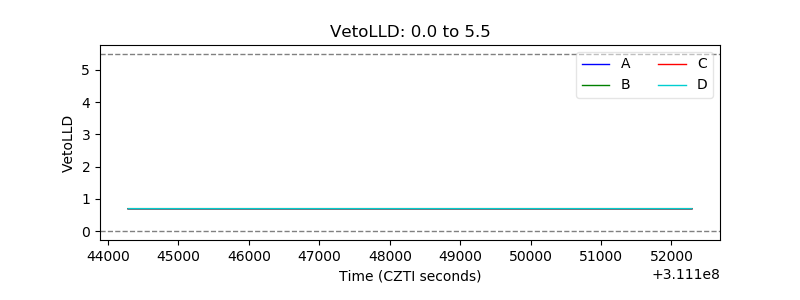 |
| Alpha Counter | 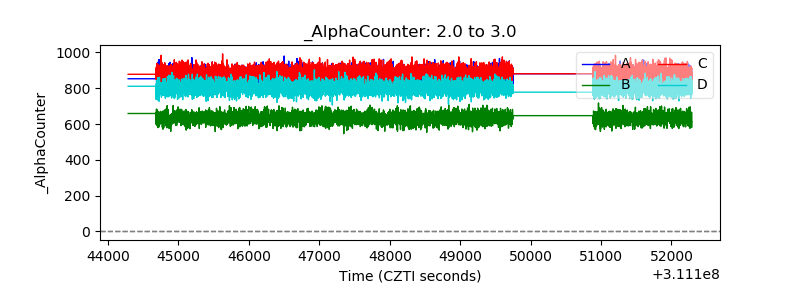 |
| _CPM_Rate | 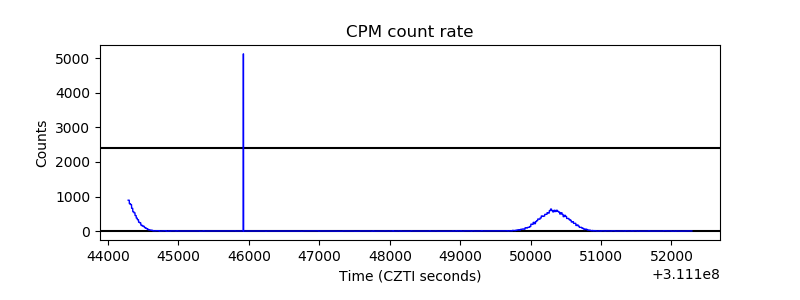 |
| CZT Counter | 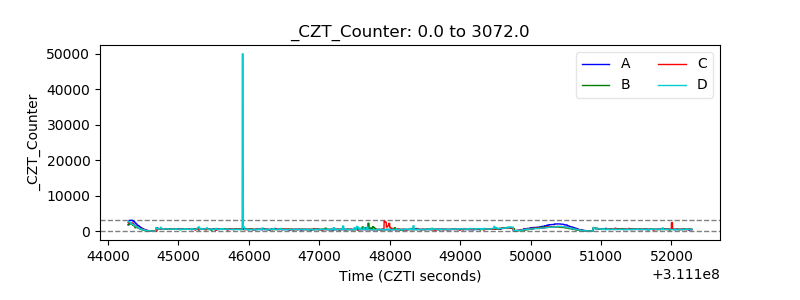 |
| +2.5 Volts monitor | 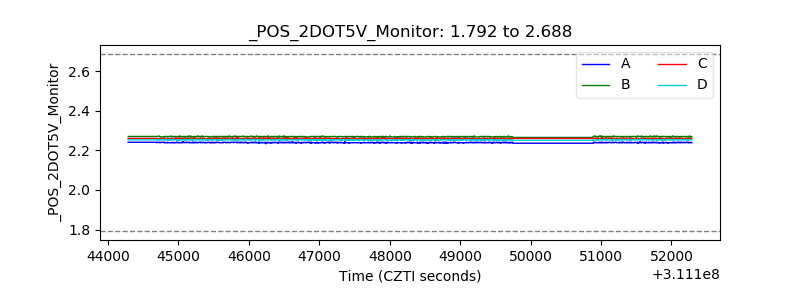 |
| +5 Volts monitor |  |
| _ROLL_ROT | 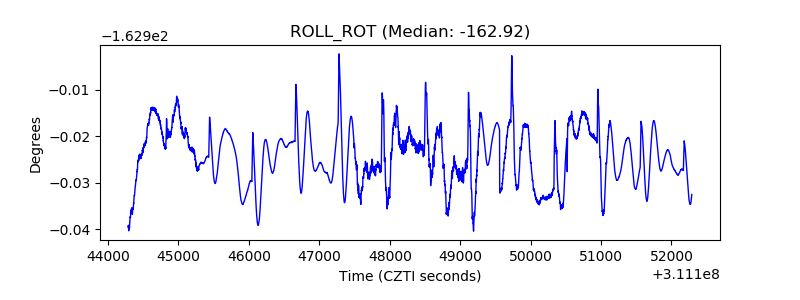 |
| _Roll_DEC | 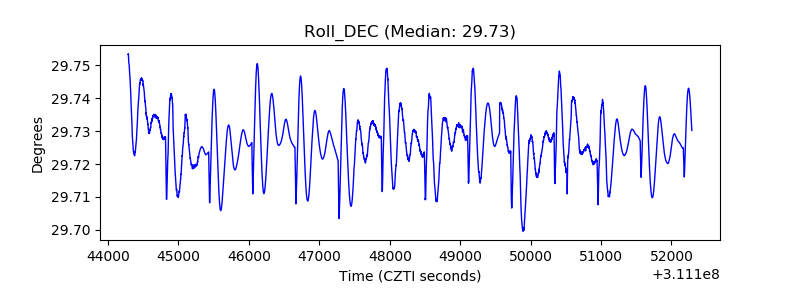 |
| _Roll_RA | 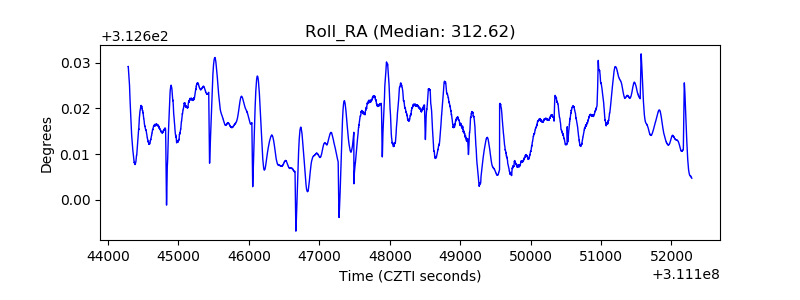 |
| Veto Counter | 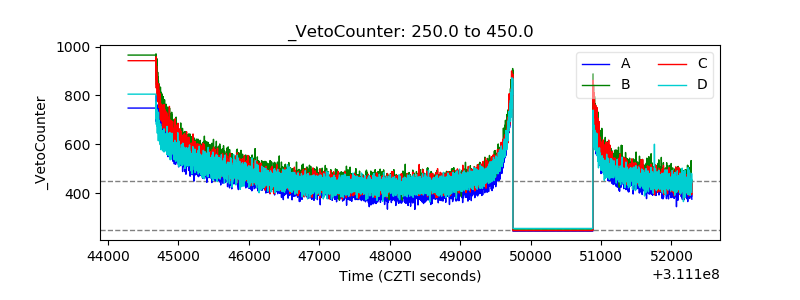 |