| Param | Original file | Final file |
|---|---|---|
| Filename | modeM0/AS1A07_018T08_9000003296_22279cztM0_level2.evt | modeM0/AS1A07_018T08_9000003296_22279cztM0_level2_quad_clean.evt |
| Size (bytes) | 487,497,600 | 91,854,720 |
| Size | 464.9 MB | 87.6 MB |
| Events in quadrant A | 3,297,245 | 593,142 |
| Events in quadrant B | 3,506,860 | 603,536 |
| Events in quadrant C | 3,290,439 | 566,423 |
| Events in quadrant D | 4,210,928 | 548,026 |
| Mode M9 | |||
|---|---|---|---|
| Quadrant | BADHDUFLAG | Total packets | Discarded packets |
| A | 0 | 8 | 0 |
| B | 0 | 8 | 0 |
| C | 0 | 8 | 0 |
| D | 0 | 8 | 0 |
| Mode M0 | |||
|---|---|---|---|
| Quadrant | BADHDUFLAG | Total packets | Discarded packets |
| A | 0 | 13840 | 1 |
| B | 0 | 14458 | 1 |
| C | 0 | 13862 | 1 |
| D | 0 | 16607 | 1 |
| Mode SS | |||
|---|---|---|---|
| Quadrant | BADHDUFLAG | Total packets | Discarded packets |
| A | 0 | 138 | 0 |
| B | 0 | 138 | 0 |
| C | 0 | 138 | 0 |
| D | 0 | 138 | 0 |
| Quadrant | Total seconds | Saturated seconds | Saturation percentage |
|---|---|---|---|
| A | 6745 | 90 | 1.334322% |
| B | 6746 | 116 | 1.719538% |
| C | 6746 | 125 | 1.852950% |
| D | 6746 | 259 | 3.839312% |
Noise dominated data is calculated using 1-second bins in cleaned event files. If a bin has >2000 counts, and if more than 50% of those come from <1% of pixels, then it is considered to be noise-dominated and hence unusable.
| Quadrant | # 1 sec bins | Bins with >0 counts | Bins with >2000 counts | High rate bins dominated by noise | Noise dominated (total time) | Noise dominated (detector-on time) | Marked lightcurve |
|---|---|---|---|---|---|---|---|
| A | 7555 | 6746 | 0 | 0 | 0.00% | 0.00% | 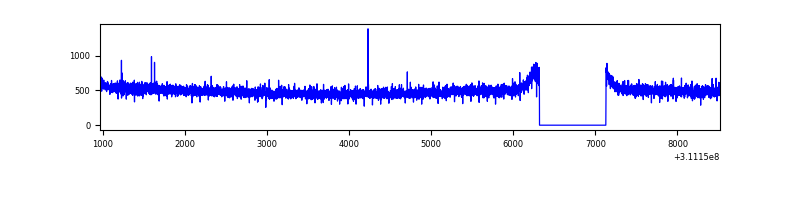 |
| B | 7556 | 6747 | 6 | 6 | 0.08% | 0.09% | 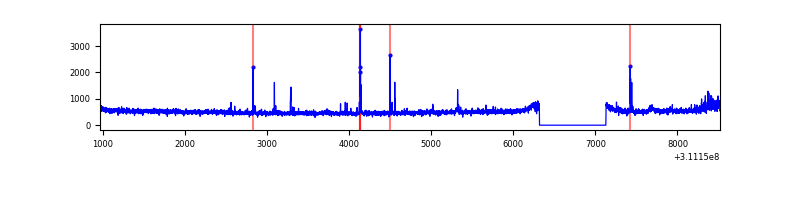 |
| C | 7556 | 6747 | 1 | 1 | 0.01% | 0.01% | 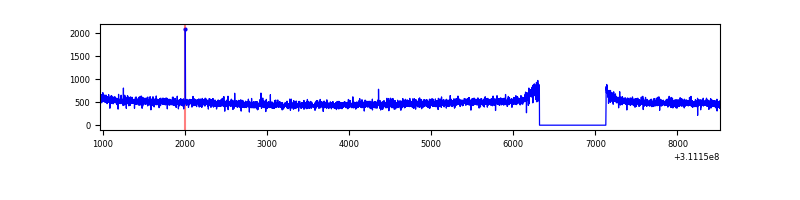 |
| D | 7556 | 6747 | 195 | 195 | 2.58% | 2.89% | 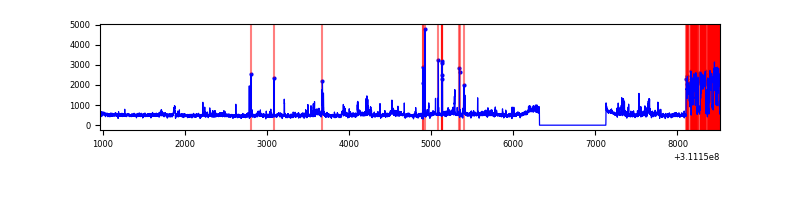 |
Top three noisy pixels from each quadrant. If the there are fewer than three noisy pixels in the level2.evt file, extra rows are filled as -1
| Pixel properties | Quadrant properties | ||||||
|---|---|---|---|---|---|---|---|
| Quadrant | DetID | PixID | Counts | Sigma | Mean | Median | Sigma |
| A | 13 | 254 | 9807 | 51.94 | 856 | 839 | 172.6 |
| A | 0 | 226 | 7252 | 37.15 | 856 | 839 | 172.6 |
| A | 3 | 137 | 7159 | 36.61 | 856 | 839 | 172.6 |
| B | 0 | 244 | 99707 | 607.05 | 850 | 829 | 162.9 |
| B | 3 | 64 | 46052 | 277.64 | 850 | 829 | 162.9 |
| B | 4 | 171 | 24913 | 147.86 | 850 | 829 | 162.9 |
| C | 14 | 238 | 130366 | 687.93 | 809 | 816 | 188.3 |
| C | 10 | 22 | 8534 | 40.98 | 809 | 816 | 188.3 |
| C | 13 | 61 | 5679 | 25.82 | 809 | 816 | 188.3 |
| D | 1 | 52 | 814244 | 4136.55 | 816 | 794 | 196.6 |
| D | 12 | 235 | 253570 | 1285.41 | 816 | 794 | 196.6 |
| D | 2 | 136 | 30962 | 153.41 | 816 | 794 | 196.6 |
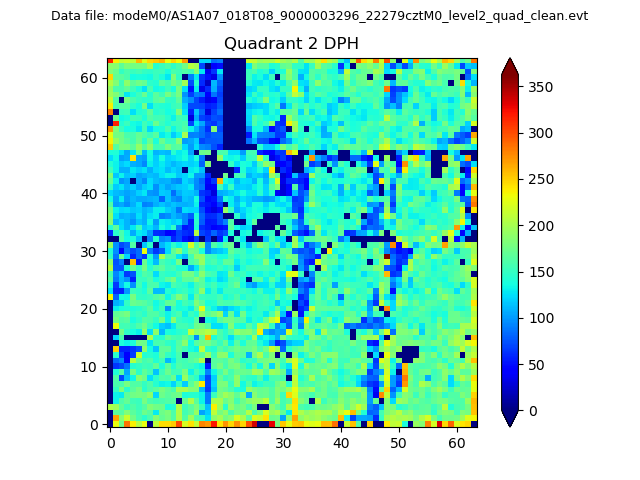
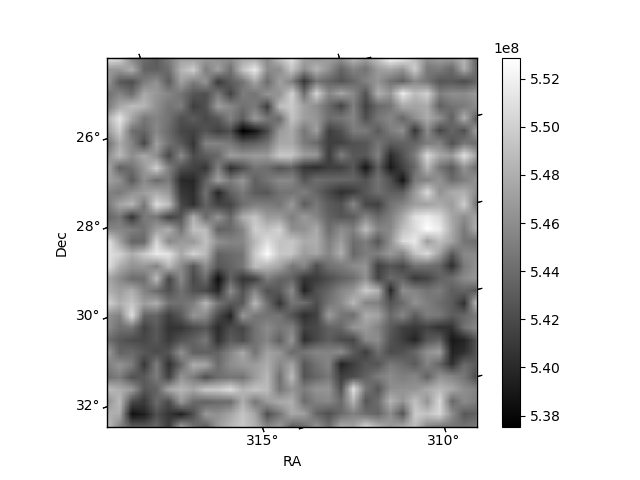
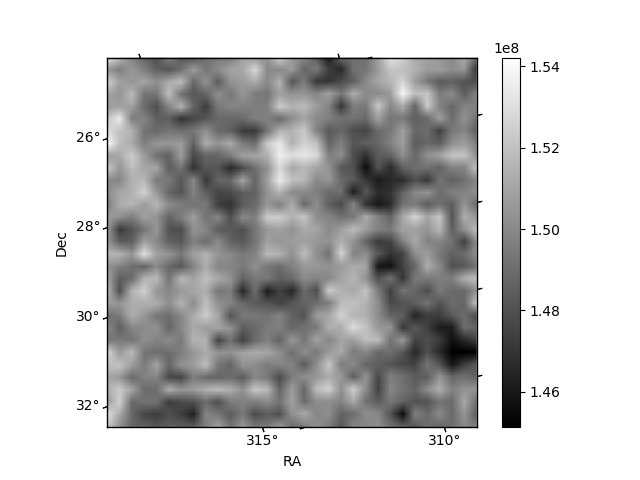
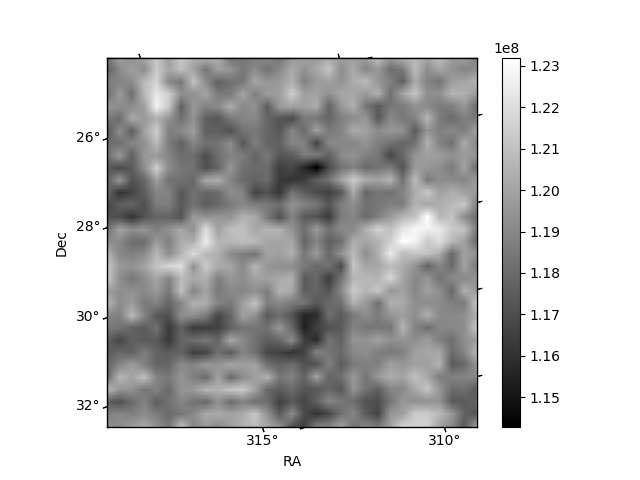
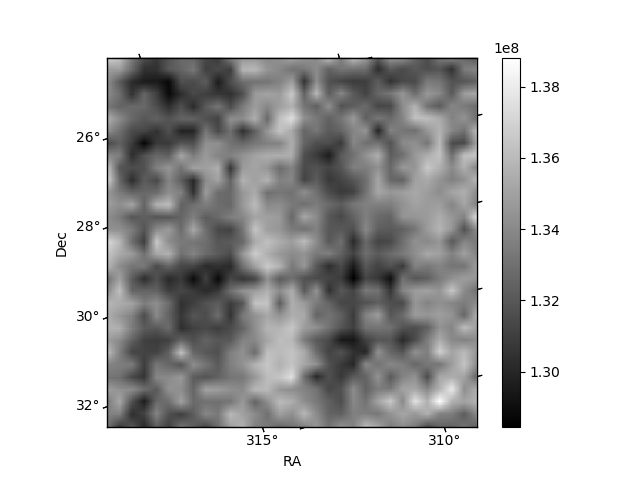
Histogram calculated using DETX and DETY for each event in the final _common_clean file
| Quadrant A | 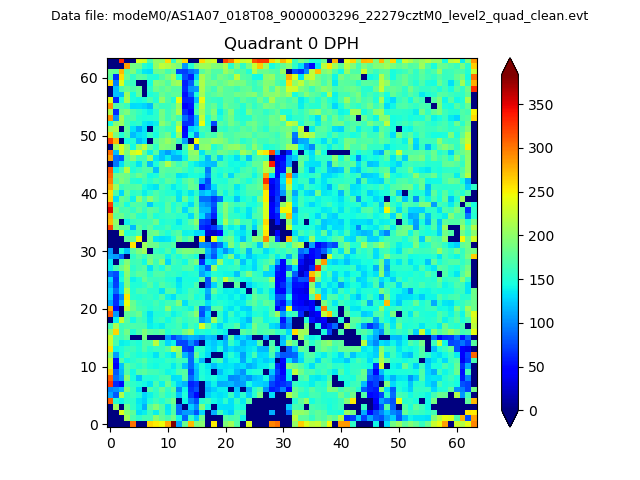 |
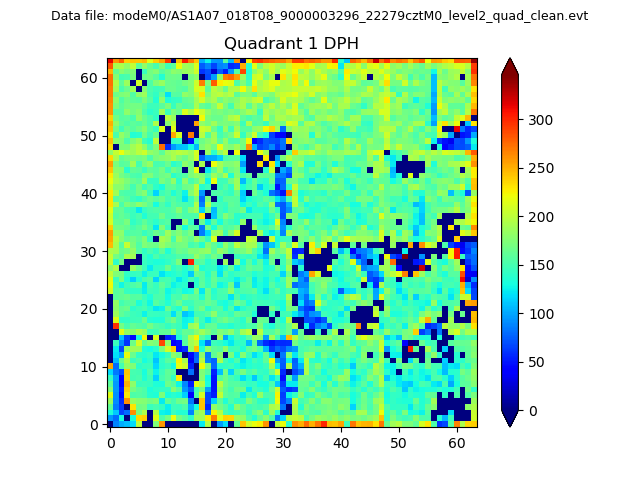 |
Quadrant B |
|---|---|---|---|
| Quadrant D | 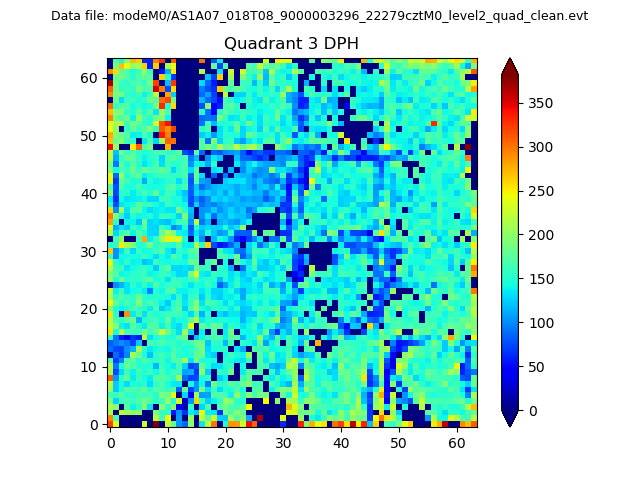 |
 |
Quadrant C |
| Plot type | Count rate plots | Images |
|---|---|---|
| Comparison with Poisson distribution Blue bars denote a histogram of data divided into 1 sec bins. Red curve is a Poisson curve with rate = median count rate of data. |
 |
 |
| Quadrant-wise count rates Data is divided into 100 sec bins |
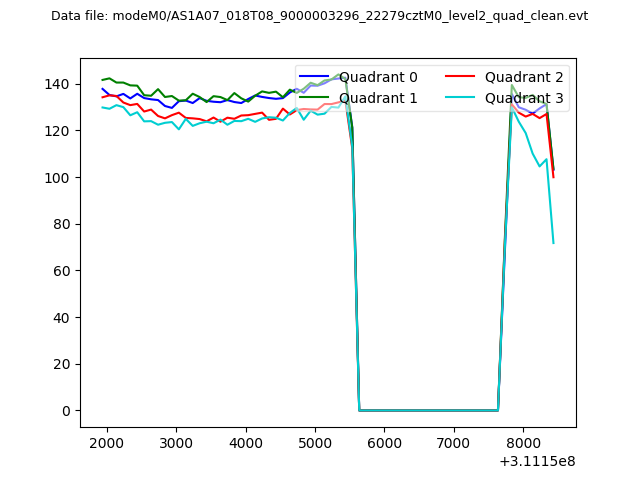 |
|
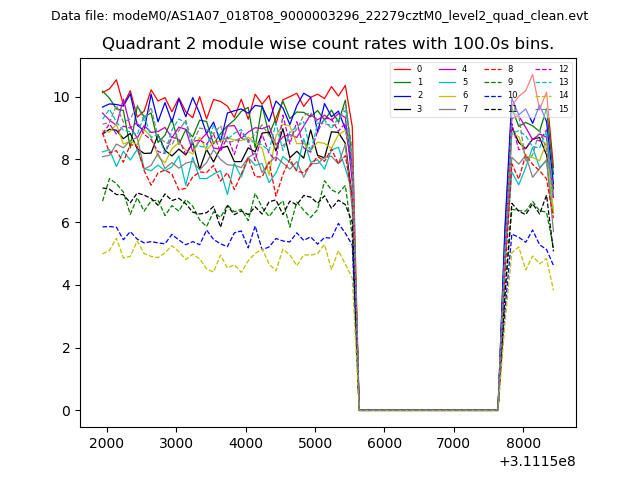
| Module-wise count rates for Quadrant A Data is divided into 100 sec bins |
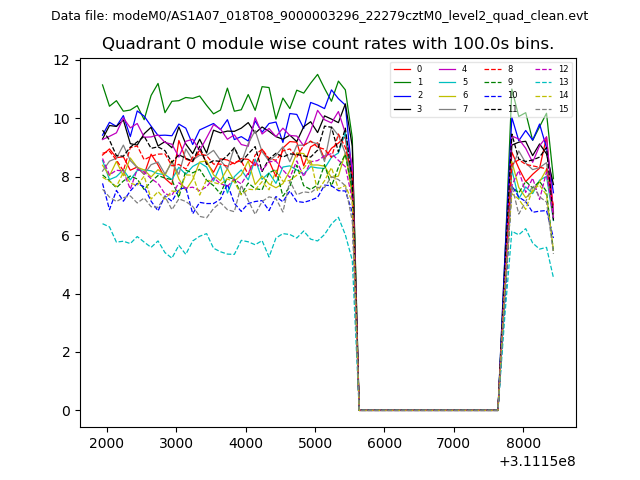 |
 |
| Module-wise count rates for Quadrant B Data is divided into 100 sec bins |
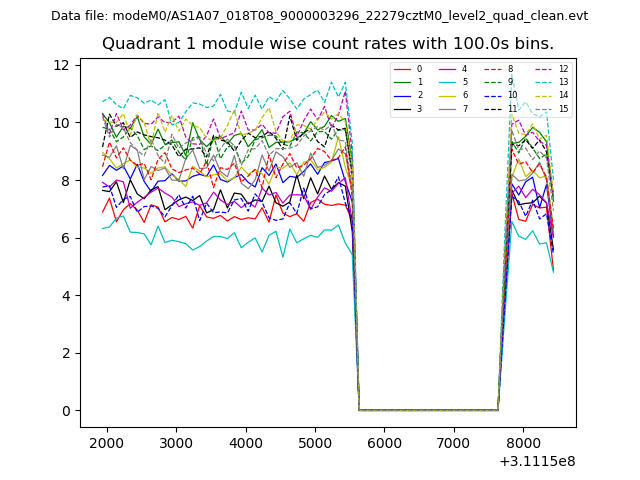 |
 |
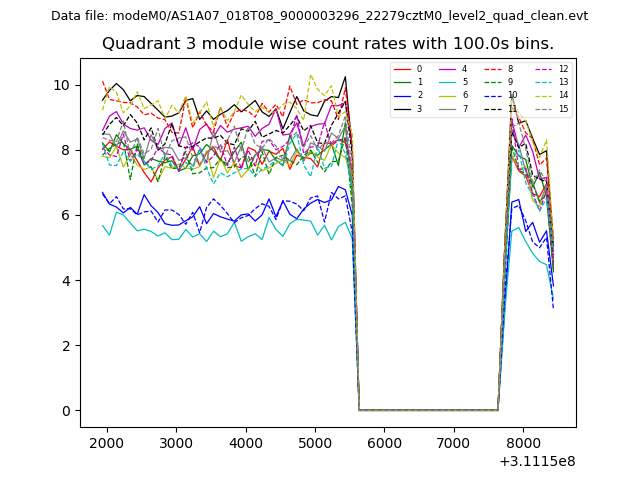
| Module-wise count rates for Quadrant C Data is divided into 100 sec bins |
 |
 |
| Module-wise count rates for Quadrant D Data is divided into 100 sec bins |
 |
 |
| Parameter | Plot |
|---|---|
| CZT HV Monitor | 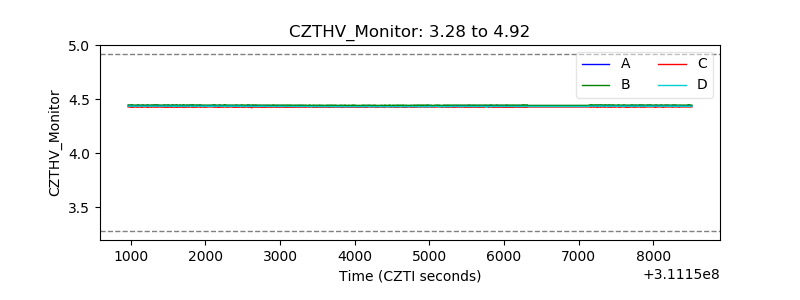 |
| D_VDD |  |
| Temperature 1 | 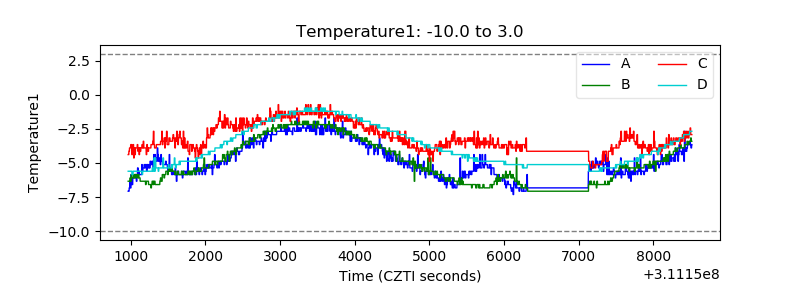 |
| Veto HV Monitor | 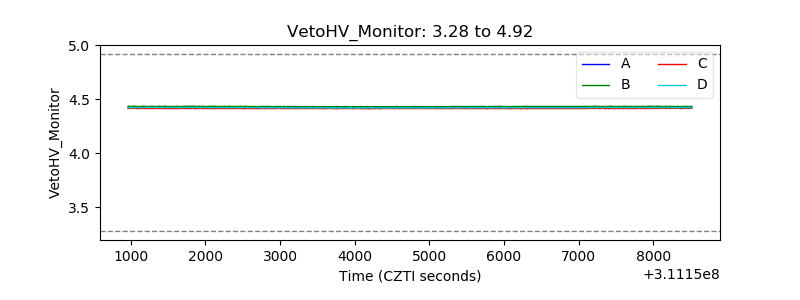 |
| Veto LLD | 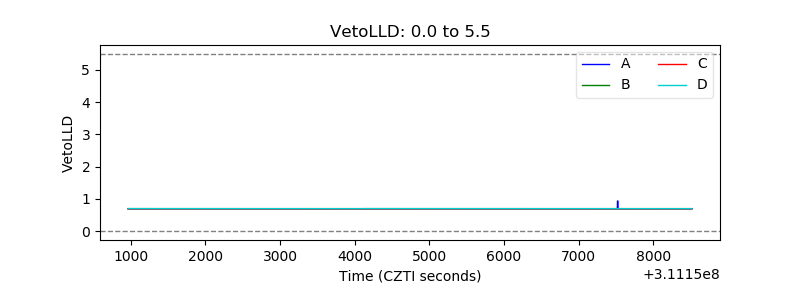 |
| Alpha Counter | 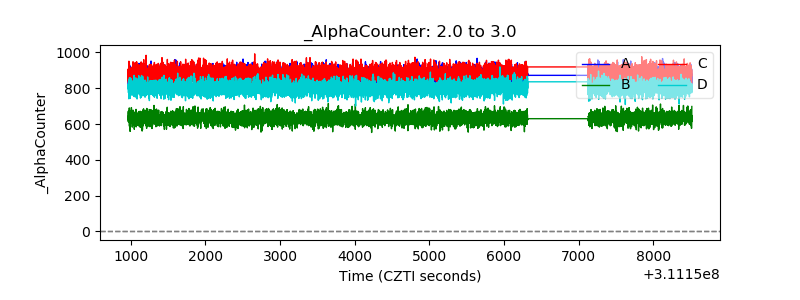 |
| _CPM_Rate | 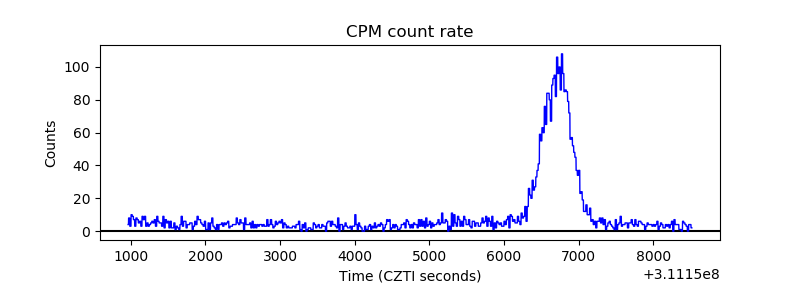 |
| CZT Counter | 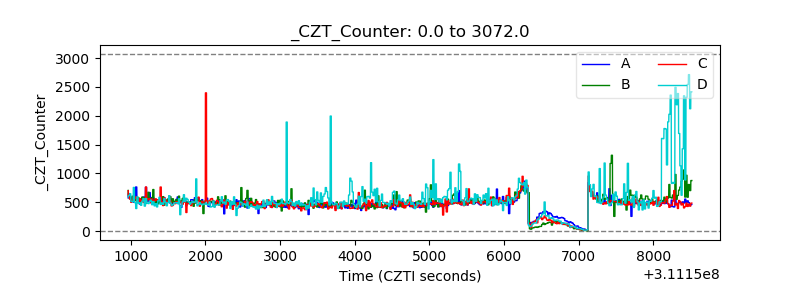 |
| +2.5 Volts monitor | 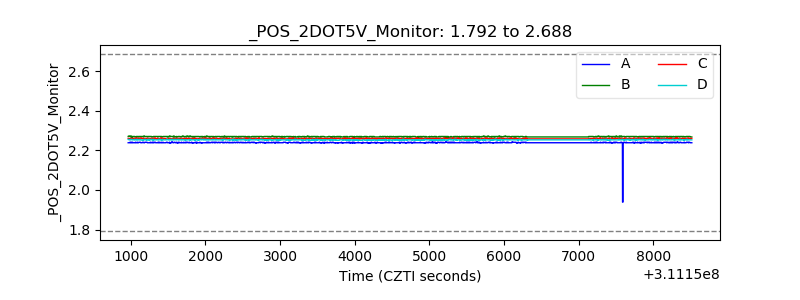 |
| +5 Volts monitor |  |
| _ROLL_ROT | 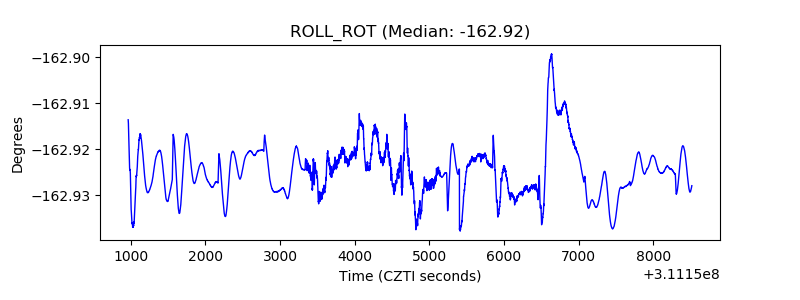 |
| _Roll_DEC | 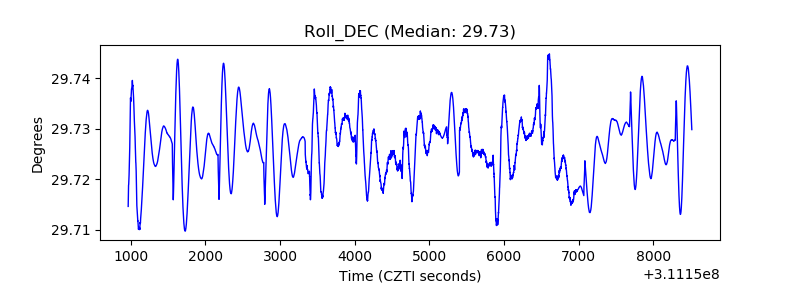 |
| _Roll_RA | 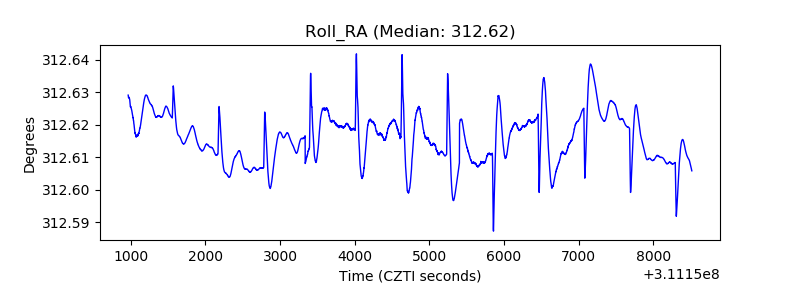 |
| Veto Counter | 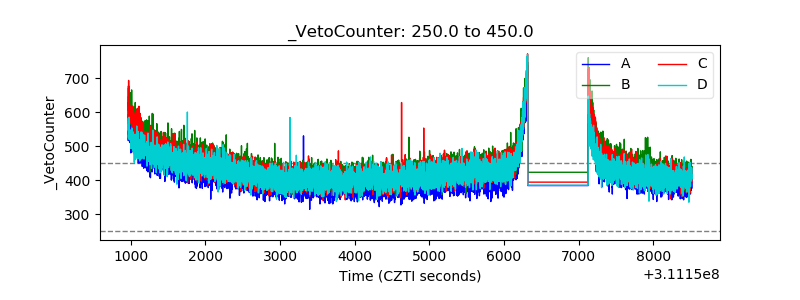 |