| Param | Original file | Final file |
|---|---|---|
| Filename | modeM0/AS1A07_018T08_9000003296_22282cztM0_level2.evt | modeM0/AS1A07_018T08_9000003296_22282cztM0_level2_quad_clean.evt |
| Size (bytes) | 523,284,480 | 106,407,360 |
| Size | 499.0 MB | 101.5 MB |
| Events in quadrant A | 3,585,846 | 688,648 |
| Events in quadrant B | 3,677,406 | 697,667 |
| Events in quadrant C | 3,602,946 | 661,573 |
| Events in quadrant D | 4,464,800 | 645,174 |
| Mode M9 | |||
|---|---|---|---|
| Quadrant | BADHDUFLAG | Total packets | Discarded packets |
| A | 0 | 3 | 0 |
| B | 0 | 3 | 0 |
| C | 0 | 3 | 0 |
| D | 0 | 3 | 0 |
| Mode M0 | |||
|---|---|---|---|
| Quadrant | BADHDUFLAG | Total packets | Discarded packets |
| A | 0 | 15662 | 1 |
| B | 0 | 15823 | 1 |
| C | 0 | 15662 | 1 |
| D | 0 | 18428 | 1 |
| Mode SS | |||
|---|---|---|---|
| Quadrant | BADHDUFLAG | Total packets | Discarded packets |
| A | 0 | 156 | 0 |
| B | 0 | 156 | 0 |
| C | 0 | 156 | 0 |
| D | 0 | 156 | 0 |
| Quadrant | Total seconds | Saturated seconds | Saturation percentage |
|---|---|---|---|
| A | 7604 | 88 | 1.157286% |
| B | 7604 | 93 | 1.223041% |
| C | 7604 | 104 | 1.367701% |
| D | 7605 | 145 | 1.906640% |
Noise dominated data is calculated using 1-second bins in cleaned event files. If a bin has >2000 counts, and if more than 50% of those come from <1% of pixels, then it is considered to be noise-dominated and hence unusable.
| Quadrant | # 1 sec bins | Bins with >0 counts | Bins with >2000 counts | High rate bins dominated by noise | Noise dominated (total time) | Noise dominated (detector-on time) | Marked lightcurve |
|---|---|---|---|---|---|---|---|
| A | 7914 | 7605 | 0 | 0 | 0.00% | 0.00% | 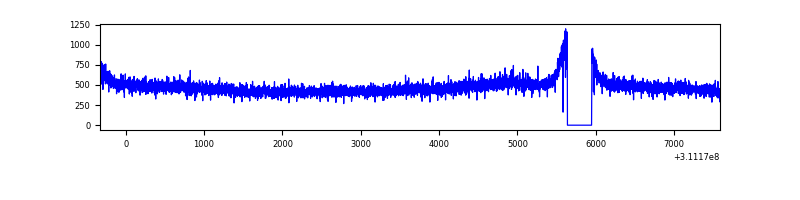 |
| B | 7914 | 7605 | 2 | 2 | 0.03% | 0.03% | 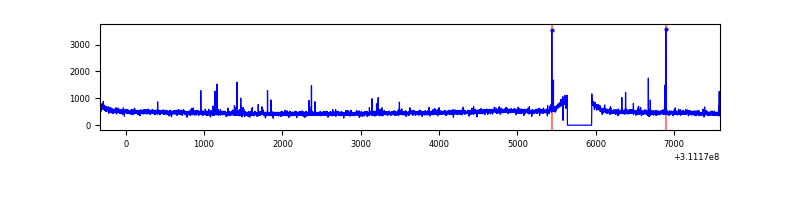 |
| C | 7914 | 7605 | 0 | 0 | 0.00% | 0.00% | 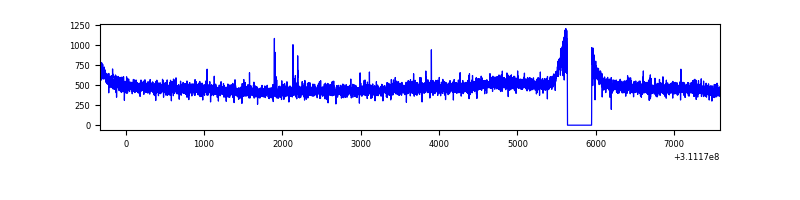 |
| D | 7915 | 7606 | 46 | 46 | 0.58% | 0.60% | 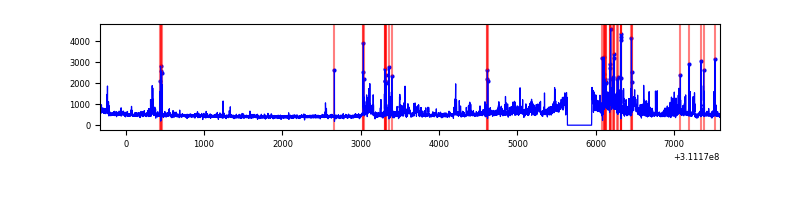 |
Top three noisy pixels from each quadrant. If the there are fewer than three noisy pixels in the level2.evt file, extra rows are filled as -1
| Pixel properties | Quadrant properties | ||||||
|---|---|---|---|---|---|---|---|
| Quadrant | DetID | PixID | Counts | Sigma | Mean | Median | Sigma |
| A | 13 | 254 | 10647 | 51.43 | 930 | 907 | 189.4 |
| A | 3 | 137 | 8250 | 38.77 | 930 | 907 | 189.4 |
| A | 0 | 226 | 7969 | 37.29 | 930 | 907 | 189.4 |
| B | 3 | 64 | 35308 | 191.07 | 924 | 898 | 180.1 |
| B | 12 | 111 | 22122 | 117.85 | 924 | 898 | 180.1 |
| B | 11 | 111 | 20221 | 107.29 | 924 | 898 | 180.1 |
| C | 14 | 238 | 139697 | 664.56 | 887 | 892 | 208.9 |
| C | 10 | 22 | 7918 | 33.64 | 887 | 892 | 208.9 |
| C | 13 | 61 | 6176 | 25.3 | 887 | 892 | 208.9 |
| D | 1 | 52 | 929180 | 4246.71 | 899 | 872 | 218.6 |
| D | 12 | 235 | 97070 | 440.07 | 899 | 872 | 218.6 |
| D | 2 | 234 | 37344 | 166.85 | 899 | 872 | 218.6 |
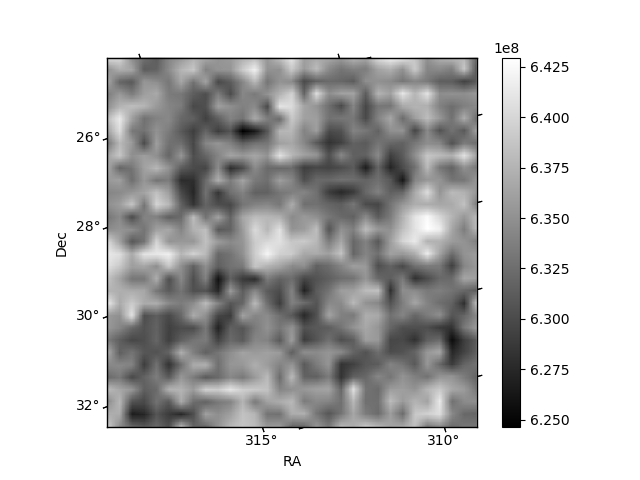
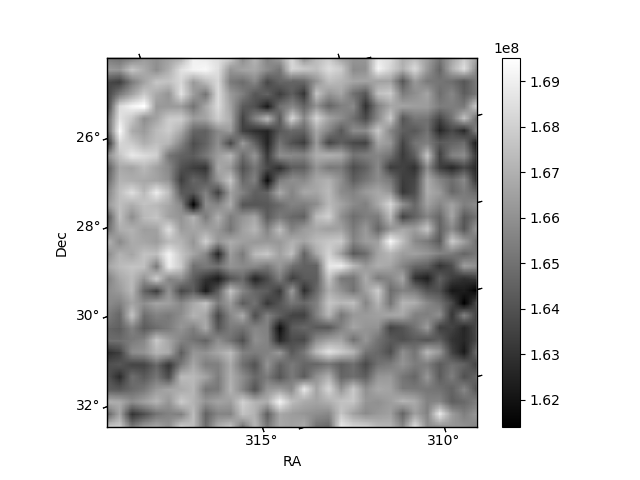
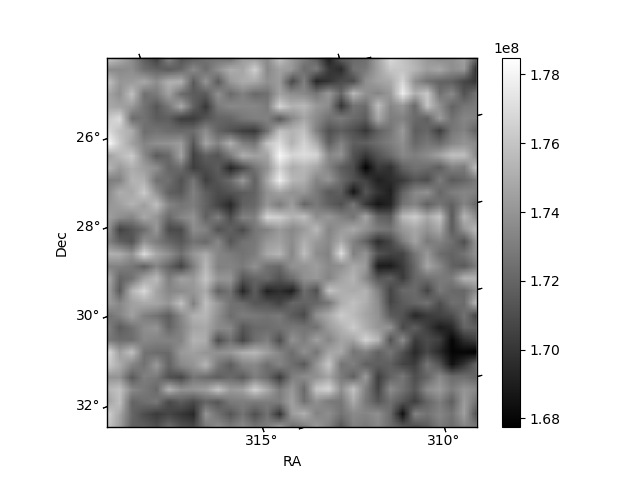
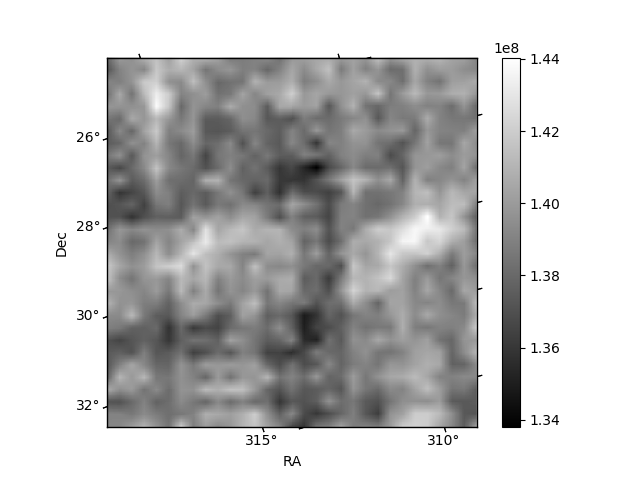
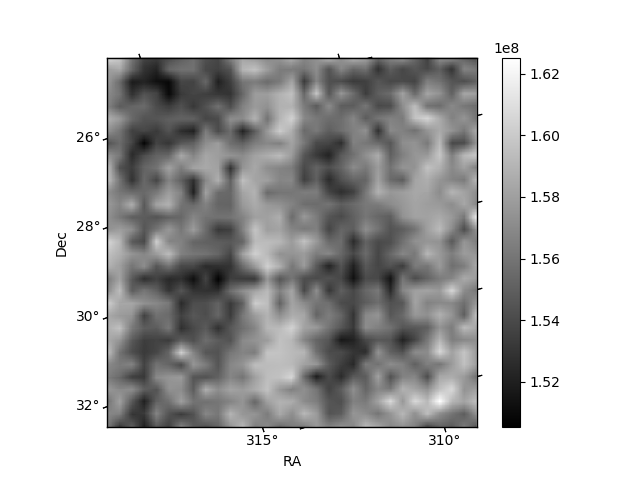
Histogram calculated using DETX and DETY for each event in the final _common_clean file
| Quadrant A | 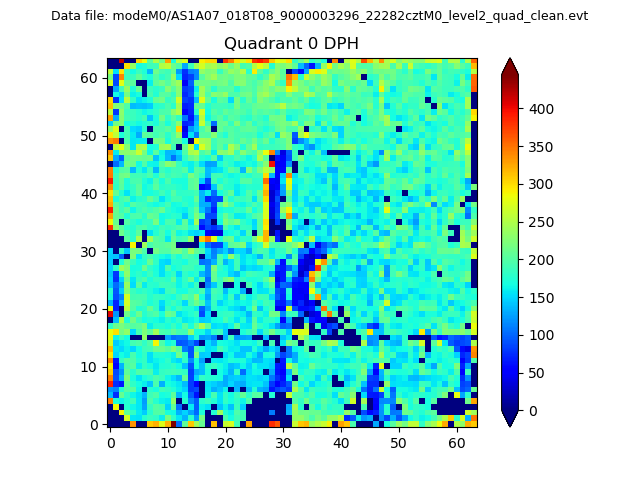 |
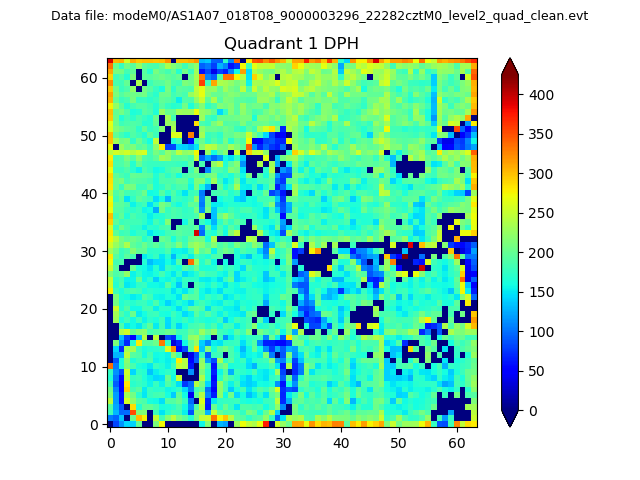 |
Quadrant B |
|---|---|---|---|
| Quadrant D | 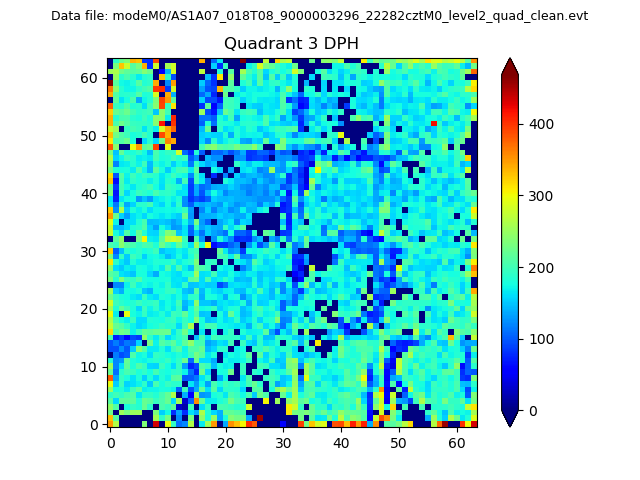 |
 |
Quadrant C |
| Plot type | Count rate plots | Images |
|---|---|---|
| Comparison with Poisson distribution Blue bars denote a histogram of data divided into 1 sec bins. Red curve is a Poisson curve with rate = median count rate of data. |
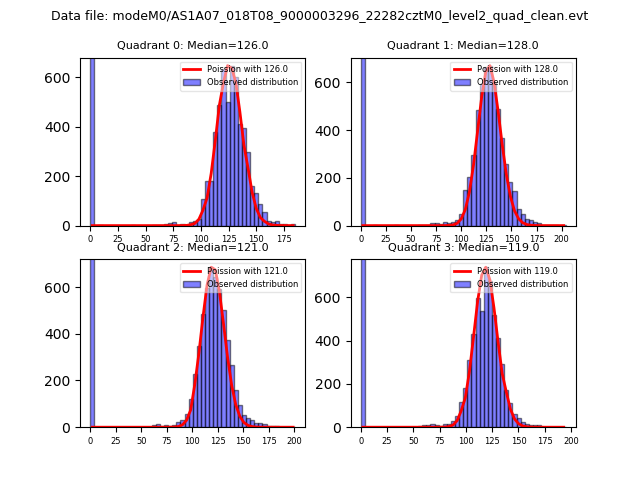 |
 |
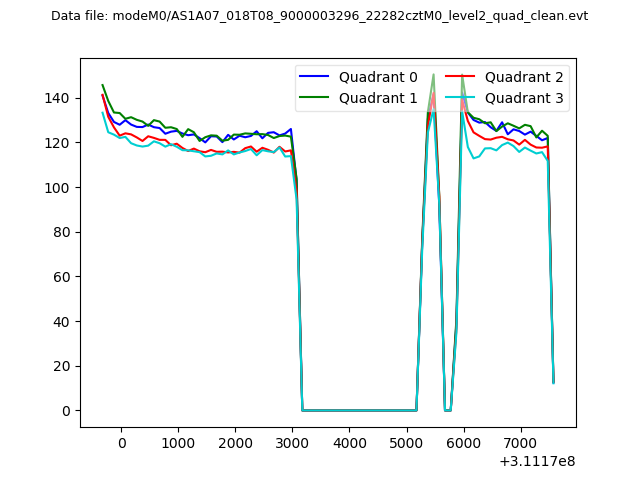
| Quadrant-wise count rates Data is divided into 100 sec bins |
 |
|
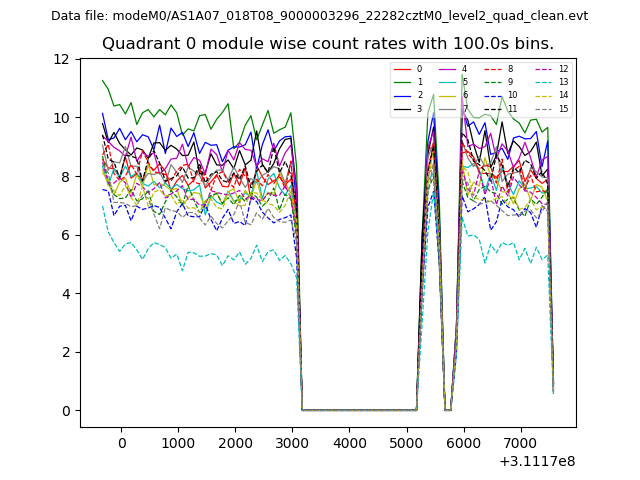
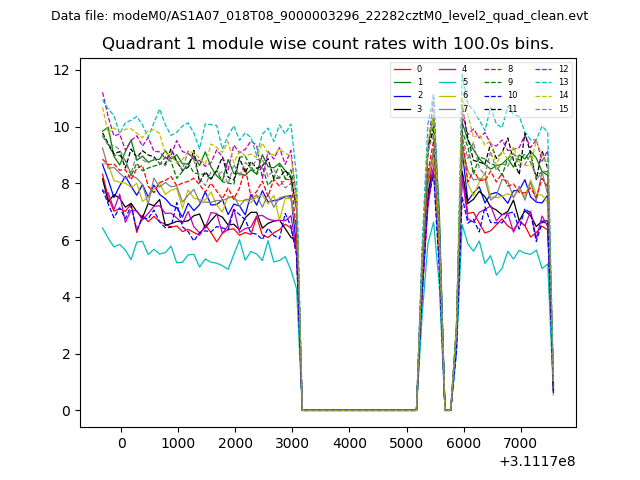
| Module-wise count rates for Quadrant A Data is divided into 100 sec bins |
 |
 |
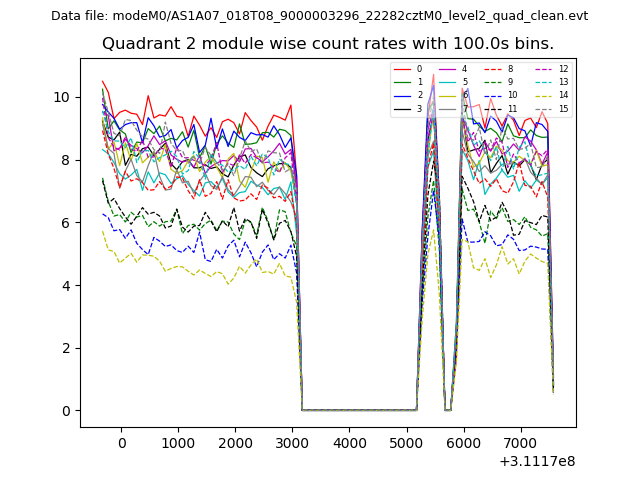
| Module-wise count rates for Quadrant B Data is divided into 100 sec bins |
 |
 |
| Module-wise count rates for Quadrant C Data is divided into 100 sec bins |
 |
 |
| Module-wise count rates for Quadrant D Data is divided into 100 sec bins |
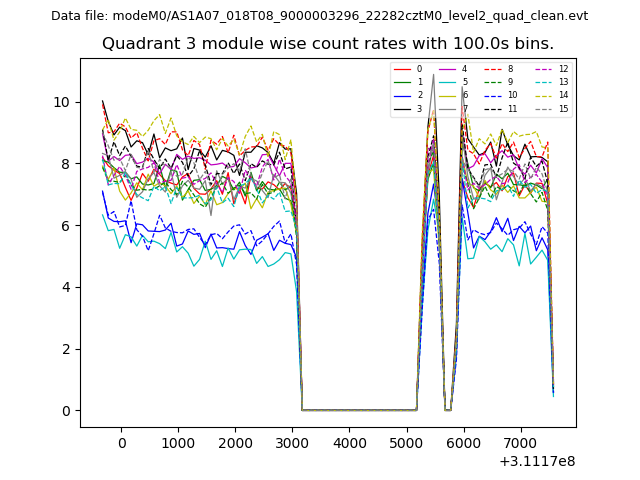 |
 |
| Parameter | Plot |
|---|---|
| CZT HV Monitor | 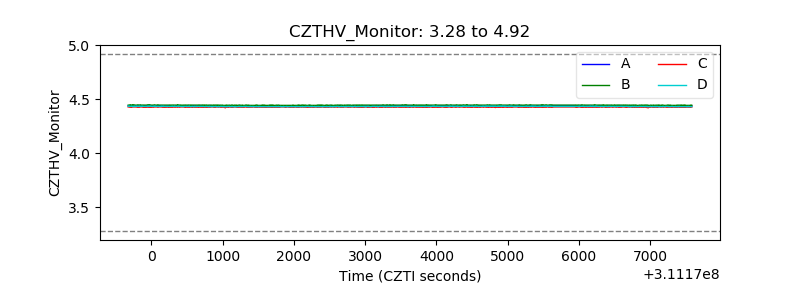 |
| D_VDD | 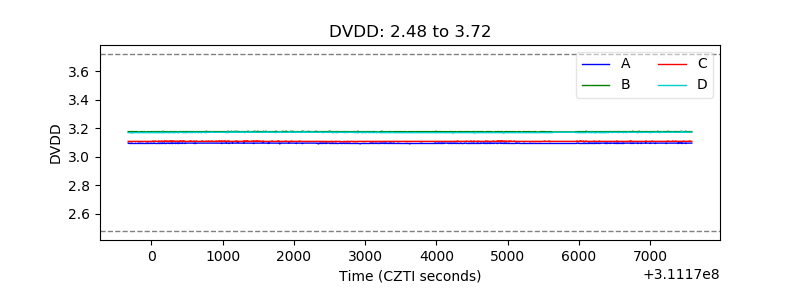 |
| Temperature 1 | 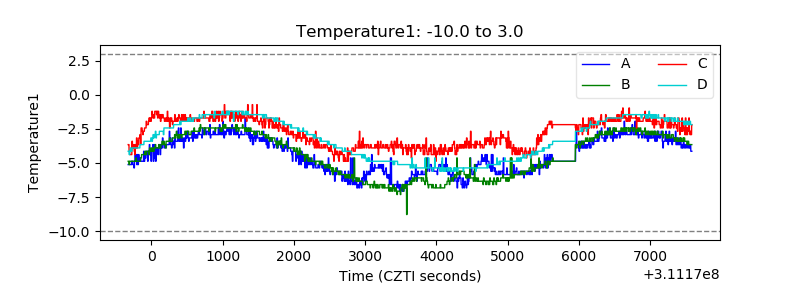 |
| Veto HV Monitor |  |
| Veto LLD | 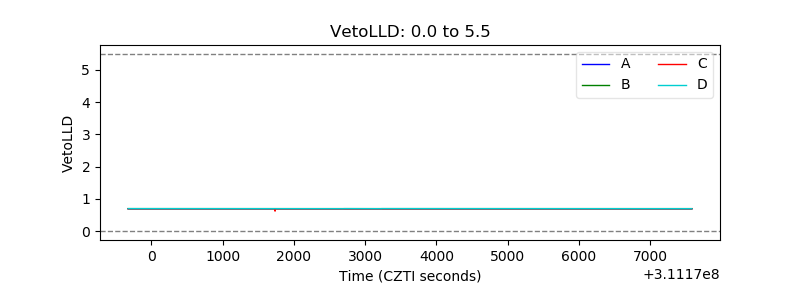 |
| Alpha Counter | 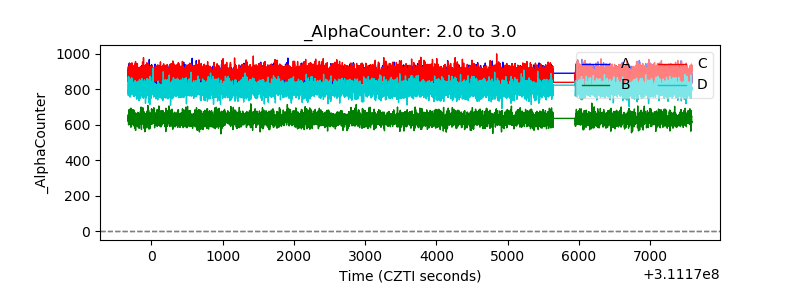 |
| _CPM_Rate | 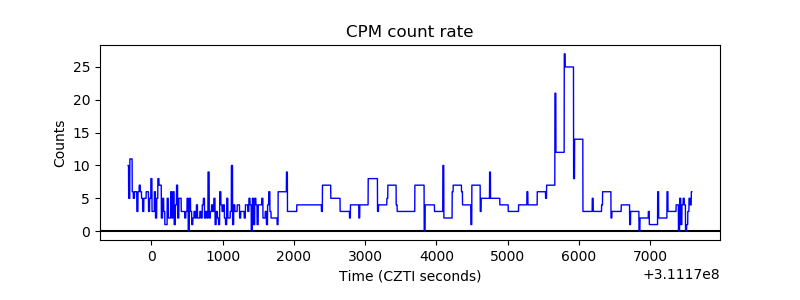 |
| CZT Counter |  |
| +2.5 Volts monitor |  |
| +5 Volts monitor |  |
| _ROLL_ROT | 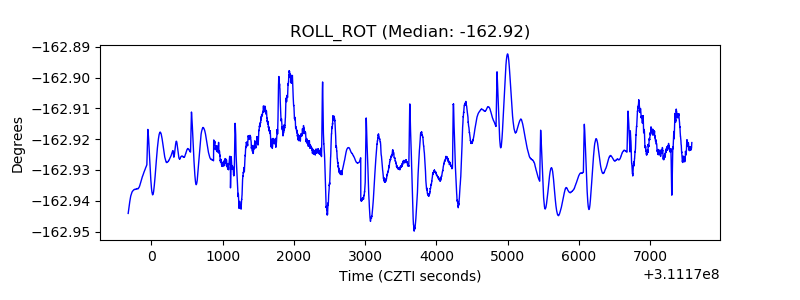 |
| _Roll_DEC | 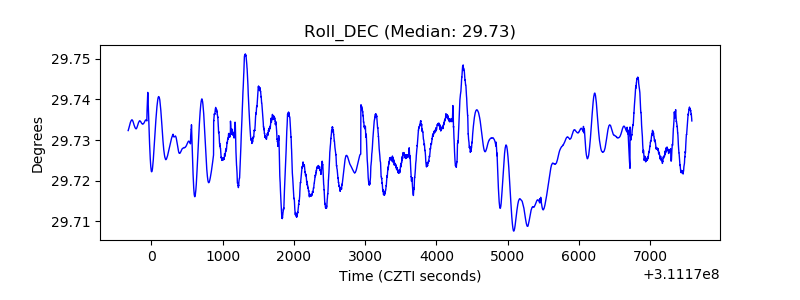 |
| _Roll_RA | 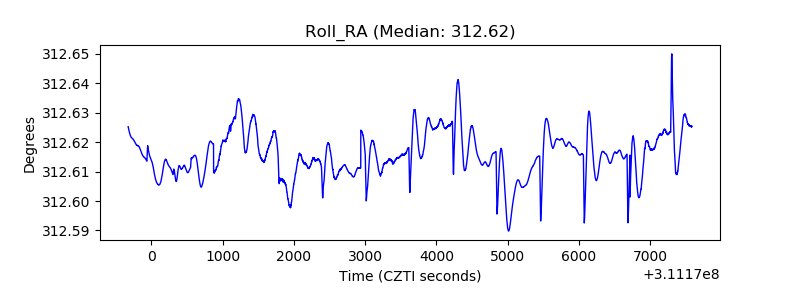 |
| Veto Counter | 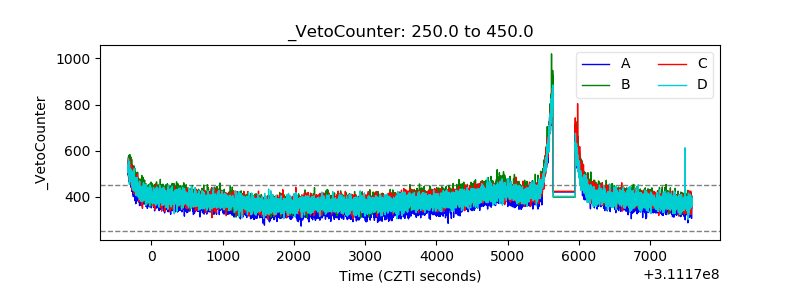 |