| Param | Original file | Final file |
|---|---|---|
| Filename | modeM0/AS1A07_018T08_9000003296_22286cztM0_level2.evt | modeM0/AS1A07_018T08_9000003296_22286cztM0_level2_quad_clean.evt |
| Size (bytes) | 450,446,400 | 90,486,720 |
| Size | 429.6 MB | 86.3 MB |
| Events in quadrant A | 3,071,584 | 581,763 |
| Events in quadrant B | 3,180,247 | 595,701 |
| Events in quadrant C | 3,132,924 | 563,289 |
| Events in quadrant D | 3,810,601 | 541,532 |
| Mode M9 | |||
|---|---|---|---|
| Quadrant | BADHDUFLAG | Total packets | Discarded packets |
| A | 0 | 15 | 0 |
| B | 0 | 16 | 0 |
| C | 0 | 16 | 0 |
| D | 0 | 16 | 0 |
| Mode M0 | |||
|---|---|---|---|
| Quadrant | BADHDUFLAG | Total packets | Discarded packets |
| A | 0 | 13363 | 2 |
| B | 0 | 13602 | 2 |
| C | 0 | 13433 | 2 |
| D | 0 | 15656 | 2 |
| Mode SS | |||
|---|---|---|---|
| Quadrant | BADHDUFLAG | Total packets | Discarded packets |
| A | 0 | 132 | 0 |
| B | 0 | 132 | 0 |
| C | 0 | 132 | 0 |
| D | 0 | 132 | 0 |
| Quadrant | Total seconds | Saturated seconds | Saturation percentage |
|---|---|---|---|
| A | 6570 | 12 | 0.182648% |
| B | 6570 | 23 | 0.350076% |
| C | 6570 | 41 | 0.624049% |
| D | 6570 | 138 | 2.100457% |
Noise dominated data is calculated using 1-second bins in cleaned event files. If a bin has >2000 counts, and if more than 50% of those come from <1% of pixels, then it is considered to be noise-dominated and hence unusable.
| Quadrant | # 1 sec bins | Bins with >0 counts | Bins with >2000 counts | High rate bins dominated by noise | Noise dominated (total time) | Noise dominated (detector-on time) | Marked lightcurve |
|---|---|---|---|---|---|---|---|
| A | 7630 | 6571 | 0 | 0 | 0.00% | 0.00% | 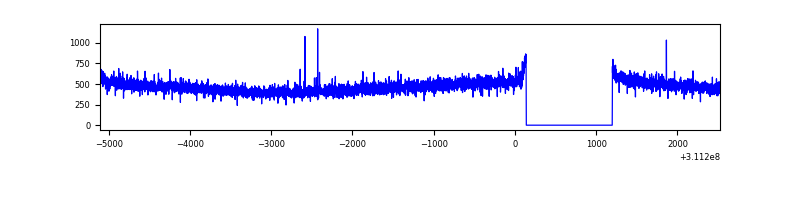 |
| B | 7630 | 6571 | 3 | 3 | 0.04% | 0.05% | 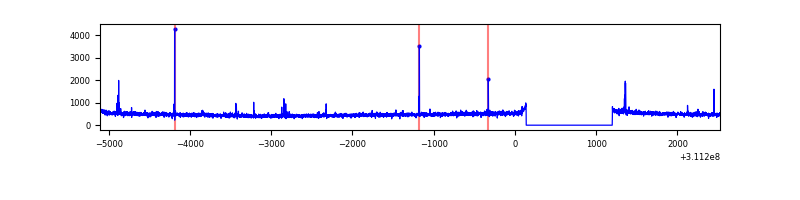 |
| C | 7630 | 6571 | 0 | 0 | 0.00% | 0.00% | 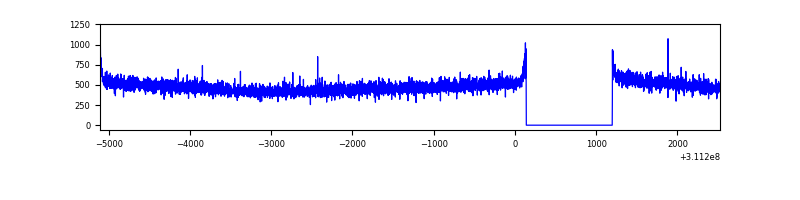 |
| D | 7630 | 6571 | 114 | 114 | 1.49% | 1.73% | 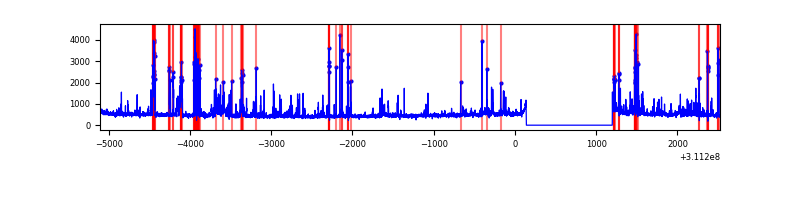 |
Top three noisy pixels from each quadrant. If the there are fewer than three noisy pixels in the level2.evt file, extra rows are filled as -1
| Pixel properties | Quadrant properties | ||||||
|---|---|---|---|---|---|---|---|
| Quadrant | DetID | PixID | Counts | Sigma | Mean | Median | Sigma |
| A | 13 | 254 | 8918 | 50.6 | 796 | 778 | 160.8 |
| A | 3 | 137 | 6869 | 37.87 | 796 | 778 | 160.8 |
| A | 0 | 226 | 6821 | 37.57 | 796 | 778 | 160.8 |
| B | 3 | 64 | 49573 | 316.56 | 798 | 778 | 154.1 |
| B | 12 | 111 | 18749 | 116.59 | 798 | 778 | 154.1 |
| B | 11 | 111 | 16803 | 103.96 | 798 | 778 | 154.1 |
| C | 14 | 238 | 121198 | 667.28 | 771 | 776 | 180.5 |
| C | 0 | 10 | 7097 | 35.03 | 771 | 776 | 180.5 |
| C | 13 | 61 | 5180 | 24.4 | 771 | 776 | 180.5 |
| D | 1 | 52 | 796215 | 4268.18 | 771 | 749 | 186.4 |
| D | 2 | 234 | 26675 | 139.11 | 771 | 749 | 186.4 |
| D | 2 | 136 | 24928 | 129.74 | 771 | 749 | 186.4 |
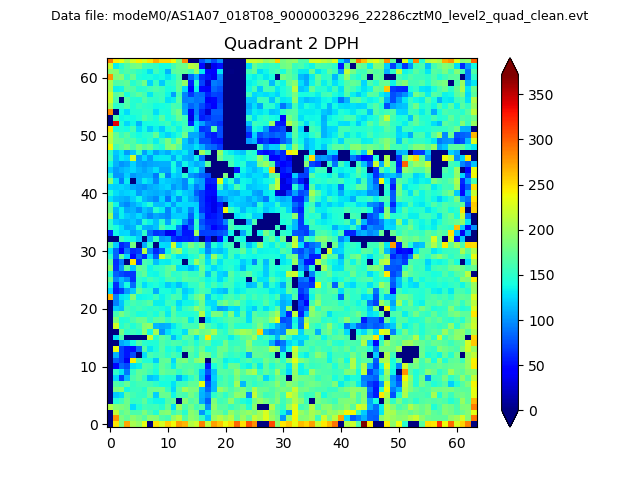
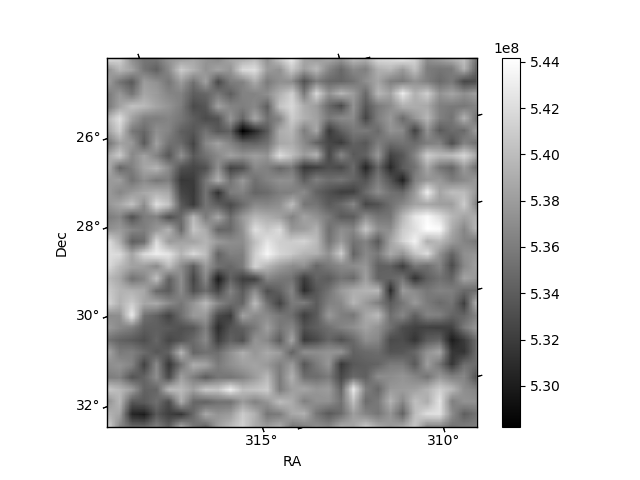
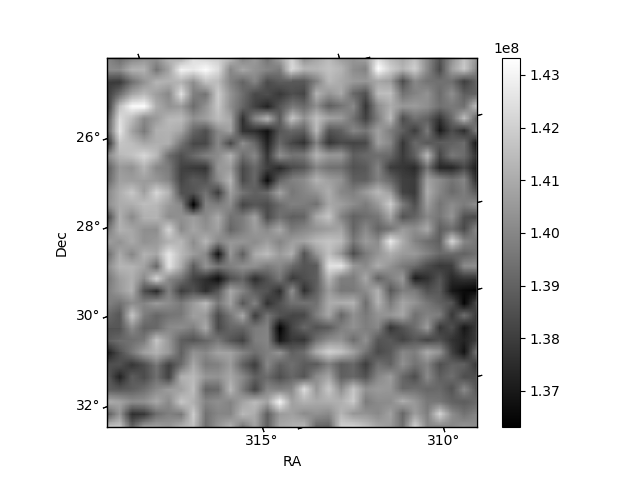
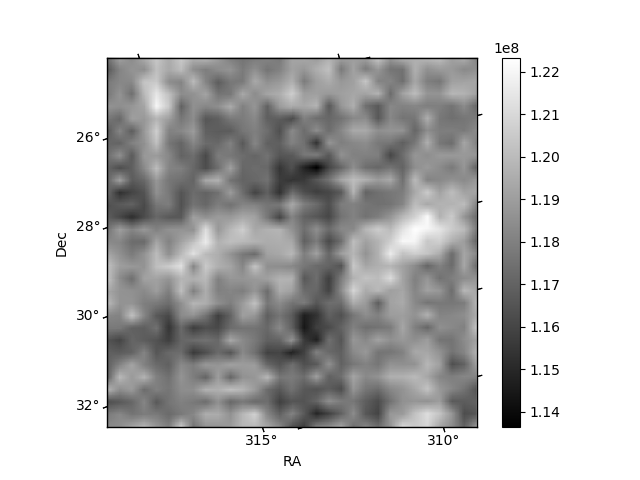
Histogram calculated using DETX and DETY for each event in the final _common_clean file
| Quadrant A | 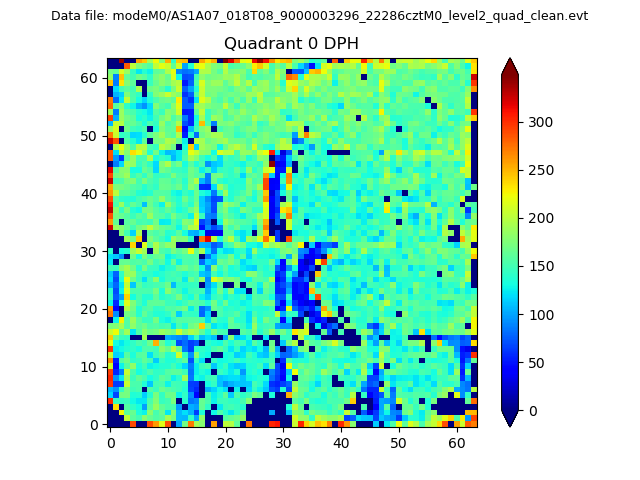 |
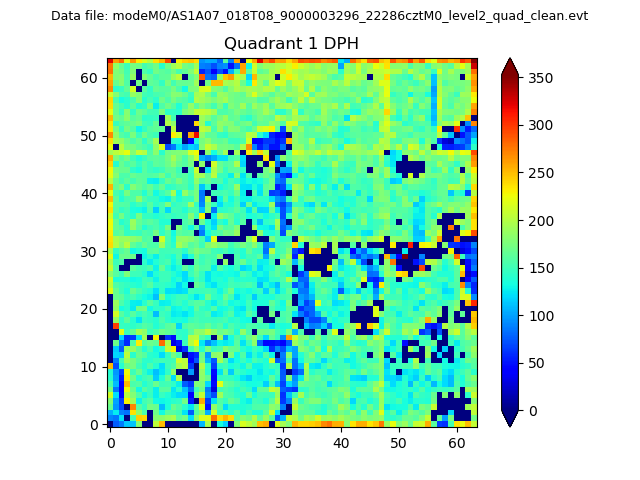 |
Quadrant B |
|---|---|---|---|
| Quadrant D | 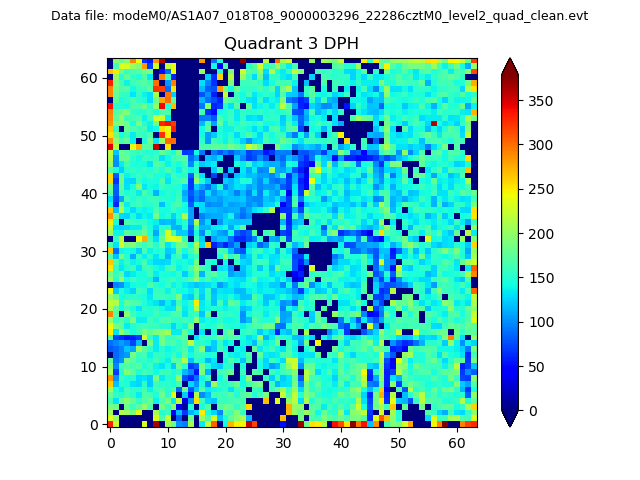 |
 |
Quadrant C |
| Plot type | Count rate plots | Images |
|---|---|---|
| Comparison with Poisson distribution Blue bars denote a histogram of data divided into 1 sec bins. Red curve is a Poisson curve with rate = median count rate of data. |
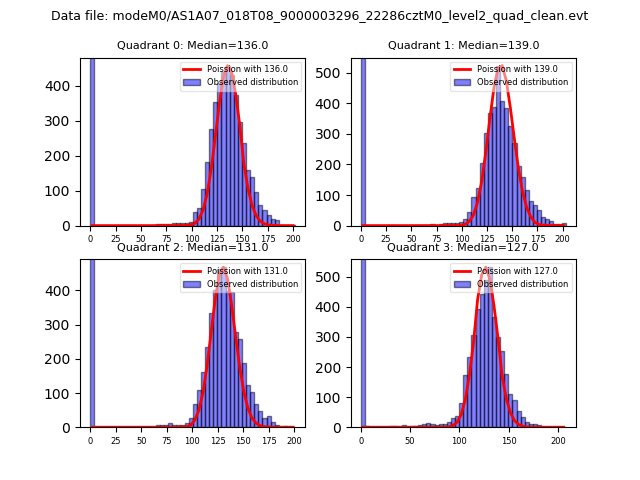 |
 |
| Quadrant-wise count rates Data is divided into 100 sec bins |
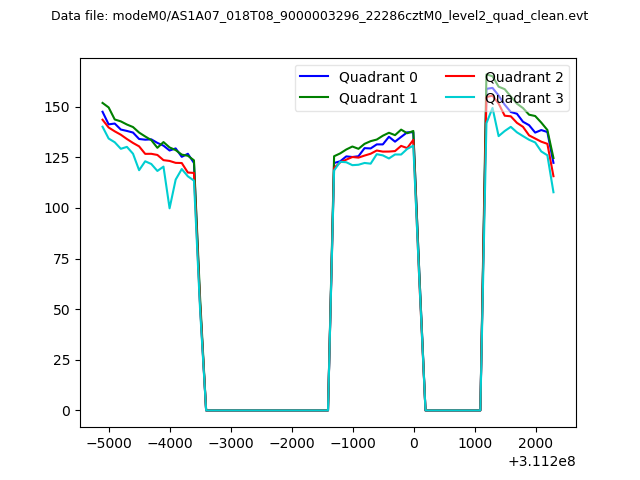 |
|
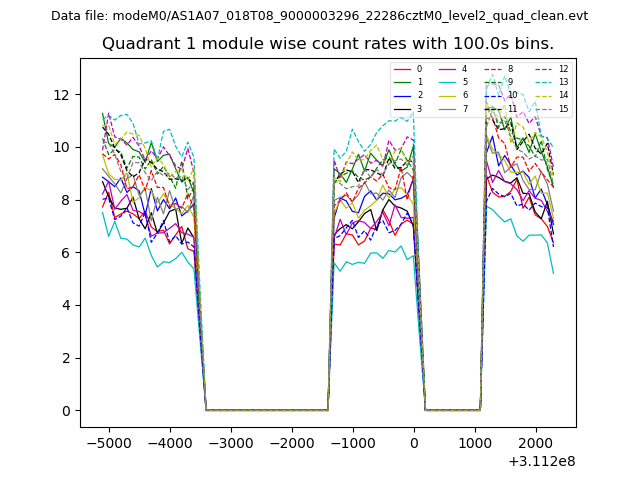
| Module-wise count rates for Quadrant A Data is divided into 100 sec bins |
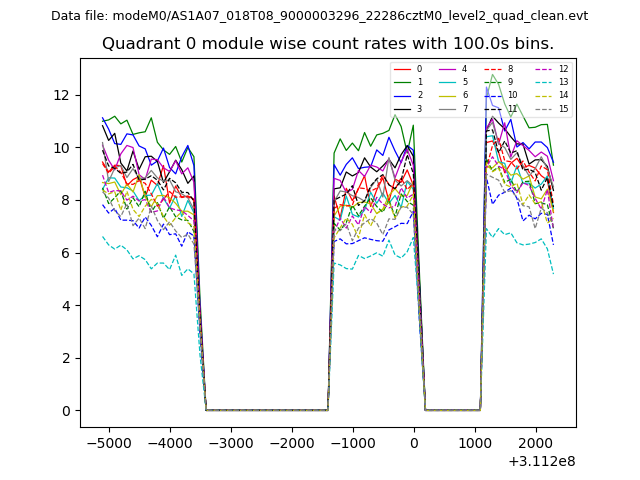 |
 |
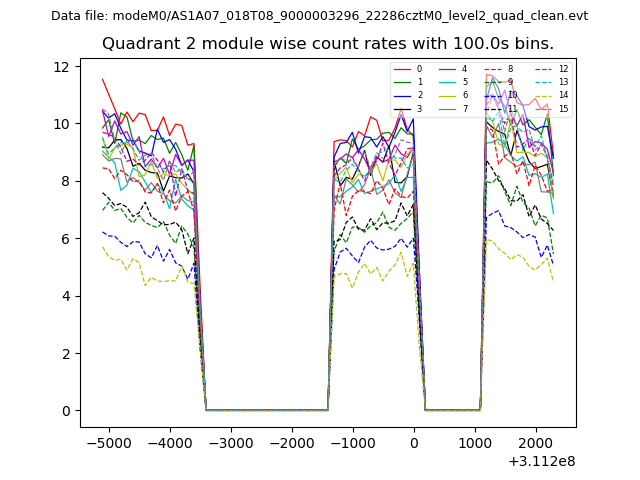
| Module-wise count rates for Quadrant B Data is divided into 100 sec bins |
 |
 |
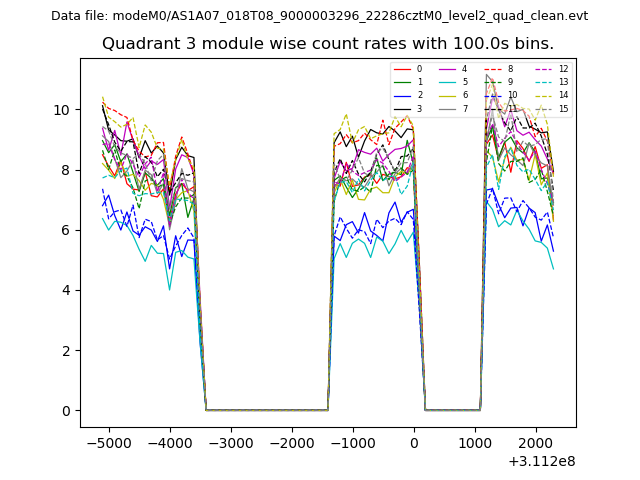
| Module-wise count rates for Quadrant C Data is divided into 100 sec bins |
 |
 |
| Module-wise count rates for Quadrant D Data is divided into 100 sec bins |
 |
 |
| Parameter | Plot |
|---|---|
| CZT HV Monitor | 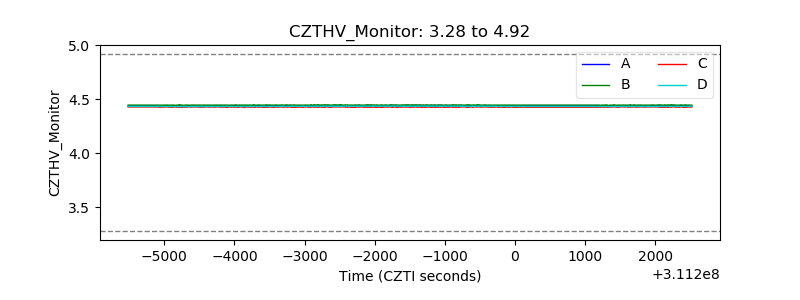 |
| D_VDD | 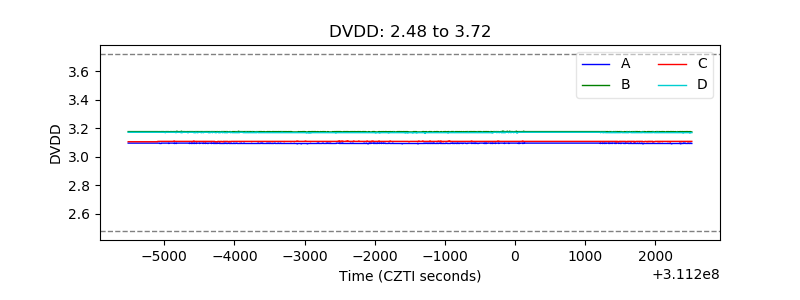 |
| Temperature 1 | 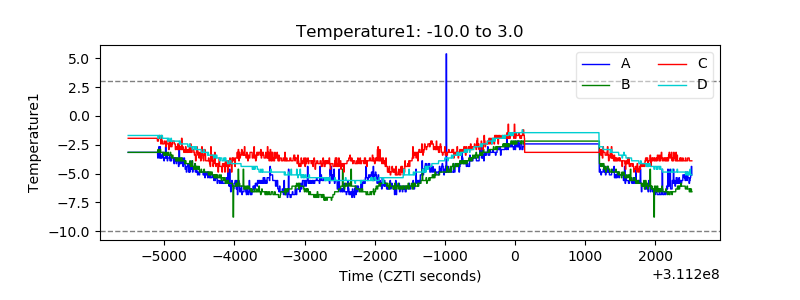 |
| Veto HV Monitor | 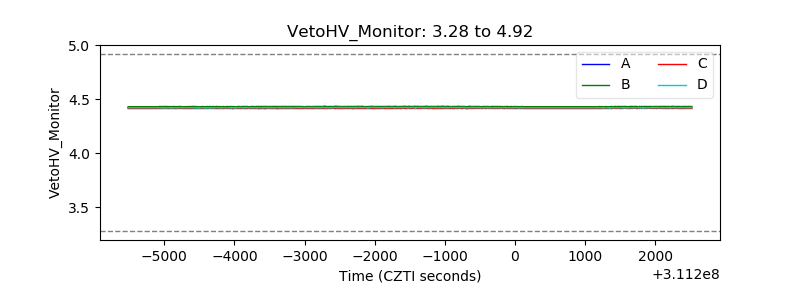 |
| Veto LLD | 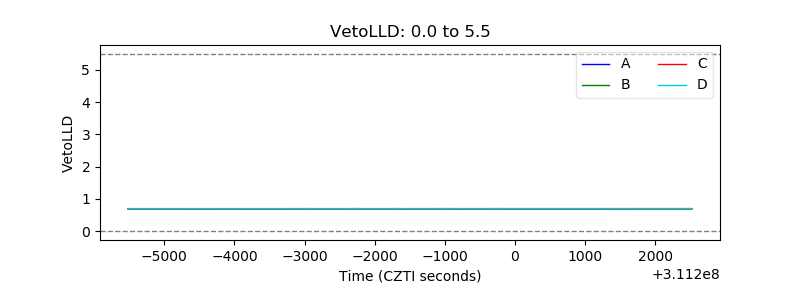 |
| Alpha Counter | 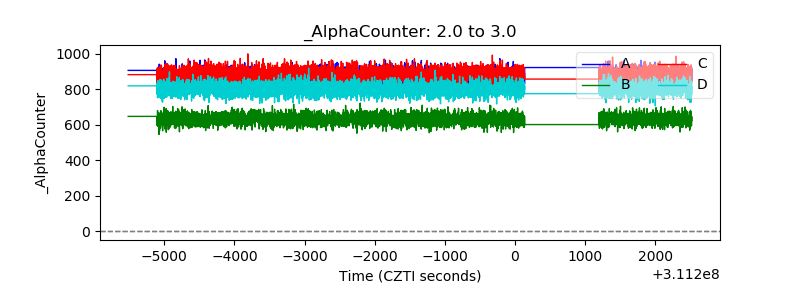 |
| _CPM_Rate | 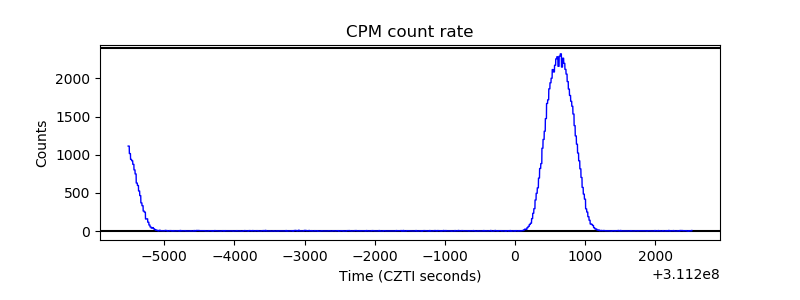 |
| CZT Counter | 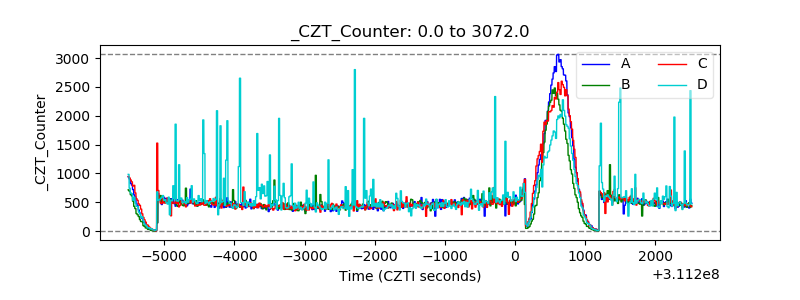 |
| +2.5 Volts monitor | 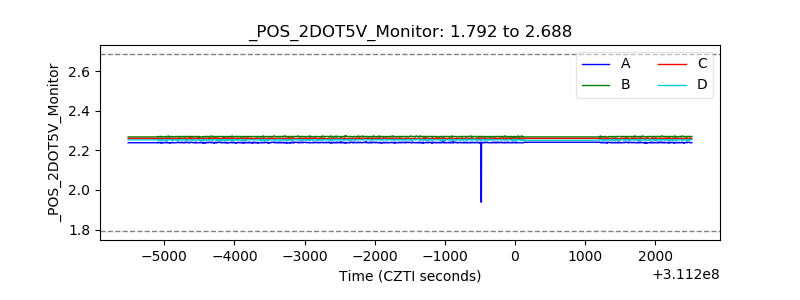 |
| +5 Volts monitor |  |
| _ROLL_ROT | 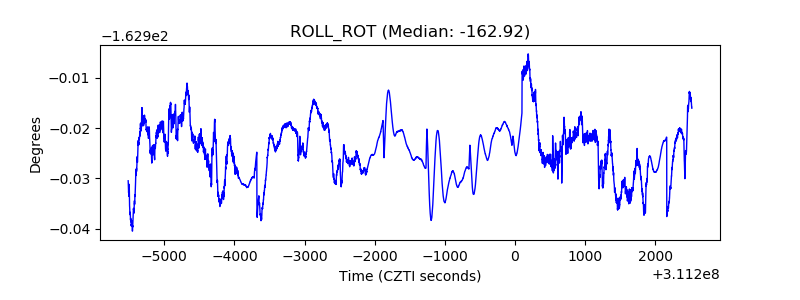 |
| _Roll_DEC | 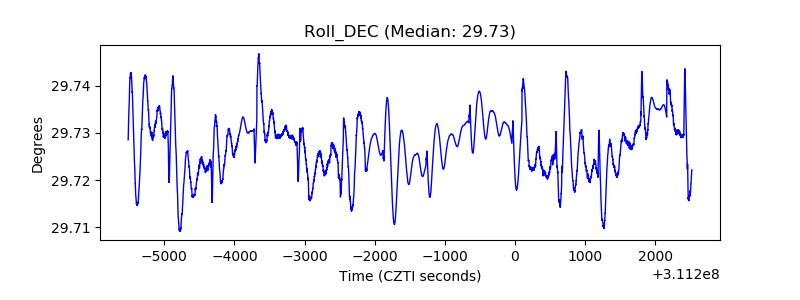 |
| _Roll_RA |  |
| Veto Counter | 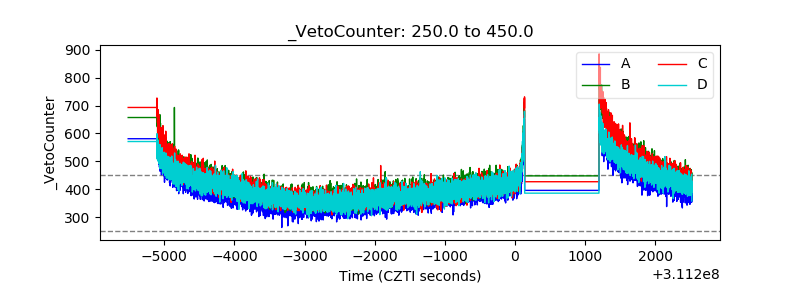 |