| Param | Original file | Final file |
|---|---|---|
| Filename | modeM0/AS1A07_018T08_9000003296_22291cztM0_level2.evt | modeM0/AS1A07_018T08_9000003296_22291cztM0_level2_quad_clean.evt |
| Size (bytes) | 496,808,640 | 64,817,280 |
| Size | 473.8 MB | 61.8 MB |
| Events in quadrant A | 3,239,893 | 399,545 |
| Events in quadrant B | 3,359,127 | 410,579 |
| Events in quadrant C | 3,240,800 | 382,699 |
| Events in quadrant D | 4,792,162 | 343,344 |
| Mode M9 | |||
|---|---|---|---|
| Quadrant | BADHDUFLAG | Total packets | Discarded packets |
| A | 0 | 14 | 0 |
| B | 0 | 14 | 0 |
| C | 0 | 14 | 0 |
| D | 0 | 14 | 0 |
| Mode M0 | |||
|---|---|---|---|
| Quadrant | BADHDUFLAG | Total packets | Discarded packets |
| A | 0 | 13048 | 1 |
| B | 0 | 13539 | 1 |
| C | 0 | 13172 | 1 |
| D | 0 | 18078 | 1 |
| Mode SS | |||
|---|---|---|---|
| Quadrant | BADHDUFLAG | Total packets | Discarded packets |
| A | 0 | 124 | 0 |
| B | 0 | 124 | 0 |
| C | 0 | 124 | 0 |
| D | 0 | 124 | 0 |
| Quadrant | Total seconds | Saturated seconds | Saturation percentage |
|---|---|---|---|
| A | 6100 | 33 | 0.540984% |
| B | 6100 | 56 | 0.918033% |
| C | 6101 | 62 | 1.016227% |
| D | 6101 | 517 | 8.474021% |
Noise dominated data is calculated using 1-second bins in cleaned event files. If a bin has >2000 counts, and if more than 50% of those come from <1% of pixels, then it is considered to be noise-dominated and hence unusable.
| Quadrant | # 1 sec bins | Bins with >0 counts | Bins with >2000 counts | High rate bins dominated by noise | Noise dominated (total time) | Noise dominated (detector-on time) | Marked lightcurve |
|---|---|---|---|---|---|---|---|
| A | 7495 | 6101 | 0 | 0 | 0.00% | 0.00% | 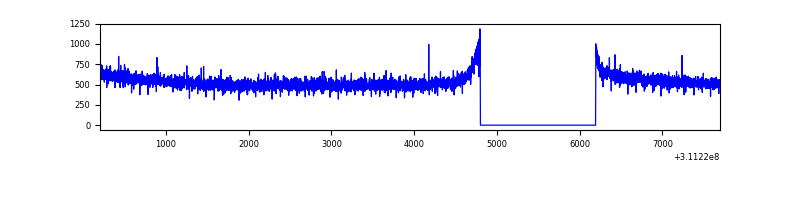 |
| B | 7495 | 6101 | 5 | 5 | 0.07% | 0.08% | 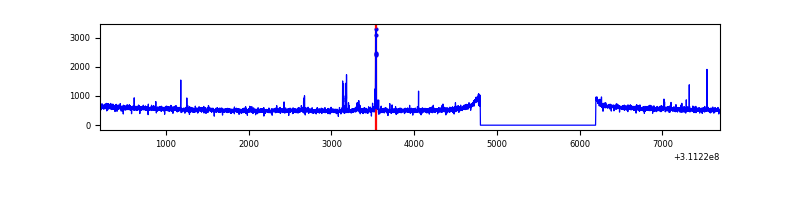 |
| C | 7496 | 6102 | 0 | 0 | 0.00% | 0.00% | 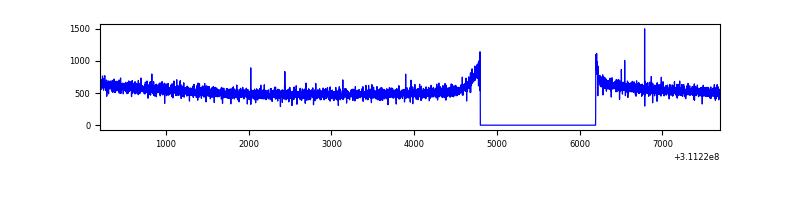 |
| D | 7496 | 6102 | 442 | 442 | 5.90% | 7.24% | 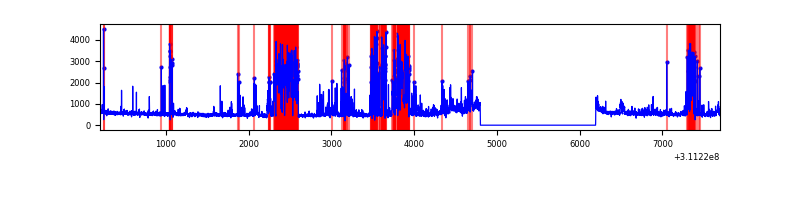 |
Top three noisy pixels from each quadrant. If the there are fewer than three noisy pixels in the level2.evt file, extra rows are filled as -1
| Pixel properties | Quadrant properties | ||||||
|---|---|---|---|---|---|---|---|
| Quadrant | DetID | PixID | Counts | Sigma | Mean | Median | Sigma |
| A | 13 | 254 | 7982 | 42.86 | 841 | 829 | 166.9 |
| A | 0 | 226 | 7327 | 38.94 | 841 | 829 | 166.9 |
| A | 3 | 137 | 6757 | 35.52 | 841 | 829 | 166.9 |
| B | 3 | 64 | 68949 | 435.83 | 843 | 827 | 156.3 |
| B | 12 | 111 | 18008 | 109.92 | 843 | 827 | 156.3 |
| B | 11 | 111 | 16500 | 100.27 | 843 | 827 | 156.3 |
| C | 14 | 238 | 131046 | 707.77 | 797 | 806 | 184.0 |
| C | 13 | 61 | 5442 | 25.19 | 797 | 806 | 184.0 |
| C | 0 | 10 | 2844 | 11.08 | 797 | 806 | 184.0 |
| D | 1 | 52 | 1821303 | 9776.93 | 778 | 758 | 186.2 |
| D | 2 | 234 | 22429 | 116.38 | 778 | 758 | 186.2 |
| D | 2 | 120 | 13628 | 69.12 | 778 | 758 | 186.2 |
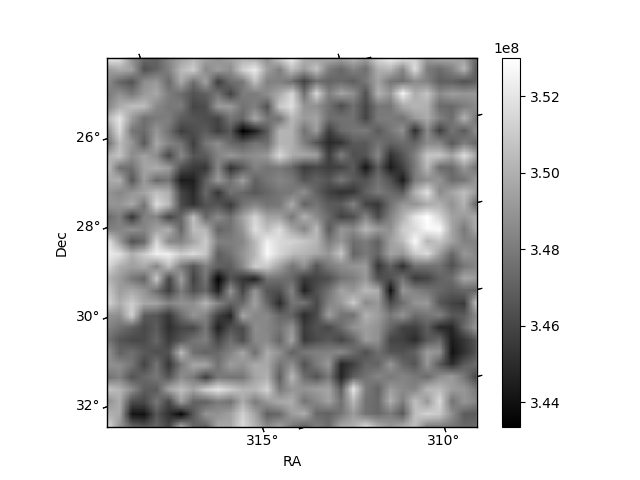
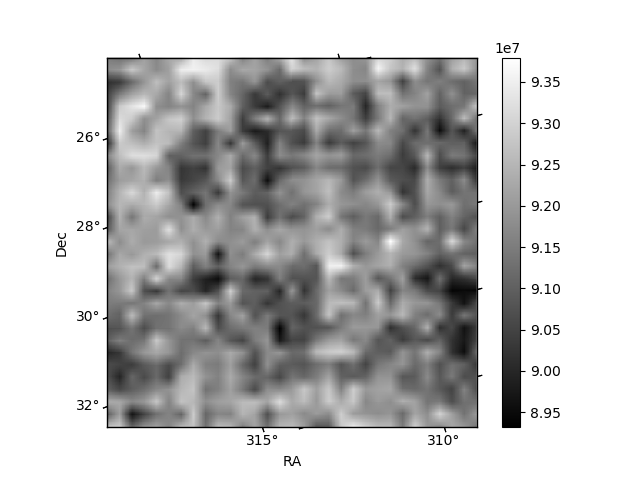
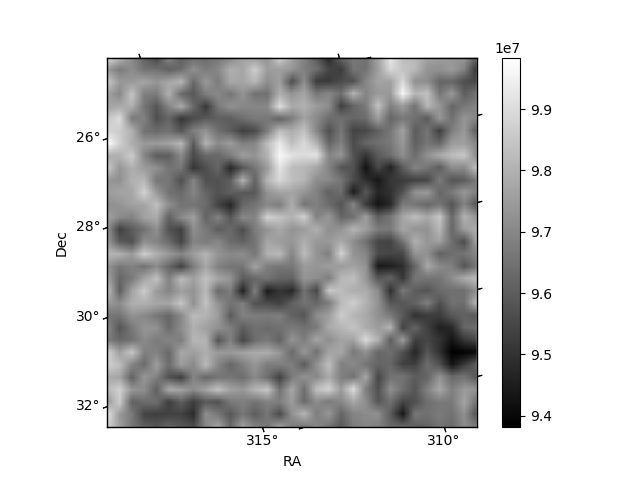
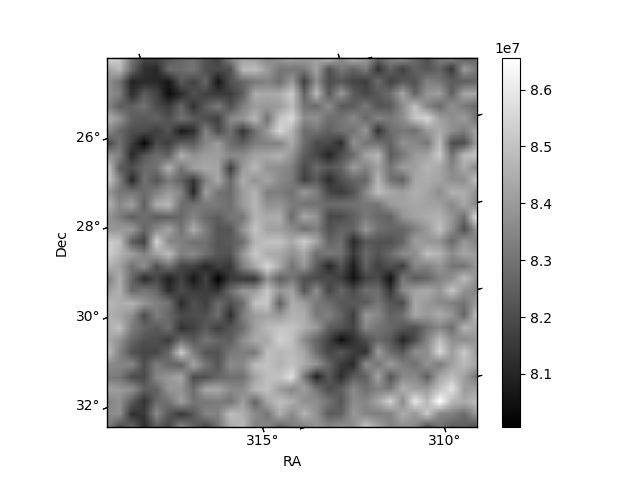
Histogram calculated using DETX and DETY for each event in the final _common_clean file
| Quadrant A | 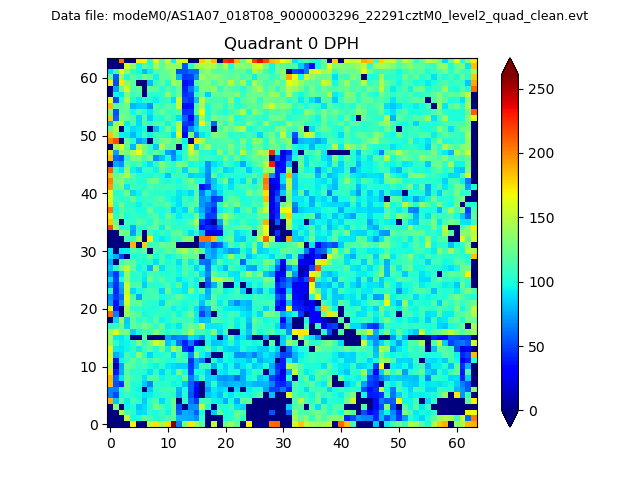 |
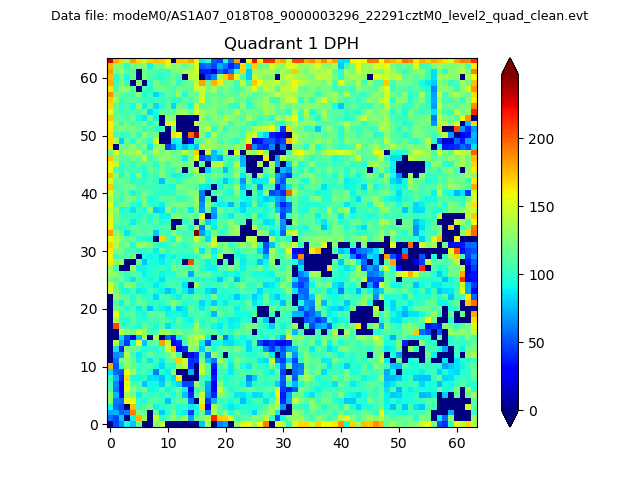 |
Quadrant B |
|---|---|---|---|
| Quadrant D | 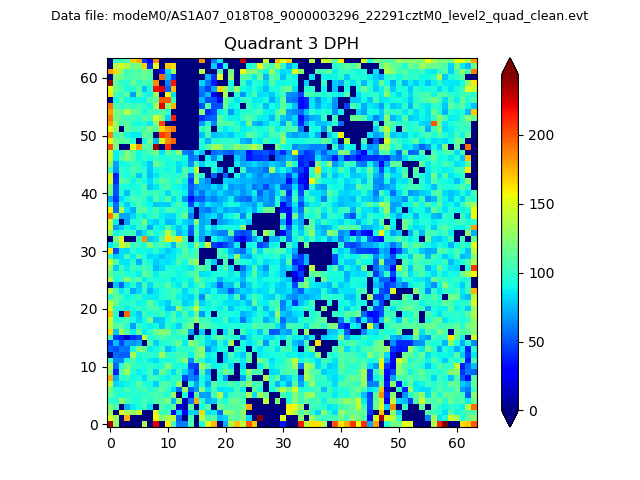 |
 |
Quadrant C |
| Plot type | Count rate plots | Images |
|---|---|---|
| Comparison with Poisson distribution Blue bars denote a histogram of data divided into 1 sec bins. Red curve is a Poisson curve with rate = median count rate of data. |
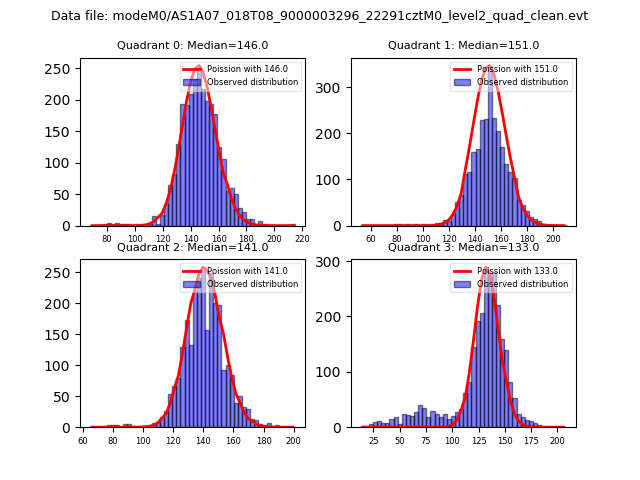 |
 |
| Quadrant-wise count rates Data is divided into 100 sec bins |
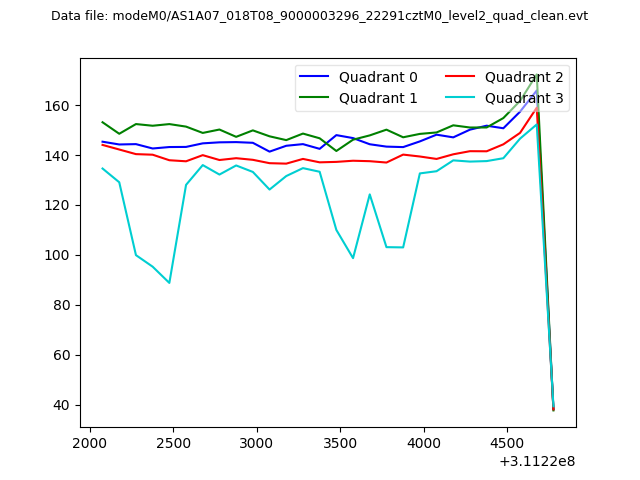 |
|
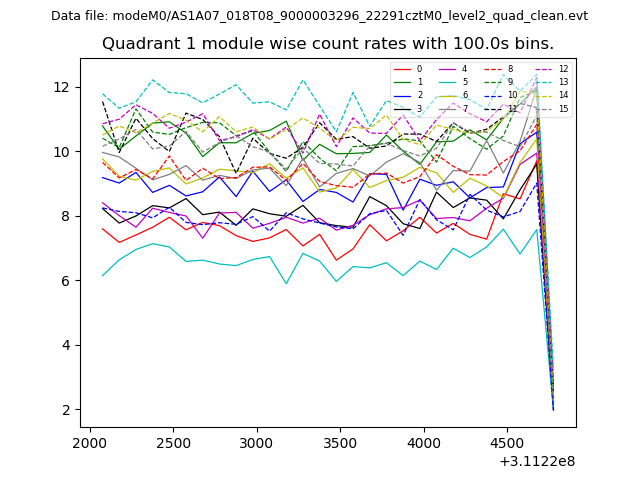
| Module-wise count rates for Quadrant A Data is divided into 100 sec bins |
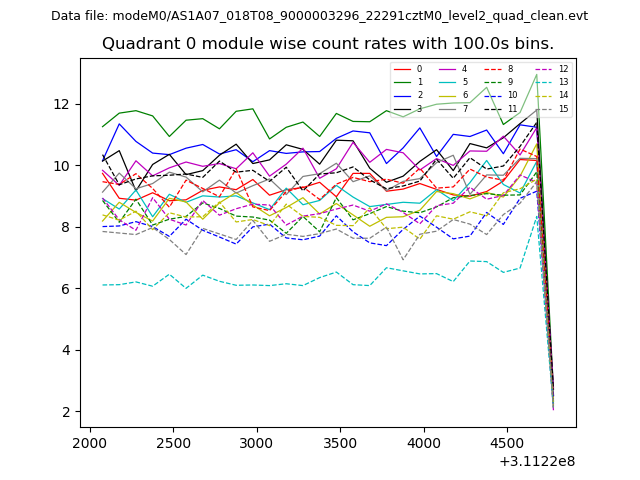 |
 |
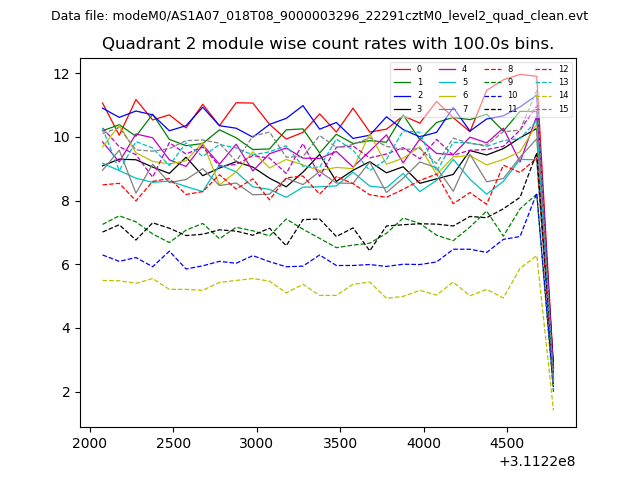
| Module-wise count rates for Quadrant B Data is divided into 100 sec bins |
 |
 |
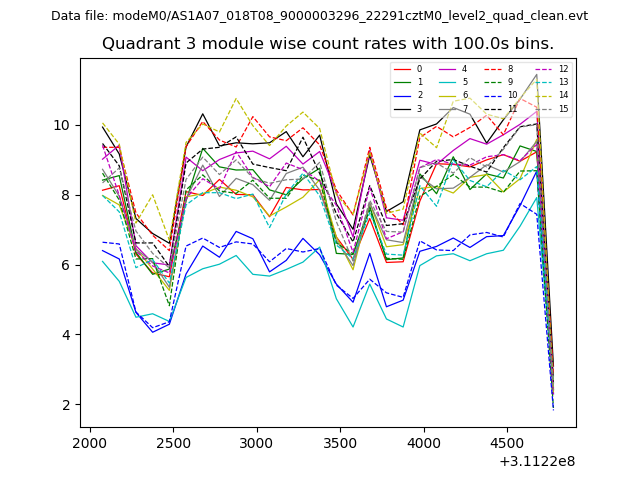
| Module-wise count rates for Quadrant C Data is divided into 100 sec bins |
 |
 |
| Module-wise count rates for Quadrant D Data is divided into 100 sec bins |
 |
 |
| Parameter | Plot |
|---|---|
| CZT HV Monitor | 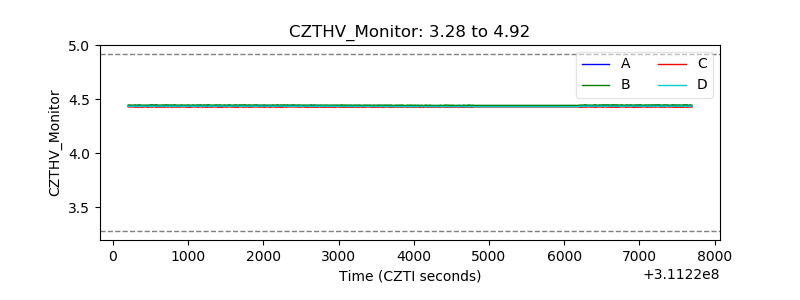 |
| D_VDD | 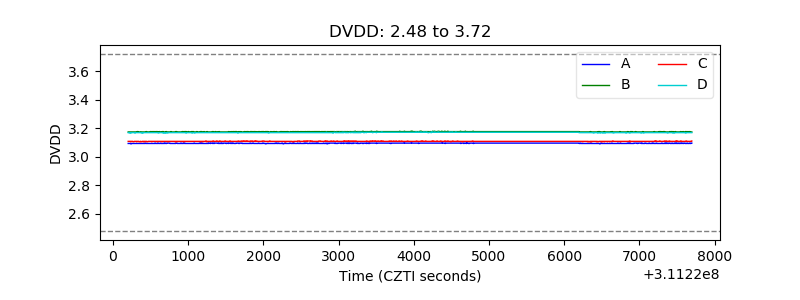 |
| Temperature 1 | 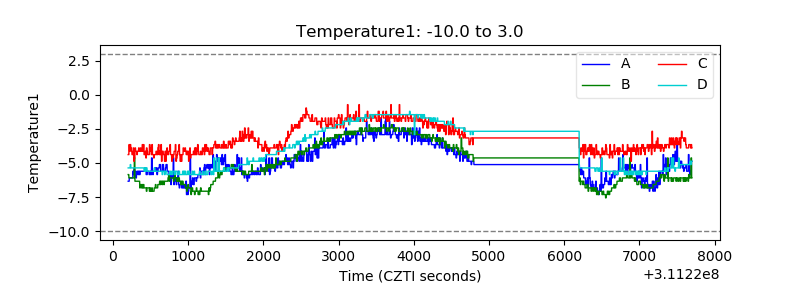 |
| Veto HV Monitor |  |
| Veto LLD | 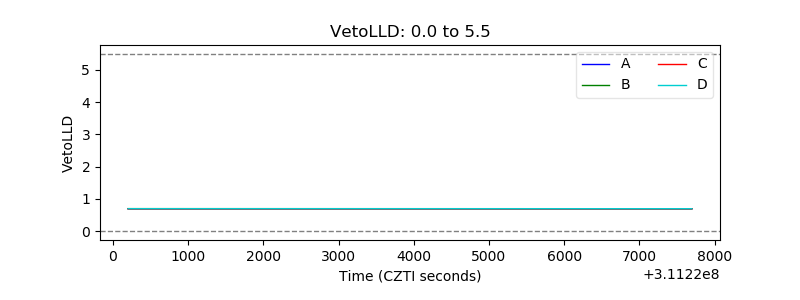 |
| Alpha Counter | 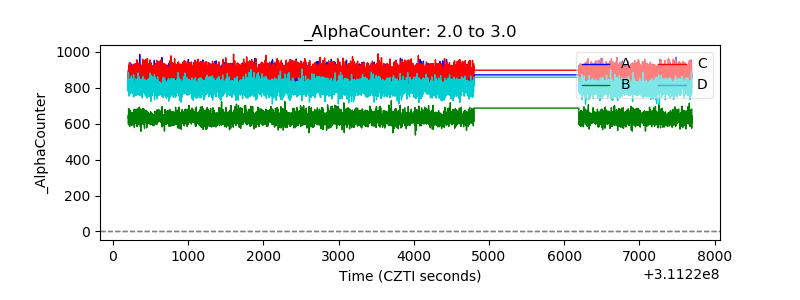 |
| _CPM_Rate | 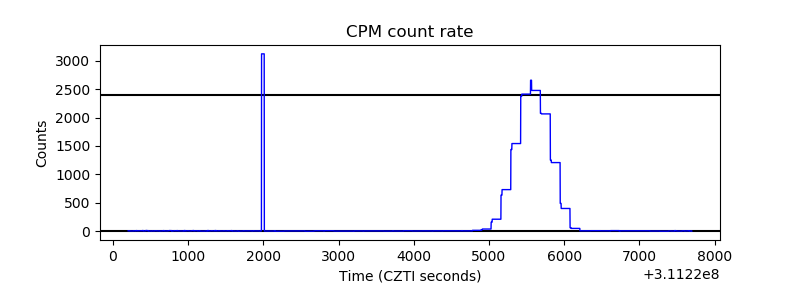 |
| CZT Counter |  |
| +2.5 Volts monitor |  |
| +5 Volts monitor |  |
| _ROLL_ROT | 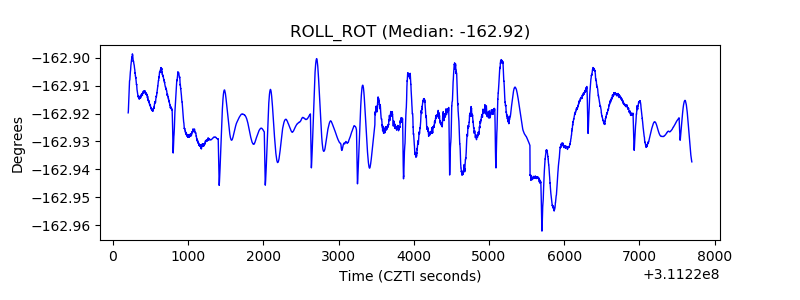 |
| _Roll_DEC | 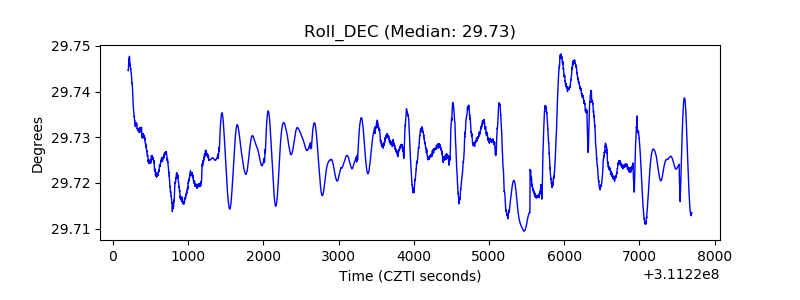 |
| _Roll_RA |  |
| Veto Counter | 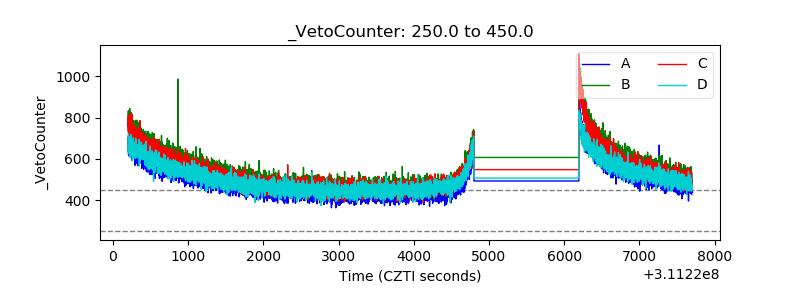 |