| Param | Original file | Final file |
|---|---|---|
| Filename | modeM0/AS1A07_018T08_9000003296_22292cztM0_level2.evt | modeM0/AS1A07_018T08_9000003296_22292cztM0_level2_quad_clean.evt |
| Size (bytes) | 474,647,040 | 74,986,560 |
| Size | 452.7 MB | 71.5 MB |
| Events in quadrant A | 3,307,714 | 470,246 |
| Events in quadrant B | 3,384,019 | 480,760 |
| Events in quadrant C | 3,290,701 | 447,315 |
| Events in quadrant D | 3,966,151 | 434,132 |
| Mode M9 | |||
|---|---|---|---|
| Quadrant | BADHDUFLAG | Total packets | Discarded packets |
| A | 0 | 13 | 0 |
| B | 0 | 13 | 0 |
| C | 0 | 13 | 0 |
| D | 0 | 13 | 0 |
| Mode M0 | |||
|---|---|---|---|
| Quadrant | BADHDUFLAG | Total packets | Discarded packets |
| A | 0 | 13400 | 2 |
| B | 0 | 13732 | 2 |
| C | 0 | 13475 | 3 |
| D | 0 | 15760 | 2 |
| Mode SS | |||
|---|---|---|---|
| Quadrant | BADHDUFLAG | Total packets | Discarded packets |
| A | 0 | 126 | 0 |
| B | 0 | 126 | 0 |
| C | 0 | 126 | 0 |
| D | 0 | 126 | 0 |
| Quadrant | Total seconds | Saturated seconds | Saturation percentage |
|---|---|---|---|
| A | 6283 | 83 | 1.321025% |
| B | 6284 | 111 | 1.766391% |
| C | 6283 | 119 | 1.894000% |
| D | 6283 | 164 | 2.610218% |
Noise dominated data is calculated using 1-second bins in cleaned event files. If a bin has >2000 counts, and if more than 50% of those come from <1% of pixels, then it is considered to be noise-dominated and hence unusable.
| Quadrant | # 1 sec bins | Bins with >0 counts | Bins with >2000 counts | High rate bins dominated by noise | Noise dominated (total time) | Noise dominated (detector-on time) | Marked lightcurve |
|---|---|---|---|---|---|---|---|
| A | 7553 | 6284 | 0 | 0 | 0.00% | 0.00% | 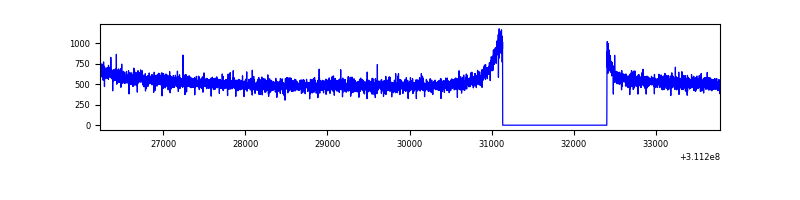 |
| B | 7554 | 6285 | 2 | 2 | 0.03% | 0.03% | 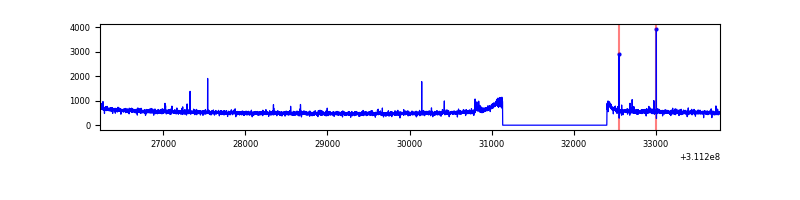 |
| C | 7553 | 6284 | 0 | 0 | 0.00% | 0.00% | 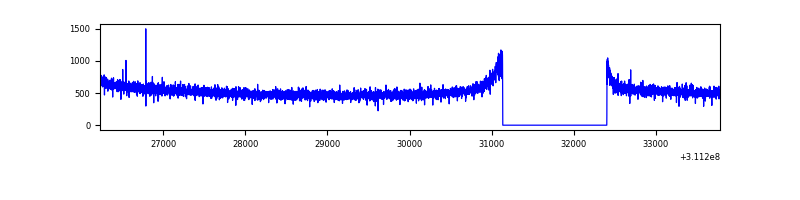 |
| D | 7553 | 6283 | 101 | 101 | 1.34% | 1.61% | 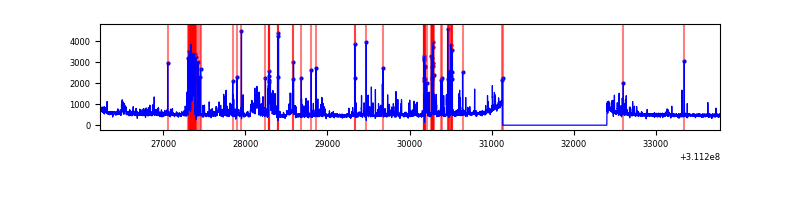 |
Top three noisy pixels from each quadrant. If the there are fewer than three noisy pixels in the level2.evt file, extra rows are filled as -1
| Pixel properties | Quadrant properties | ||||||
|---|---|---|---|---|---|---|---|
| Quadrant | DetID | PixID | Counts | Sigma | Mean | Median | Sigma |
| A | 13 | 254 | 7876 | 41.19 | 859 | 844 | 170.7 |
| A | 0 | 226 | 7455 | 38.73 | 859 | 844 | 170.7 |
| A | 3 | 137 | 6919 | 35.59 | 859 | 844 | 170.7 |
| B | 3 | 64 | 23450 | 140.15 | 857 | 839 | 161.3 |
| B | 12 | 111 | 19177 | 113.67 | 857 | 839 | 161.3 |
| B | 11 | 111 | 17119 | 100.91 | 857 | 839 | 161.3 |
| C | 14 | 238 | 130469 | 695.95 | 810 | 820 | 186.3 |
| C | 13 | 61 | 5653 | 25.94 | 810 | 820 | 186.3 |
| C | 10 | 91 | 2301 | 7.95 | 810 | 820 | 186.3 |
| D | 1 | 52 | 845310 | 4306.38 | 813 | 791 | 196.1 |
| D | 13 | 172 | 30237 | 150.15 | 813 | 791 | 196.1 |
| D | 2 | 234 | 23929 | 117.99 | 813 | 791 | 196.1 |
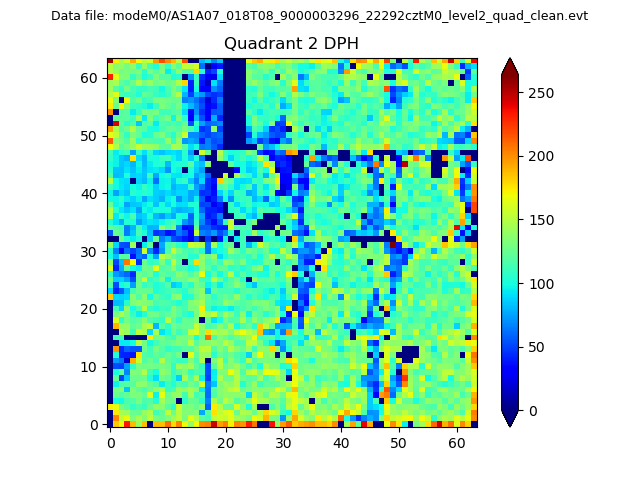
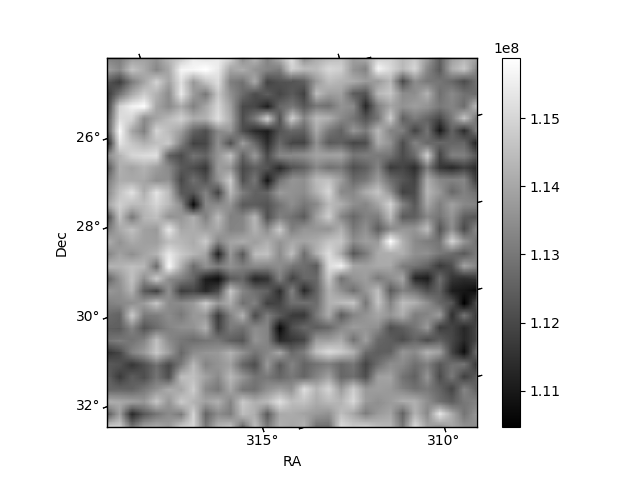
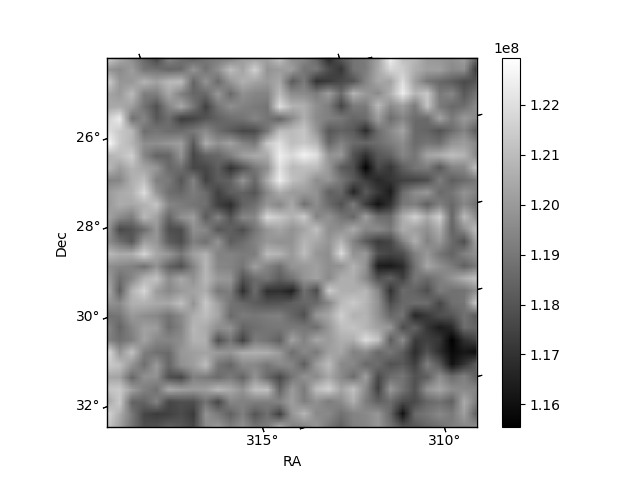
Histogram calculated using DETX and DETY for each event in the final _common_clean file
| Quadrant A | 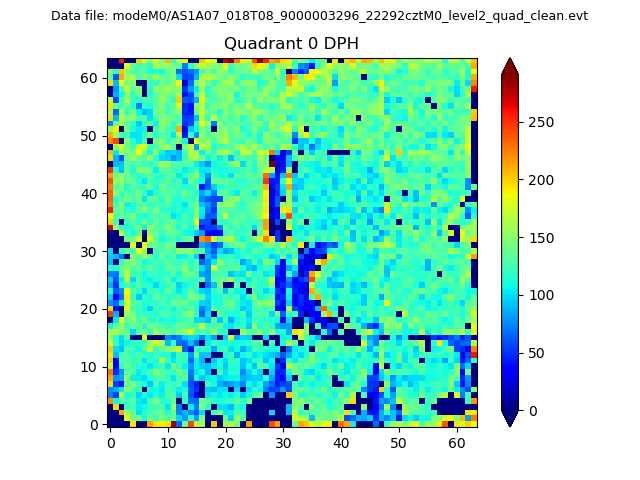 |
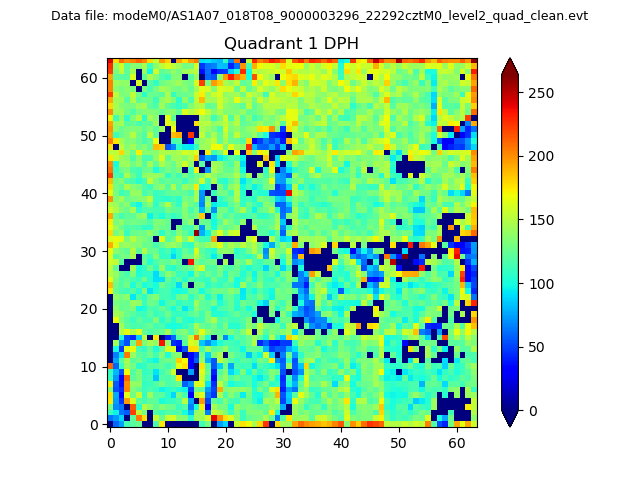 |
Quadrant B |
|---|---|---|---|
| Quadrant D | 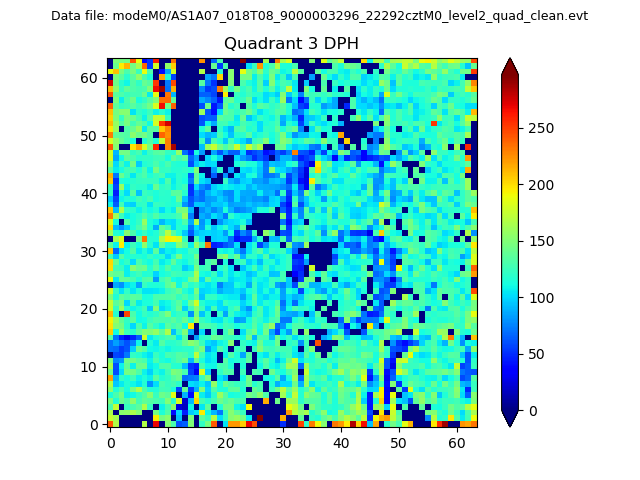 |
 |
Quadrant C |
| Plot type | Count rate plots | Images |
|---|---|---|
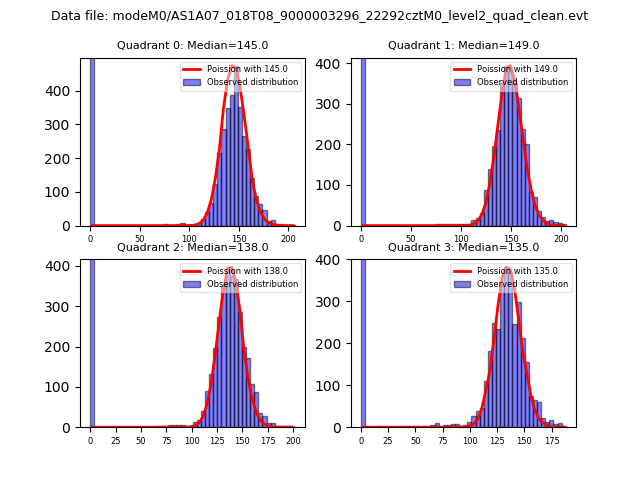
| Comparison with Poisson distribution Blue bars denote a histogram of data divided into 1 sec bins. Red curve is a Poisson curve with rate = median count rate of data. |
 |
 |
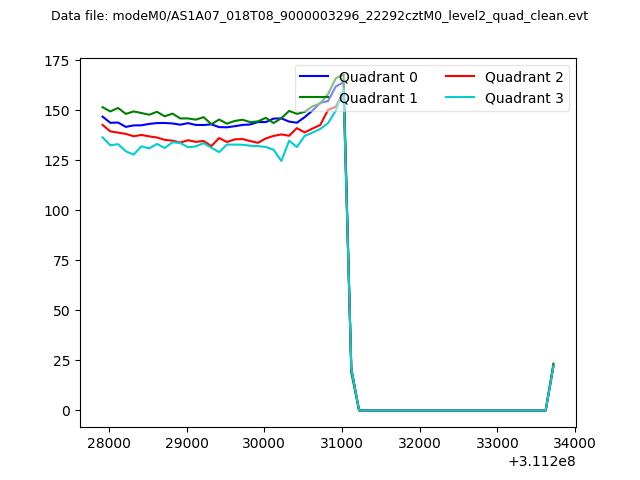
| Quadrant-wise count rates Data is divided into 100 sec bins |
 |
|
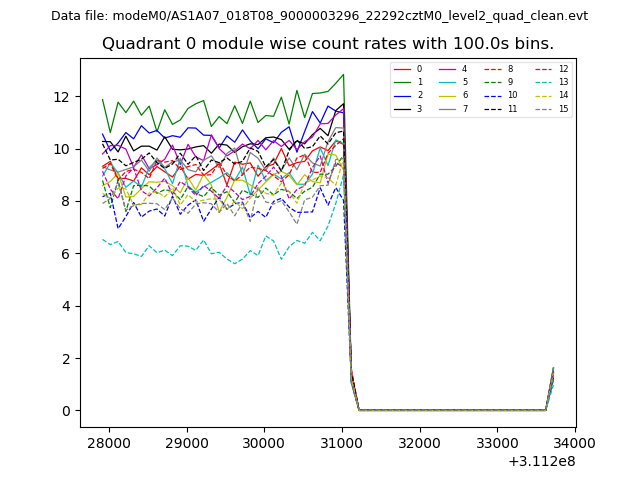
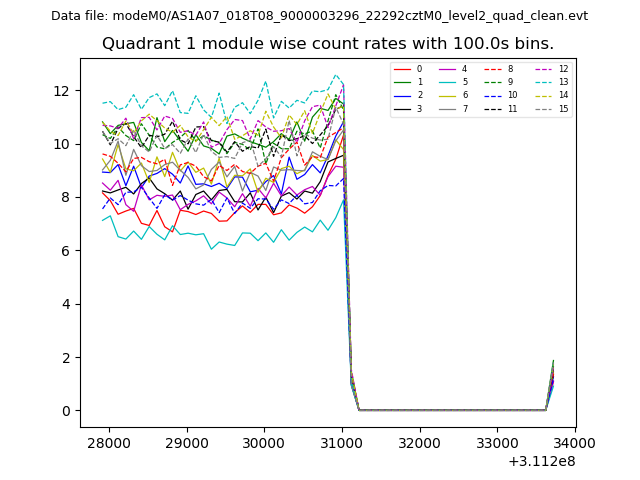
| Module-wise count rates for Quadrant A Data is divided into 100 sec bins |
 |
 |
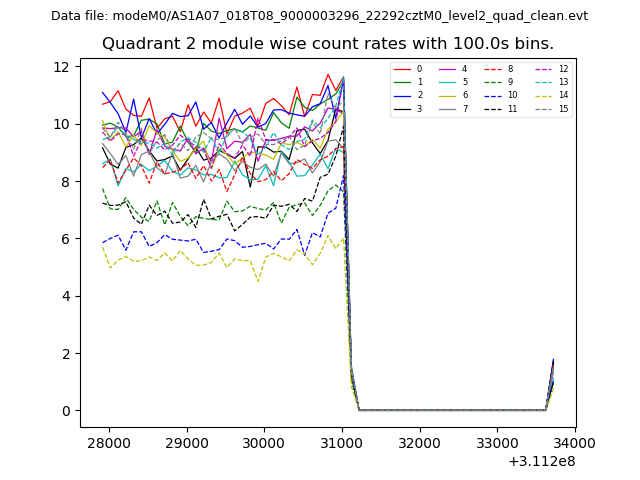
| Module-wise count rates for Quadrant B Data is divided into 100 sec bins |
 |
 |
| Module-wise count rates for Quadrant C Data is divided into 100 sec bins |
 |
 |
| Module-wise count rates for Quadrant D Data is divided into 100 sec bins |
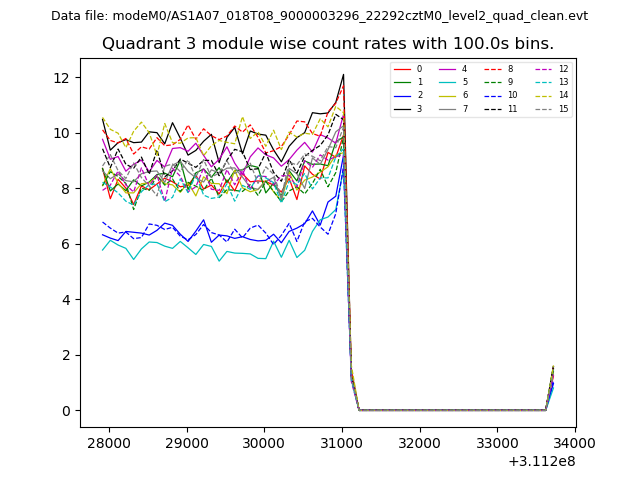 |
 |
| Parameter | Plot |
|---|---|
| CZT HV Monitor | 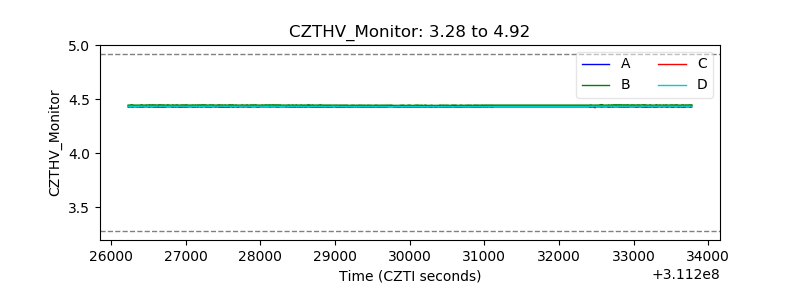 |
| D_VDD | 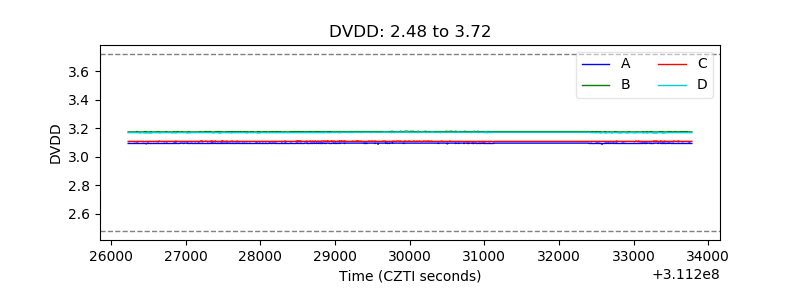 |
| Temperature 1 |  |
| Veto HV Monitor | 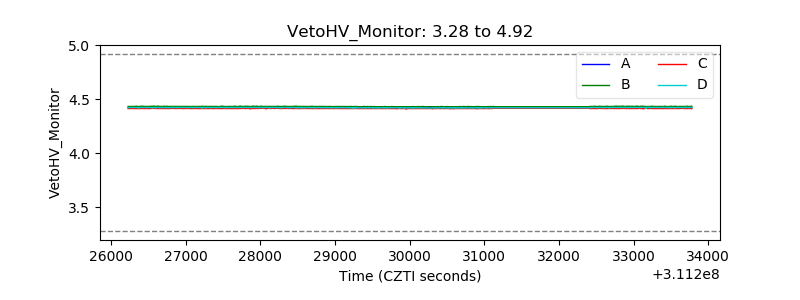 |
| Veto LLD | 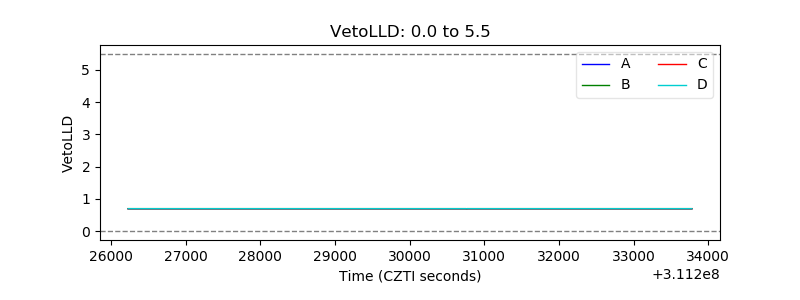 |
| Alpha Counter | 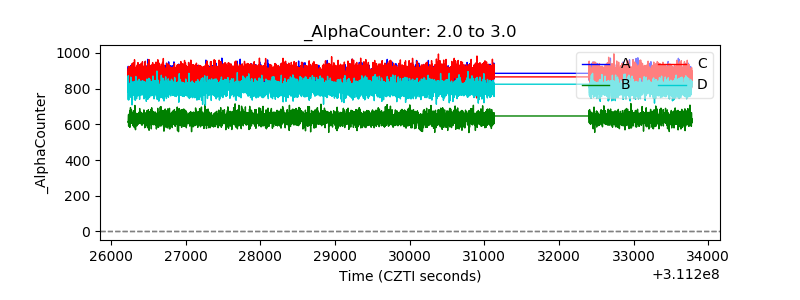 |
| _CPM_Rate | 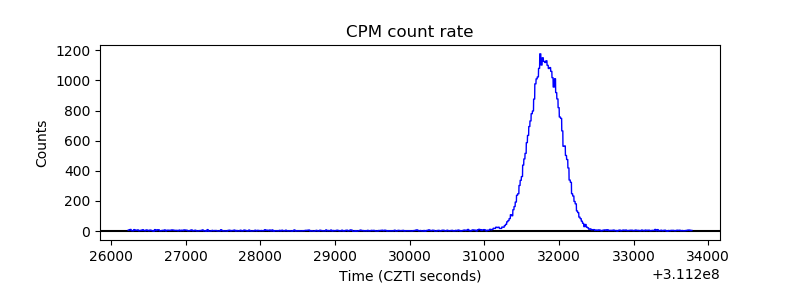 |
| CZT Counter | 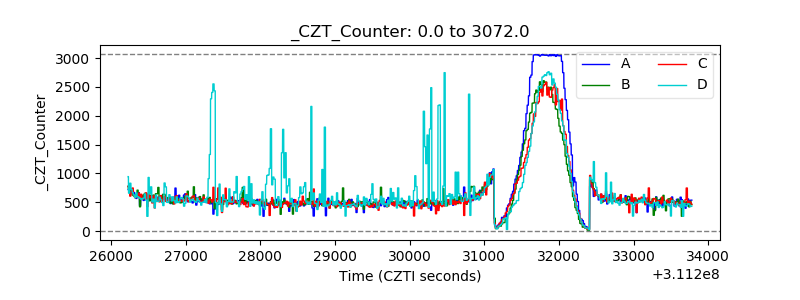 |
| +2.5 Volts monitor |  |
| +5 Volts monitor |  |
| _ROLL_ROT | 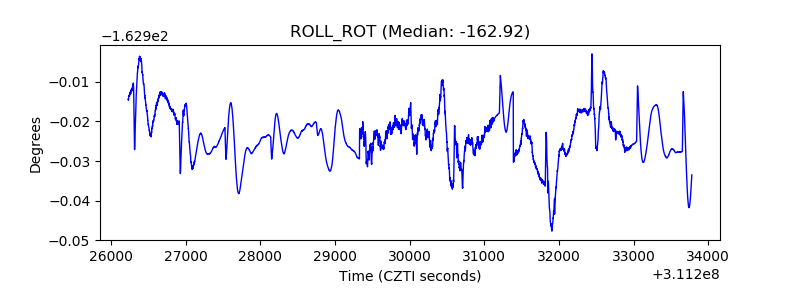 |
| _Roll_DEC | 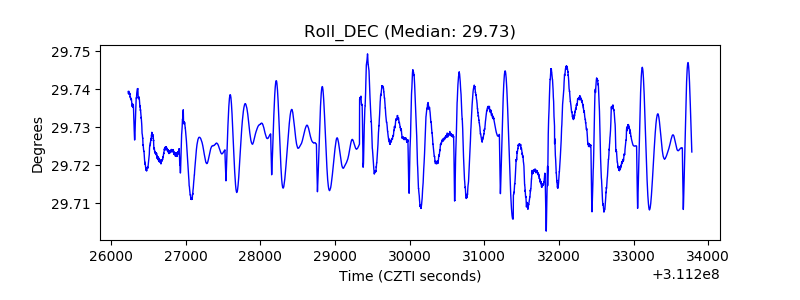 |
| _Roll_RA | 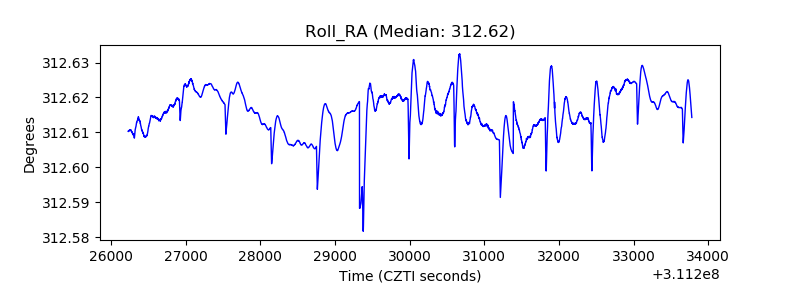 |
| Veto Counter | 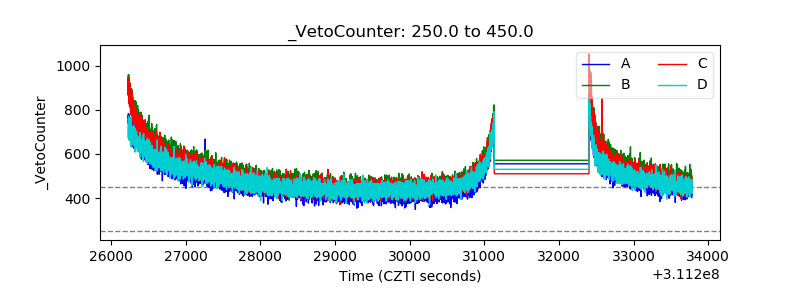 |