| Param | Original file | Final file |
|---|---|---|
| Filename | modeM0/AS1A07_018T08_9000003296_22293cztM0_level2.evt | modeM0/AS1A07_018T08_9000003296_22293cztM0_level2_quad_clean.evt |
| Size (bytes) | 478,088,640 | 89,118,720 |
| Size | 455.9 MB | 85.0 MB |
| Events in quadrant A | 3,397,845 | 571,024 |
| Events in quadrant B | 3,482,614 | 583,468 |
| Events in quadrant C | 3,350,624 | 546,848 |
| Events in quadrant D | 3,794,210 | 532,006 |
| Mode M9 | |||
|---|---|---|---|
| Quadrant | BADHDUFLAG | Total packets | Discarded packets |
| A | 0 | 16 | 0 |
| B | 0 | 17 | 0 |
| C | 0 | 17 | 0 |
| D | 0 | 17 | 0 |
| Mode M0 | |||
|---|---|---|---|
| Quadrant | BADHDUFLAG | Total packets | Discarded packets |
| A | 0 | 14013 | 2 |
| B | 0 | 14266 | 2 |
| C | 0 | 13960 | 2 |
| D | 0 | 15575 | 2 |
| Mode SS | |||
|---|---|---|---|
| Quadrant | BADHDUFLAG | Total packets | Discarded packets |
| A | 0 | 134 | 0 |
| B | 0 | 134 | 0 |
| C | 0 | 134 | 0 |
| D | 0 | 134 | 0 |
| Quadrant | Total seconds | Saturated seconds | Saturation percentage |
|---|---|---|---|
| A | 6683 | 110 | 1.645967% |
| B | 6683 | 149 | 2.229538% |
| C | 6683 | 141 | 2.109831% |
| D | 6683 | 147 | 2.199611% |
Noise dominated data is calculated using 1-second bins in cleaned event files. If a bin has >2000 counts, and if more than 50% of those come from <1% of pixels, then it is considered to be noise-dominated and hence unusable.
| Quadrant | # 1 sec bins | Bins with >0 counts | Bins with >2000 counts | High rate bins dominated by noise | Noise dominated (total time) | Noise dominated (detector-on time) | Marked lightcurve |
|---|---|---|---|---|---|---|---|
| A | 7673 | 6684 | 3 | 3 | 0.04% | 0.04% | 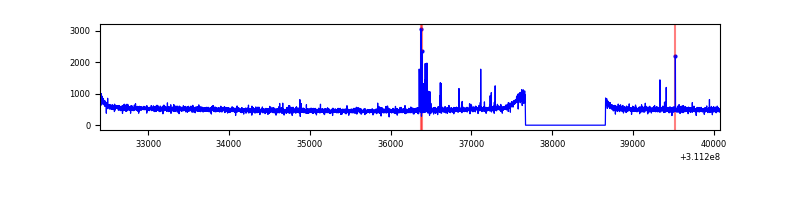 |
| B | 7673 | 6684 | 6 | 6 | 0.08% | 0.09% | 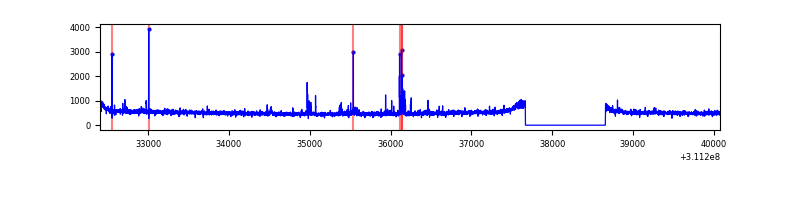 |
| C | 7673 | 6684 | 0 | 0 | 0.00% | 0.00% |  |
| D | 7673 | 6684 | 57 | 57 | 0.74% | 0.85% | 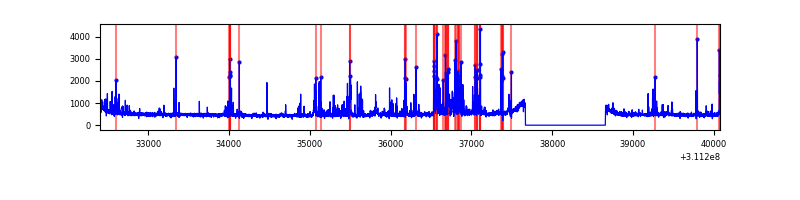 |
Top three noisy pixels from each quadrant. If the there are fewer than three noisy pixels in the level2.evt file, extra rows are filled as -1
| Pixel properties | Quadrant properties | ||||||
|---|---|---|---|---|---|---|---|
| Quadrant | DetID | PixID | Counts | Sigma | Mean | Median | Sigma |
| A | 10 | 253 | 36142 | 201.97 | 873 | 856 | 174.7 |
| A | 13 | 254 | 8511 | 43.82 | 873 | 856 | 174.7 |
| A | 0 | 226 | 7700 | 39.17 | 873 | 856 | 174.7 |
| B | 3 | 64 | 74692 | 449.71 | 866 | 846 | 164.2 |
| B | 12 | 111 | 19916 | 116.13 | 866 | 846 | 164.2 |
| B | 11 | 111 | 17879 | 103.73 | 866 | 846 | 164.2 |
| C | 14 | 238 | 130305 | 673.37 | 825 | 832 | 192.3 |
| C | 13 | 61 | 5704 | 25.34 | 825 | 832 | 192.3 |
| C | 0 | 10 | 3103 | 11.81 | 825 | 832 | 192.3 |
| D | 1 | 52 | 505101 | 2469.5 | 837 | 813 | 204.2 |
| D | 12 | 227 | 76048 | 368.43 | 837 | 813 | 204.2 |
| D | 13 | 172 | 51020 | 245.86 | 837 | 813 | 204.2 |
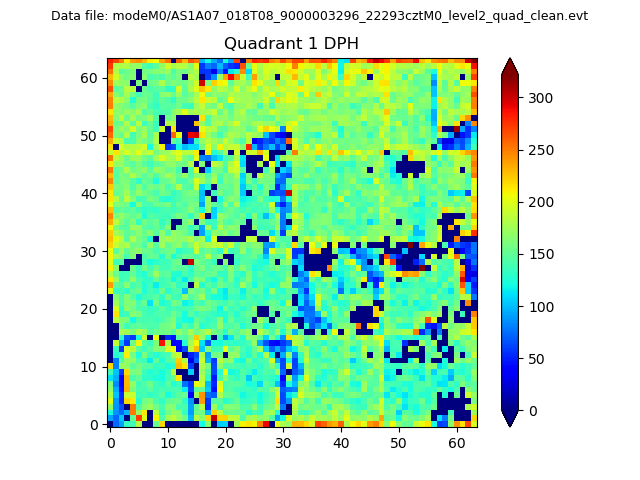
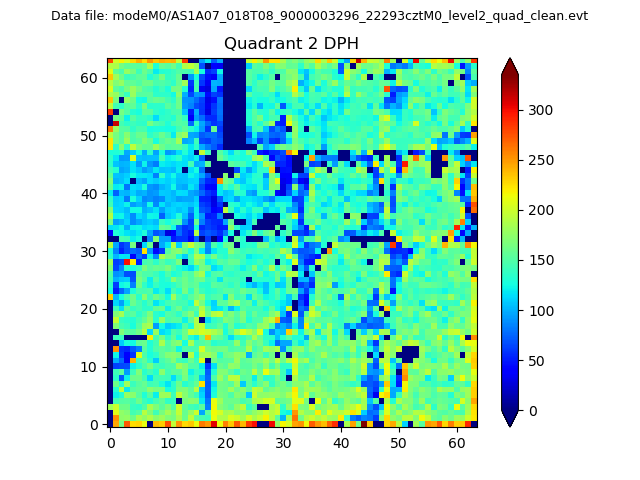
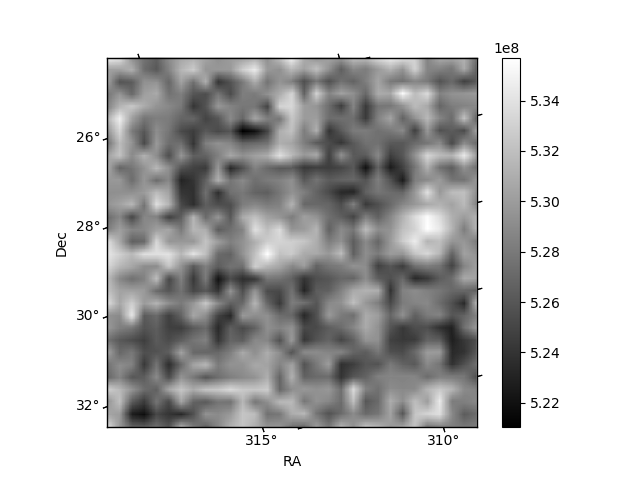
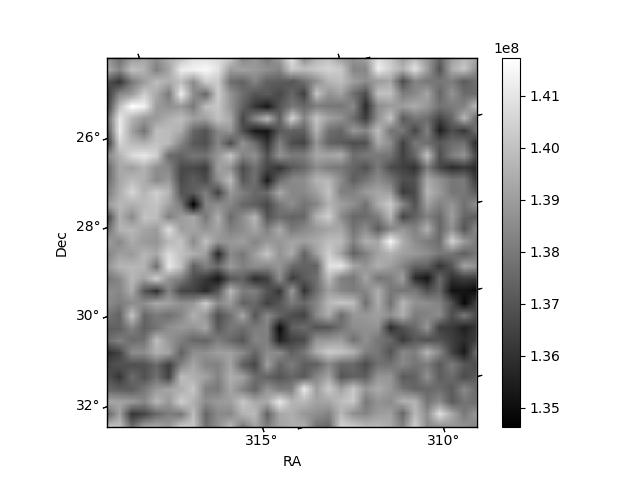
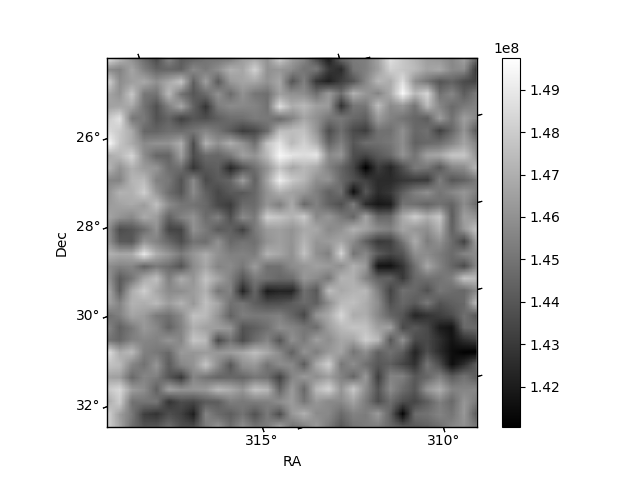
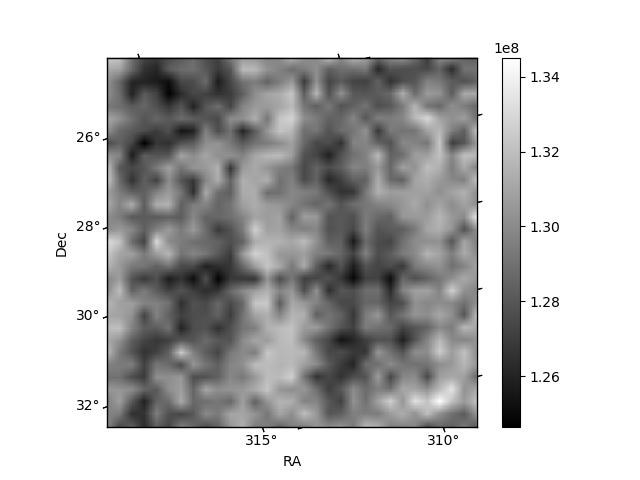
Histogram calculated using DETX and DETY for each event in the final _common_clean file
| Quadrant A | 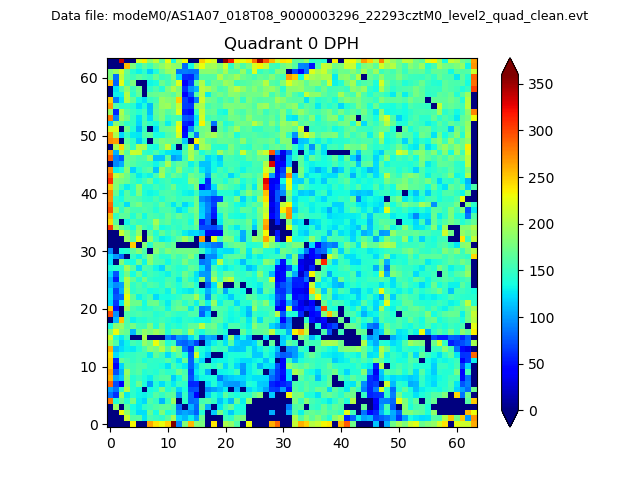 |
 |
Quadrant B |
|---|---|---|---|
| Quadrant D | 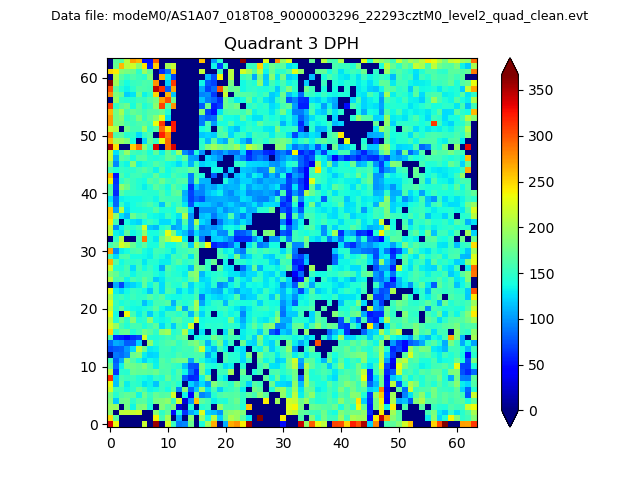 |
 |
Quadrant C |
| Plot type | Count rate plots | Images |
|---|---|---|
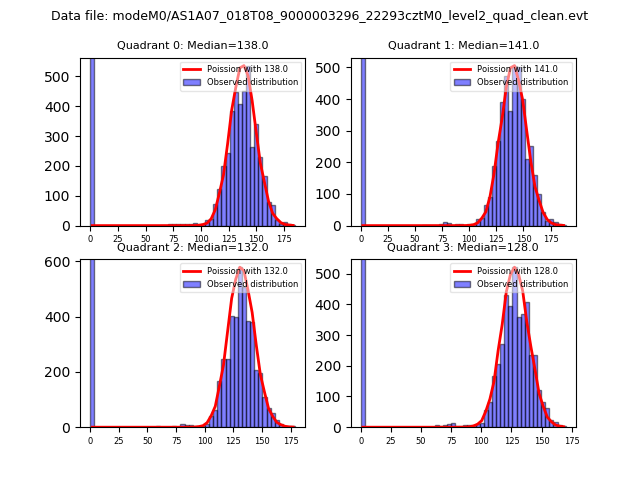
| Comparison with Poisson distribution Blue bars denote a histogram of data divided into 1 sec bins. Red curve is a Poisson curve with rate = median count rate of data. |
 |
 |
| Quadrant-wise count rates Data is divided into 100 sec bins |
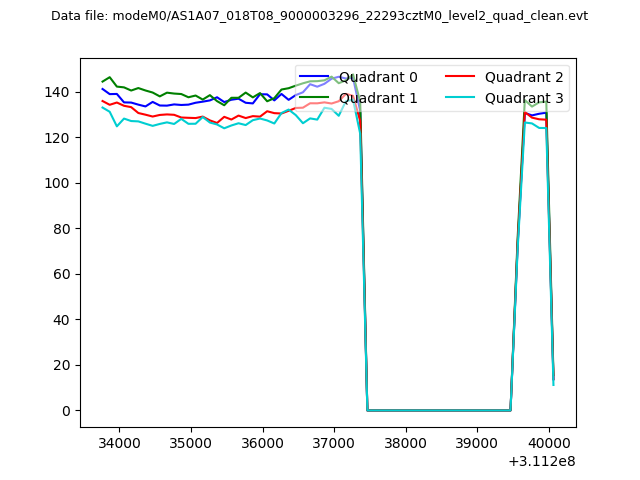 |
|
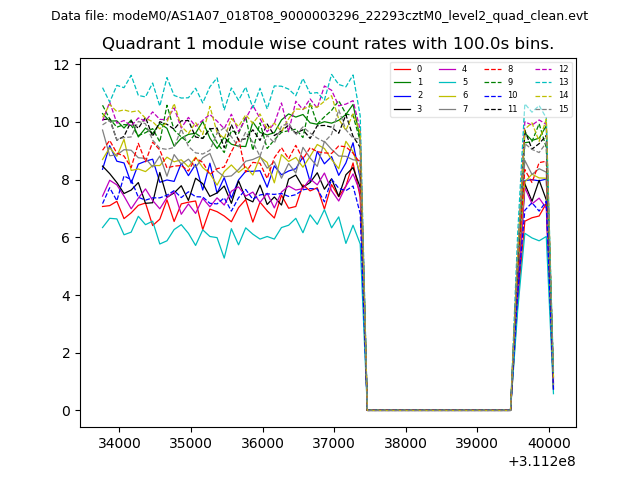
| Module-wise count rates for Quadrant A Data is divided into 100 sec bins |
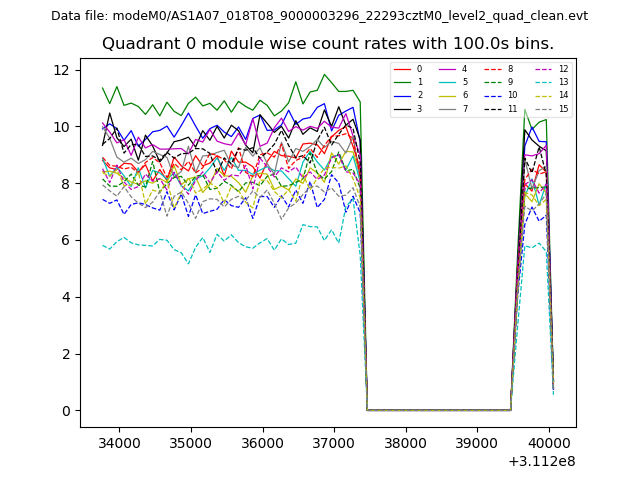 |
 |
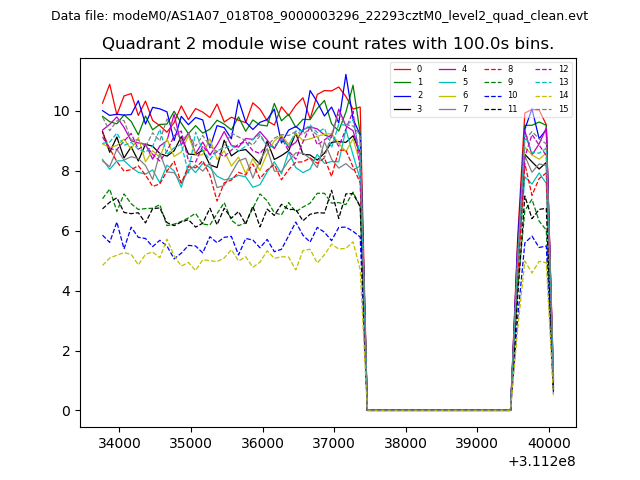
| Module-wise count rates for Quadrant B Data is divided into 100 sec bins |
 |
 |
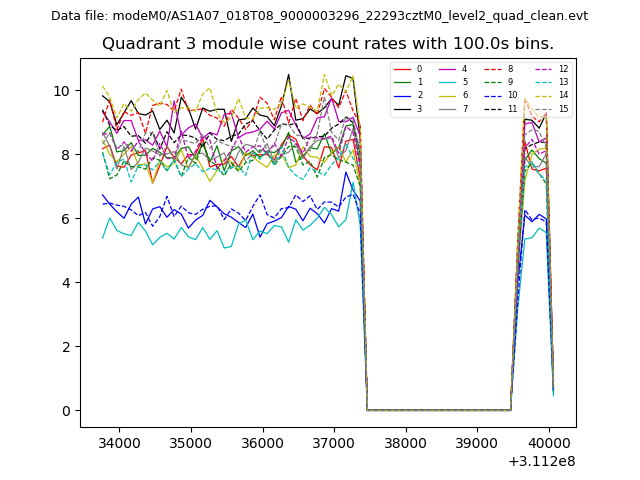
| Module-wise count rates for Quadrant C Data is divided into 100 sec bins |
 |
 |
| Module-wise count rates for Quadrant D Data is divided into 100 sec bins |
 |
 |
| Parameter | Plot |
|---|---|
| CZT HV Monitor | 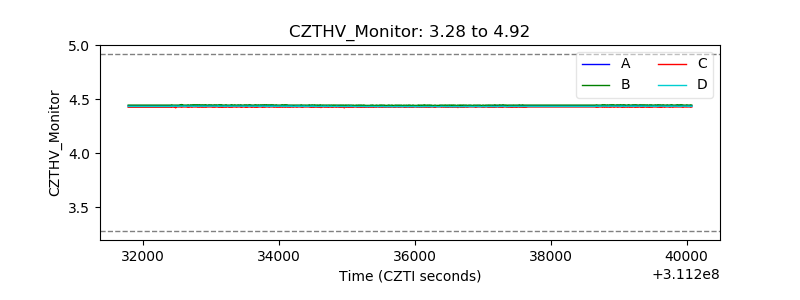 |
| D_VDD | 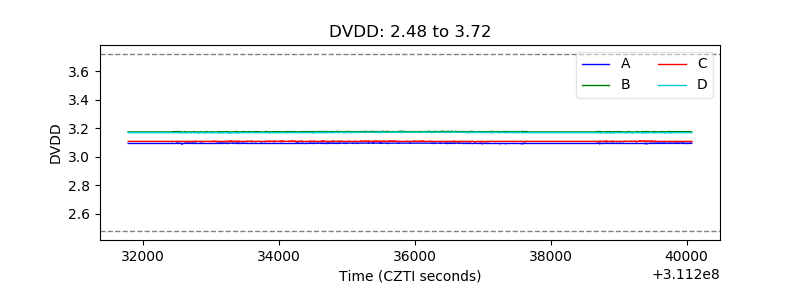 |
| Temperature 1 | 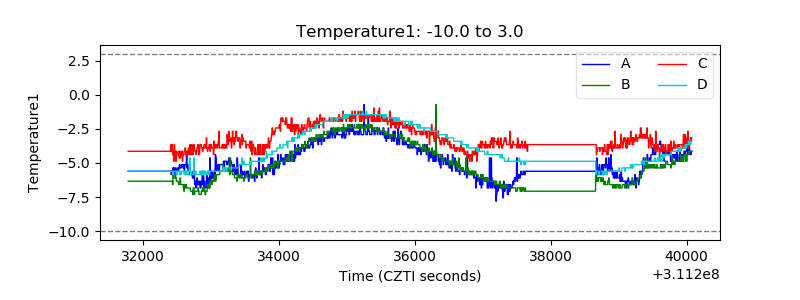 |
| Veto HV Monitor | 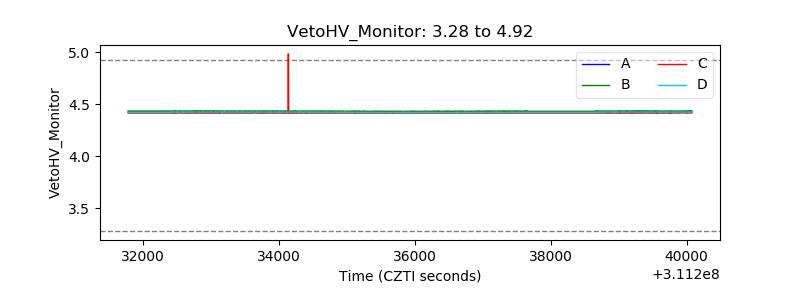 |
| Veto LLD | 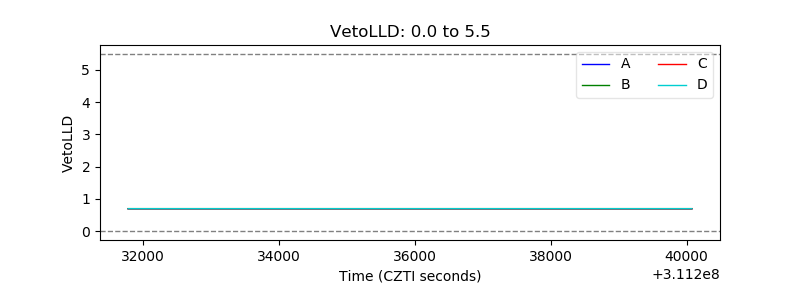 |
| Alpha Counter | 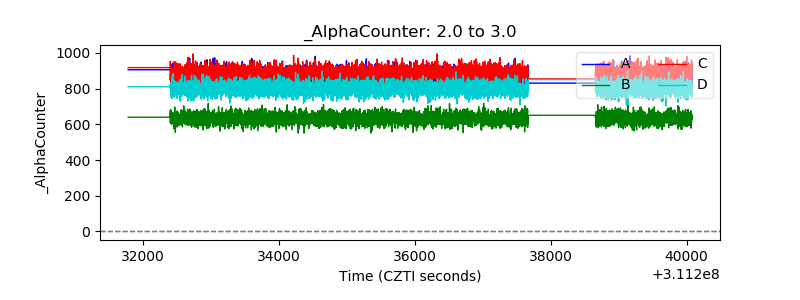 |
| _CPM_Rate | 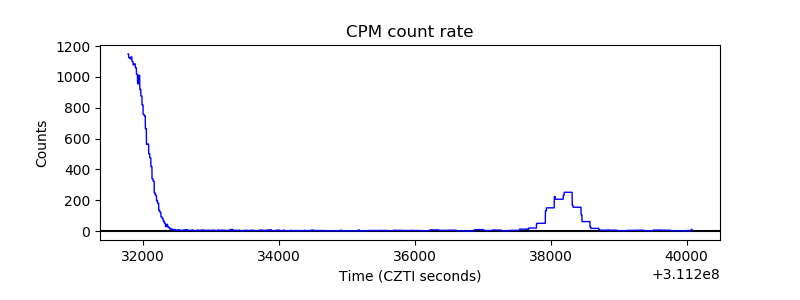 |
| CZT Counter | 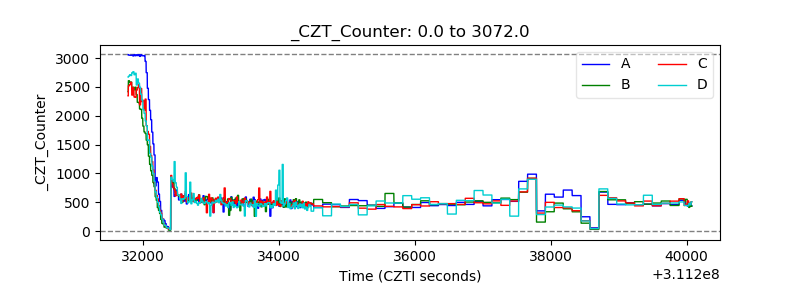 |
| +2.5 Volts monitor |  |
| +5 Volts monitor |  |
| _ROLL_ROT | 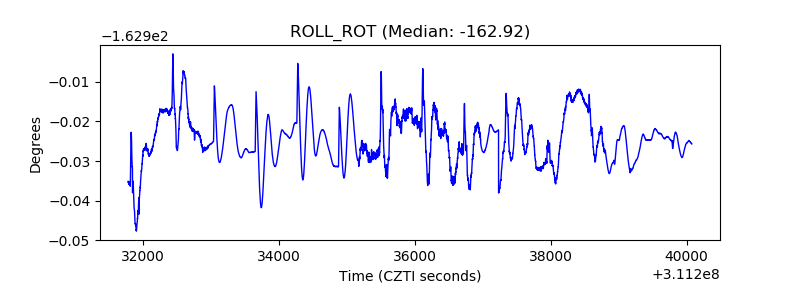 |
| _Roll_DEC | 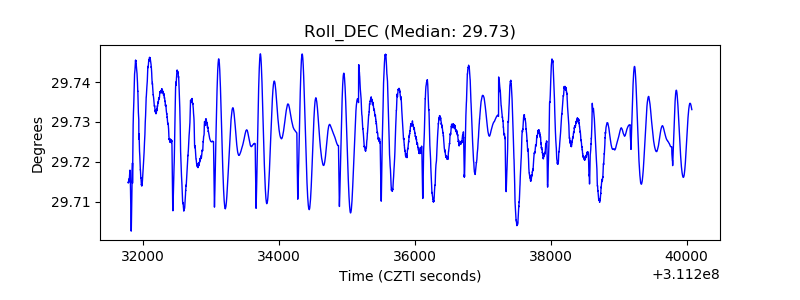 |
| _Roll_RA | 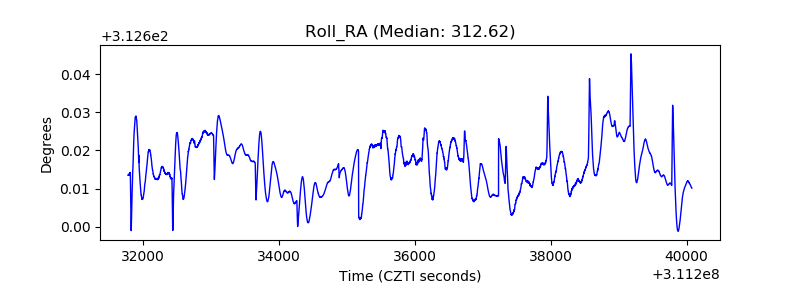 |
| Veto Counter | 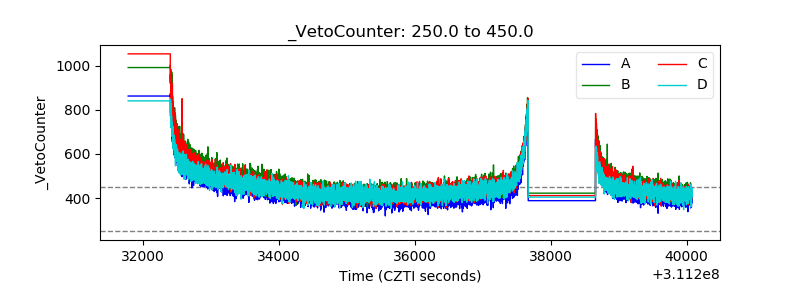 |