| Param | Original file | Final file |
|---|---|---|
| Filename | modeM0/AS1A07_018T08_9000003296_22294cztM0_level2.evt | modeM0/AS1A07_018T08_9000003296_22294cztM0_level2_quad_clean.evt |
| Size (bytes) | 478,635,840 | 92,692,800 |
| Size | 456.5 MB | 88.4 MB |
| Events in quadrant A | 3,401,766 | 590,716 |
| Events in quadrant B | 3,518,044 | 600,911 |
| Events in quadrant C | 3,398,791 | 567,337 |
| Events in quadrant D | 3,695,622 | 554,846 |
| Mode M9 | |||
|---|---|---|---|
| Quadrant | BADHDUFLAG | Total packets | Discarded packets |
| A | 0 | 9 | 0 |
| B | 0 | 10 | 0 |
| C | 0 | 10 | 0 |
| D | 0 | 10 | 0 |
| Mode M0 | |||
|---|---|---|---|
| Quadrant | BADHDUFLAG | Total packets | Discarded packets |
| A | 0 | 14550 | 2 |
| B | 0 | 14782 | 2 |
| C | 0 | 14549 | 2 |
| D | 0 | 15579 | 2 |
| Mode SS | |||
|---|---|---|---|
| Quadrant | BADHDUFLAG | Total packets | Discarded packets |
| A | 0 | 144 | 0 |
| B | 0 | 144 | 0 |
| C | 0 | 144 | 0 |
| D | 0 | 144 | 0 |
| Quadrant | Total seconds | Saturated seconds | Saturation percentage |
|---|---|---|---|
| A | 7082 | 73 | 1.030782% |
| B | 7082 | 116 | 1.637955% |
| C | 7082 | 109 | 1.539113% |
| D | 7082 | 82 | 1.157865% |
Noise dominated data is calculated using 1-second bins in cleaned event files. If a bin has >2000 counts, and if more than 50% of those come from <1% of pixels, then it is considered to be noise-dominated and hence unusable.
| Quadrant | # 1 sec bins | Bins with >0 counts | Bins with >2000 counts | High rate bins dominated by noise | Noise dominated (total time) | Noise dominated (detector-on time) | Marked lightcurve |
|---|---|---|---|---|---|---|---|
| A | 7652 | 7083 | 1 | 1 | 0.01% | 0.01% | 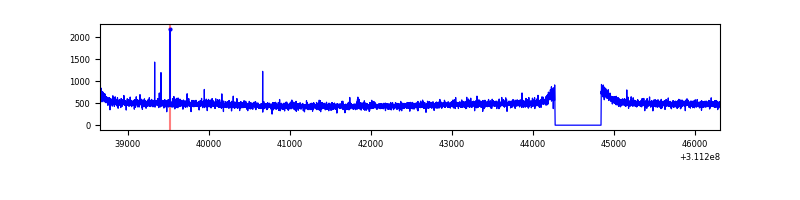 |
| B | 7652 | 7083 | 2 | 2 | 0.03% | 0.03% | 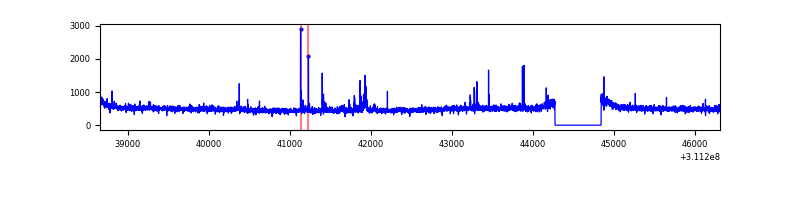 |
| C | 7652 | 7083 | 0 | 0 | 0.00% | 0.00% | 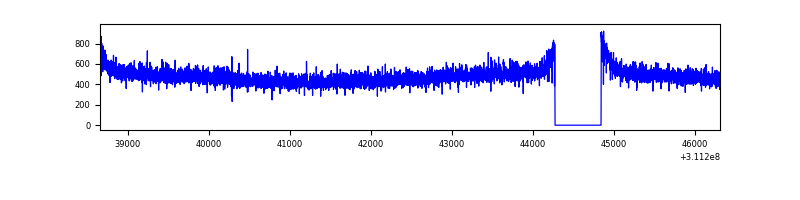 |
| D | 7652 | 7083 | 40 | 40 | 0.52% | 0.56% | 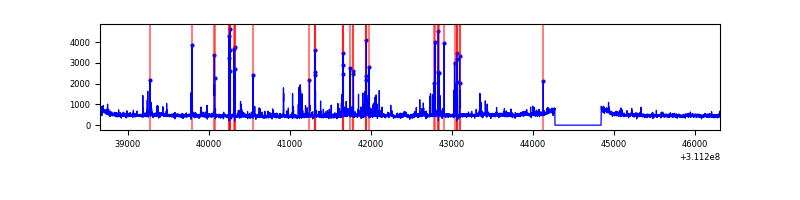 |
Top three noisy pixels from each quadrant. If the there are fewer than three noisy pixels in the level2.evt file, extra rows are filled as -1
| Pixel properties | Quadrant properties | ||||||
|---|---|---|---|---|---|---|---|
| Quadrant | DetID | PixID | Counts | Sigma | Mean | Median | Sigma |
| A | 13 | 254 | 9154 | 46.62 | 881 | 863 | 177.9 |
| A | 3 | 137 | 7511 | 37.38 | 881 | 863 | 177.9 |
| A | 0 | 226 | 7474 | 37.17 | 881 | 863 | 177.9 |
| B | 3 | 64 | 64144 | 374.56 | 875 | 851 | 169.0 |
| B | 12 | 111 | 20661 | 117.23 | 875 | 851 | 169.0 |
| B | 11 | 111 | 18589 | 104.97 | 875 | 851 | 169.0 |
| C | 14 | 238 | 133012 | 678.97 | 837 | 843 | 194.7 |
| C | 13 | 61 | 5859 | 25.77 | 837 | 843 | 194.7 |
| C | 0 | 10 | 2330 | 7.64 | 837 | 843 | 194.7 |
| D | 1 | 52 | 386006 | 1872.63 | 847 | 822 | 205.7 |
| D | 13 | 172 | 62106 | 297.94 | 847 | 822 | 205.7 |
| D | 2 | 234 | 27102 | 127.76 | 847 | 822 | 205.7 |
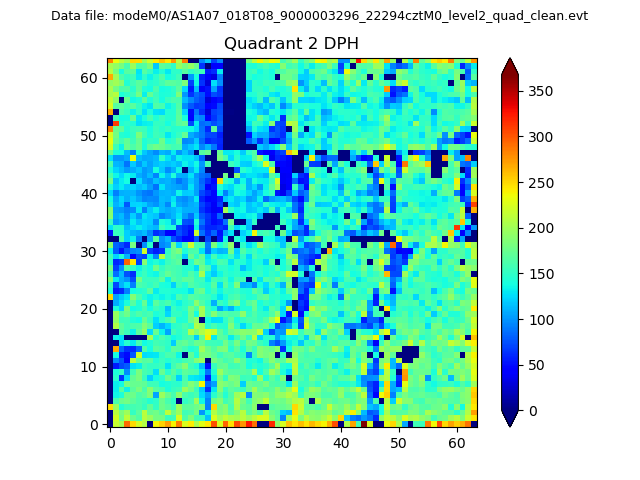
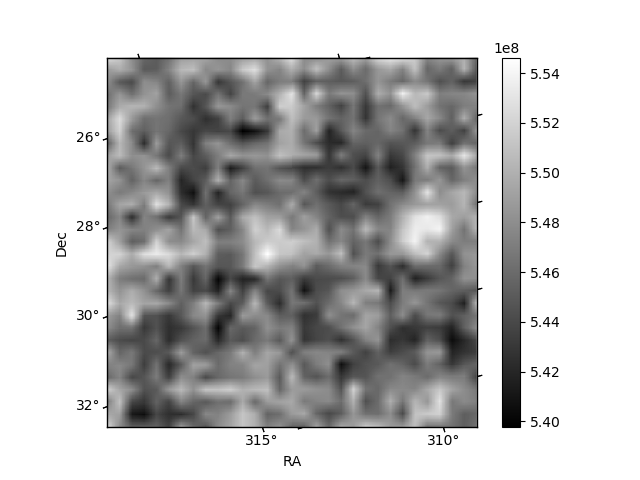
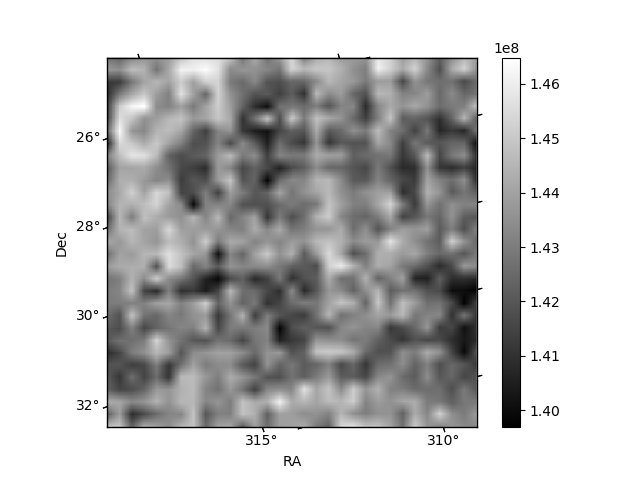
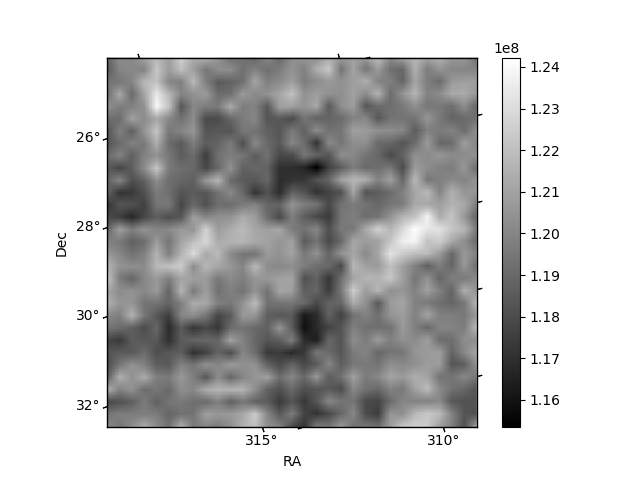
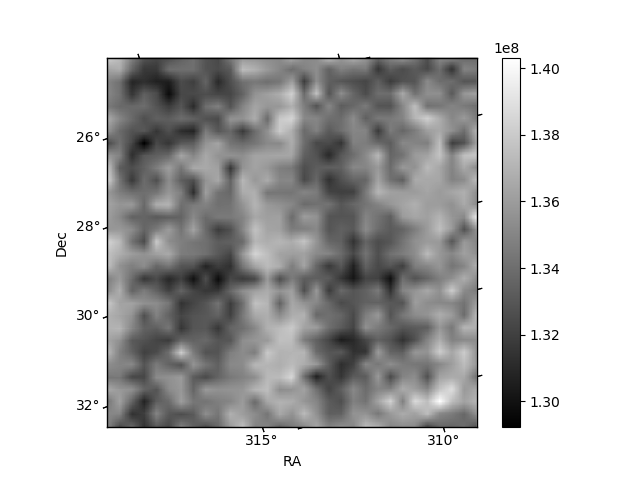
Histogram calculated using DETX and DETY for each event in the final _common_clean file
| Quadrant A | 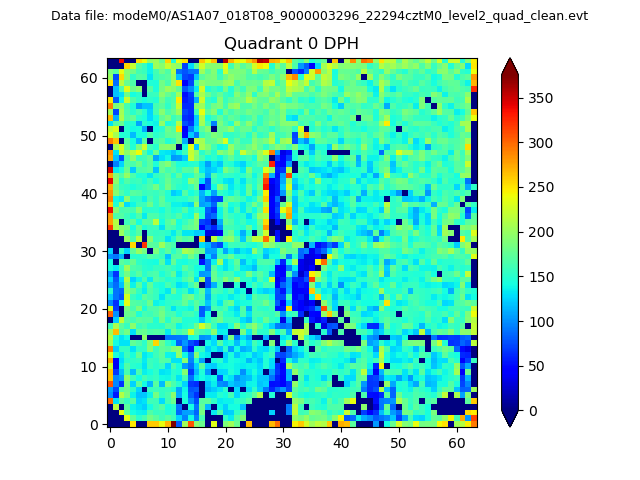 |
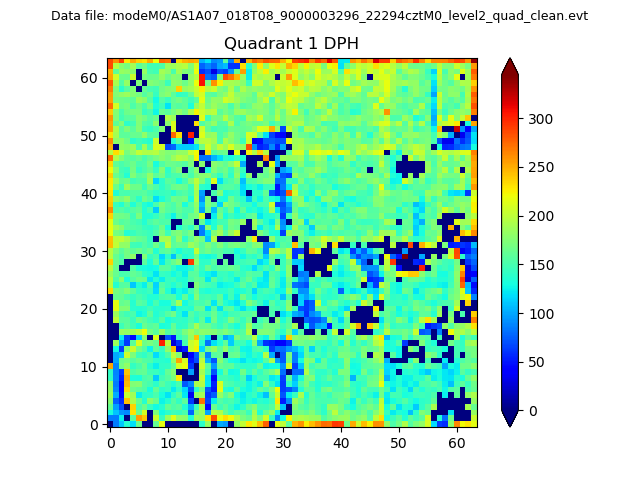 |
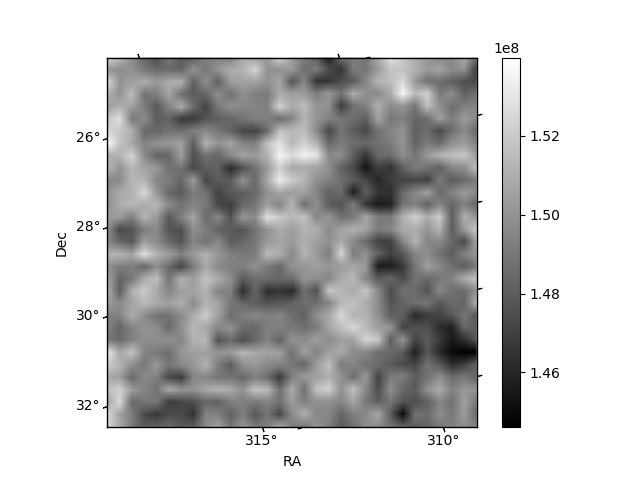
Quadrant B |
|---|---|---|---|
| Quadrant D | 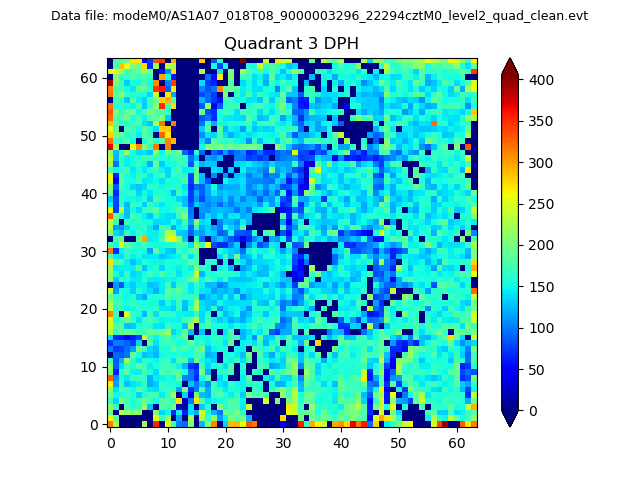 |
 |
Quadrant C |
| Plot type | Count rate plots | Images |
|---|---|---|
| Comparison with Poisson distribution Blue bars denote a histogram of data divided into 1 sec bins. Red curve is a Poisson curve with rate = median count rate of data. |
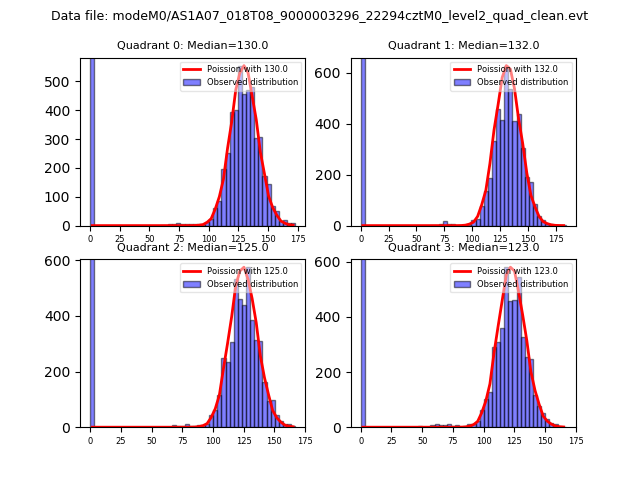 |
 |
| Quadrant-wise count rates Data is divided into 100 sec bins |
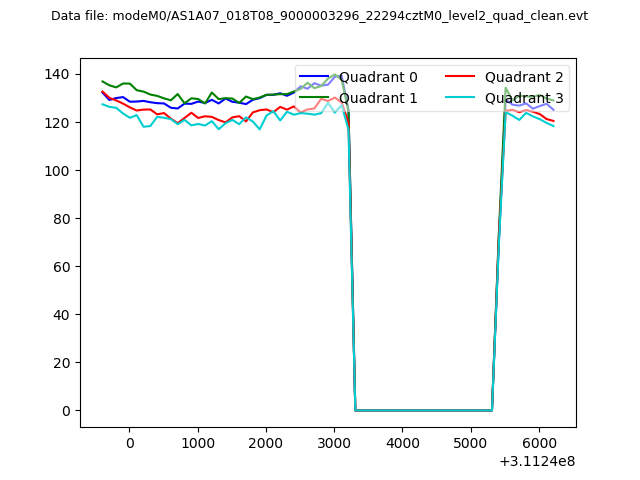 |
|
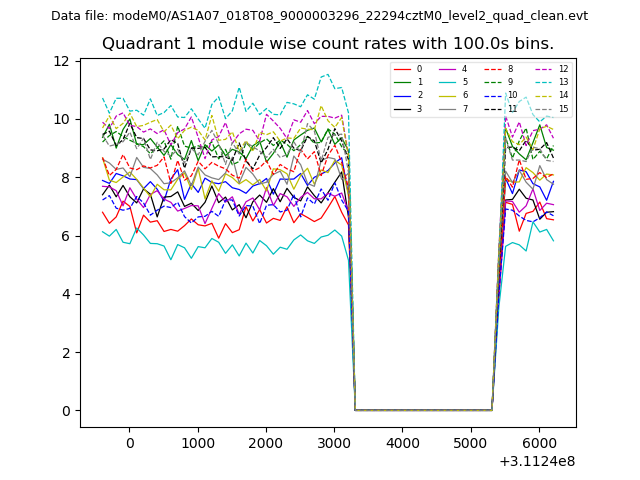
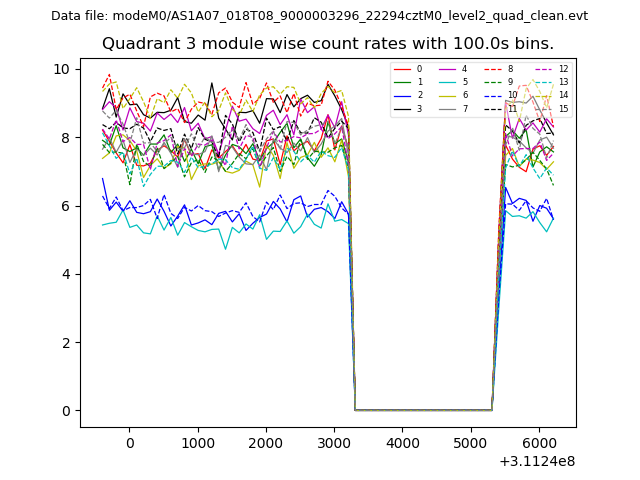
| Module-wise count rates for Quadrant A Data is divided into 100 sec bins |
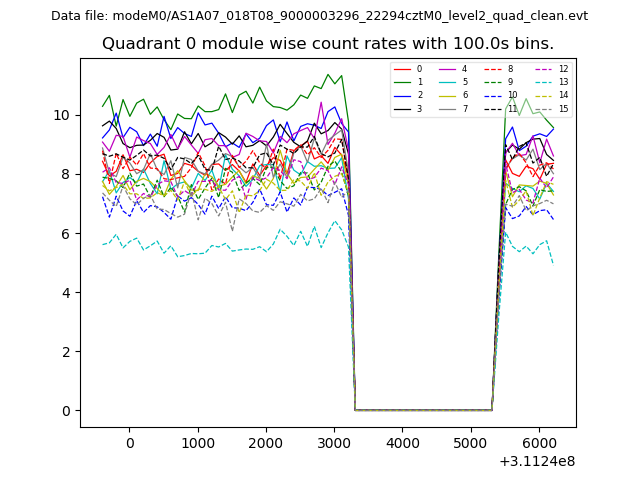 |
 |
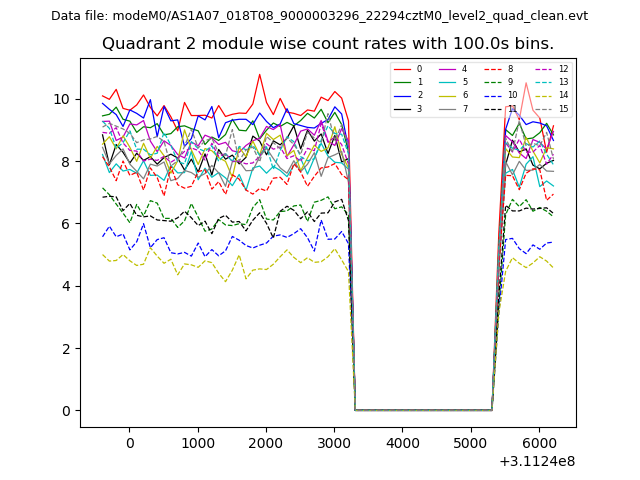
| Module-wise count rates for Quadrant B Data is divided into 100 sec bins |
 |
 |
| Module-wise count rates for Quadrant C Data is divided into 100 sec bins |
 |
 |
| Module-wise count rates for Quadrant D Data is divided into 100 sec bins |
 |
 |
| Parameter | Plot |
|---|---|
| CZT HV Monitor | 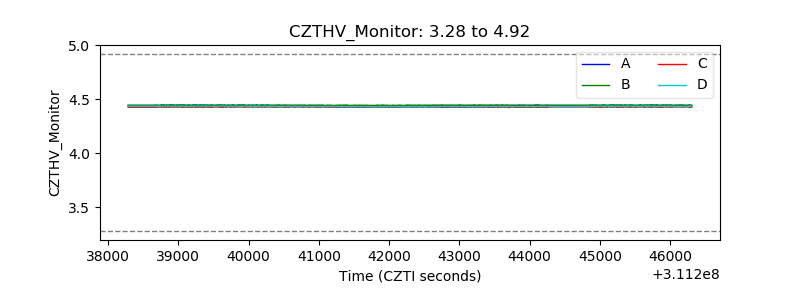 |
| D_VDD | 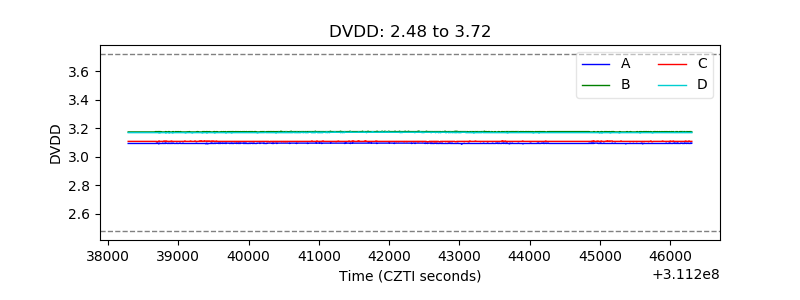 |
| Temperature 1 | 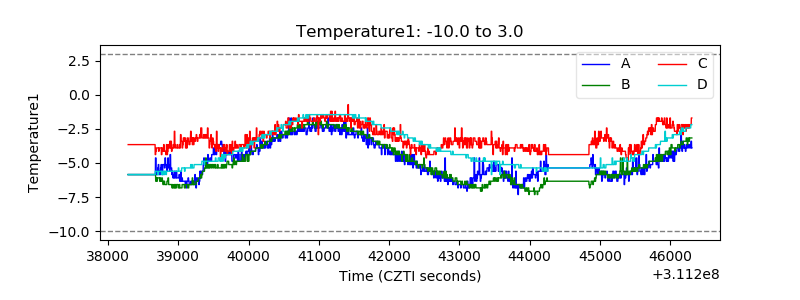 |
| Veto HV Monitor | 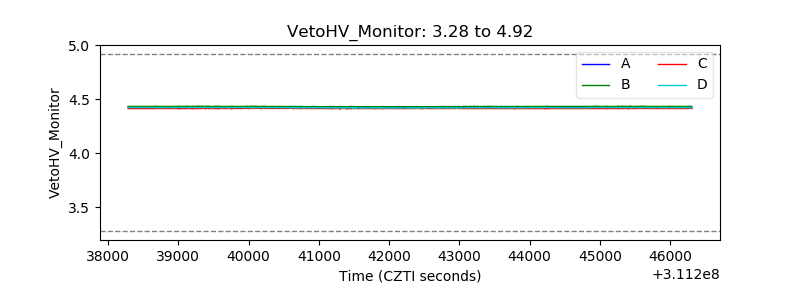 |
| Veto LLD | 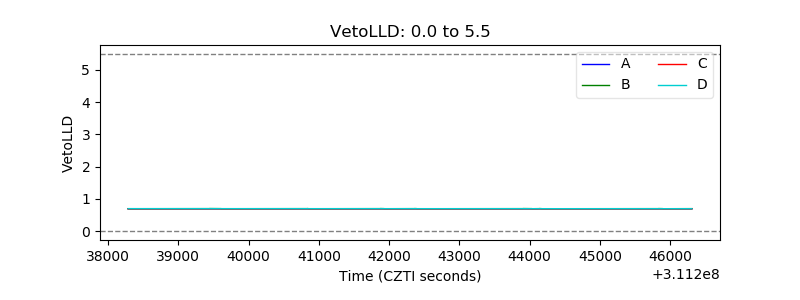 |
| Alpha Counter | 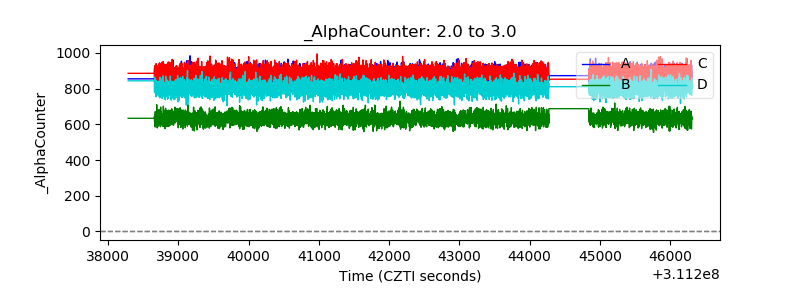 |
| _CPM_Rate | 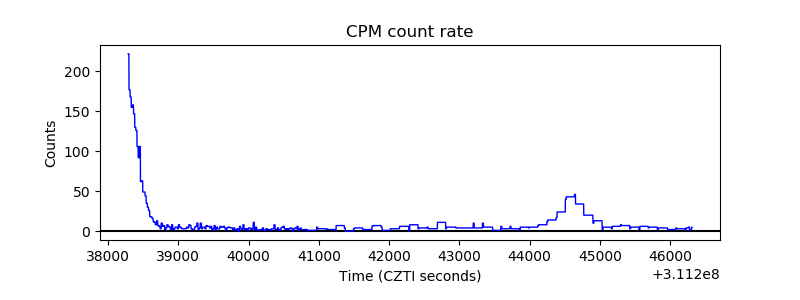 |
| CZT Counter | 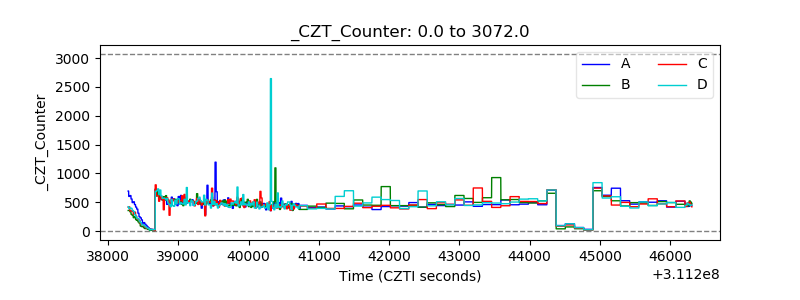 |
| +2.5 Volts monitor |  |
| +5 Volts monitor |  |
| _ROLL_ROT | 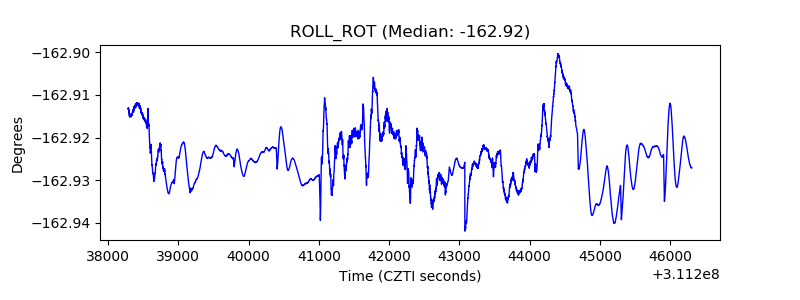 |
| _Roll_DEC | 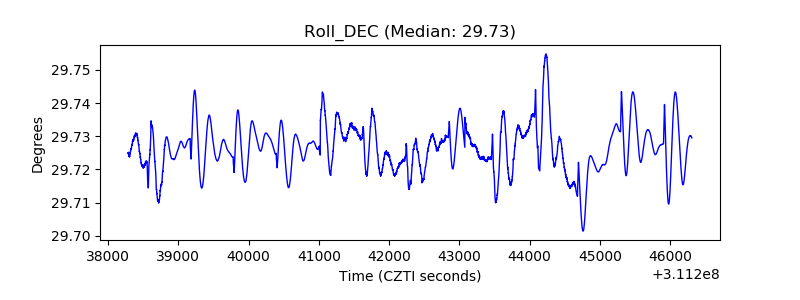 |
| _Roll_RA | 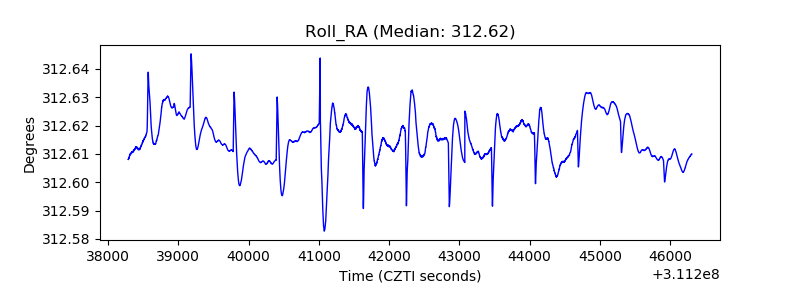 |
| Veto Counter | 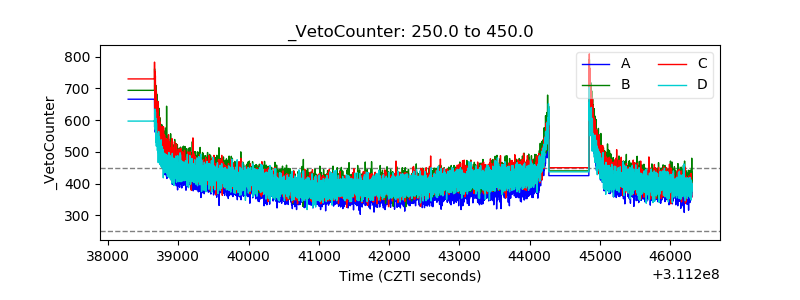 |