| Param | Original file | Final file |
|---|---|---|
| Filename | modeM0/AS1A07_018T08_9000003296_22296cztM0_level2.evt | modeM0/AS1A07_018T08_9000003296_22296cztM0_level2_quad_clean.evt |
| Size (bytes) | 183,329,280 | 52,704,000 |
| Size | 174.8 MB | 50.3 MB |
| Events in quadrant A | 1,280,472 | 354,461 |
| Events in quadrant B | 1,306,986 | 361,007 |
| Events in quadrant C | 1,274,896 | 341,202 |
| Events in quadrant D | 1,493,227 | 335,128 |
| Mode M0 | |||
|---|---|---|---|
| Quadrant | BADHDUFLAG | Total packets | Discarded packets |
| A | 0 | 5732 | 0 |
| B | 0 | 5778 | 0 |
| C | 0 | 5739 | 0 |
| D | 0 | 6308 | 0 |
| Mode SS | |||
|---|---|---|---|
| Quadrant | BADHDUFLAG | Total packets | Discarded packets |
| A | 0 | 56 | 0 |
| B | 0 | 56 | 0 |
| C | 0 | 56 | 0 |
| D | 0 | 56 | 0 |
| Quadrant | Total seconds | Saturated seconds | Saturation percentage |
|---|---|---|---|
| A | 2860 | 3 | 0.104895% |
| B | 2861 | 4 | 0.139811% |
| C | 2861 | 5 | 0.174764% |
| D | 2861 | 14 | 0.489339% |
Noise dominated data is calculated using 1-second bins in cleaned event files. If a bin has >2000 counts, and if more than 50% of those come from <1% of pixels, then it is considered to be noise-dominated and hence unusable.
| Quadrant | # 1 sec bins | Bins with >0 counts | Bins with >2000 counts | High rate bins dominated by noise | Noise dominated (total time) | Noise dominated (detector-on time) | Marked lightcurve |
|---|---|---|---|---|---|---|---|
| A | 2860 | 2860 | 0 | 0 | 0.00% | 0.00% |  |
| B | 2861 | 2861 | 0 | 0 | 0.00% | 0.00% |  |
| C | 2861 | 2861 | 0 | 0 | 0.00% | 0.00% |  |
| D | 2861 | 2861 | 10 | 10 | 0.35% | 0.35% |  |
Top three noisy pixels from each quadrant. If the there are fewer than three noisy pixels in the level2.evt file, extra rows are filled as -1
| Pixel properties | Quadrant properties | ||||||
|---|---|---|---|---|---|---|---|
| Quadrant | DetID | PixID | Counts | Sigma | Mean | Median | Sigma |
| A | 13 | 254 | 3417 | 45.11 | 332 | 325 | 68.5 |
| A | 0 | 226 | 2927 | 37.96 | 332 | 325 | 68.5 |
| A | 3 | 137 | 2736 | 35.18 | 332 | 325 | 68.5 |
| B | 0 | 190 | 19748 | 306.58 | 327 | 319 | 63.4 |
| B | 12 | 111 | 7605 | 114.97 | 327 | 319 | 63.4 |
| B | 11 | 111 | 6983 | 105.16 | 327 | 319 | 63.4 |
| C | 14 | 238 | 50267 | 675.78 | 311 | 312 | 73.9 |
| C | 8 | 128 | 6584 | 84.85 | 311 | 312 | 73.9 |
| C | 8 | 112 | 3079 | 37.43 | 311 | 312 | 73.9 |
| D | 12 | 235 | 117368 | 1474.75 | 319 | 309 | 79.4 |
| D | 1 | 52 | 93114 | 1169.19 | 319 | 309 | 79.4 |
| D | 13 | 172 | 48531 | 607.52 | 319 | 309 | 79.4 |
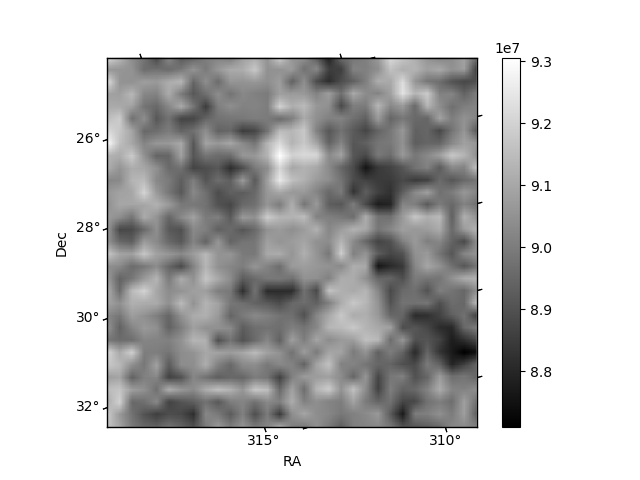
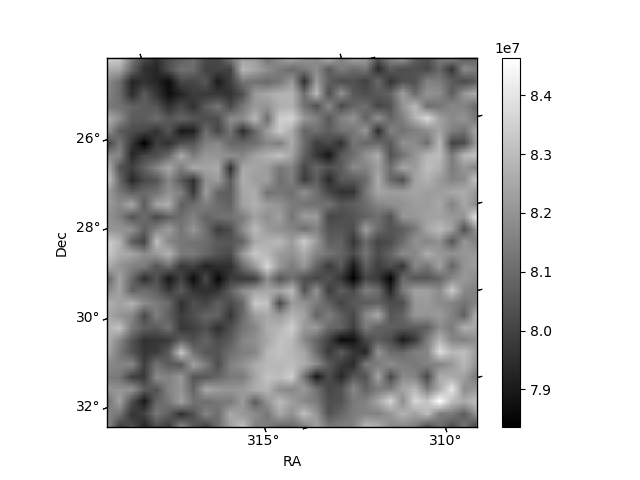
Histogram calculated using DETX and DETY for each event in the final _common_clean file
| Quadrant A | 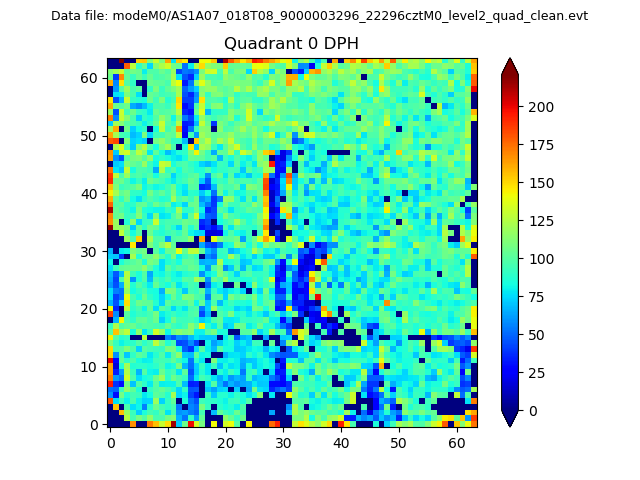 |
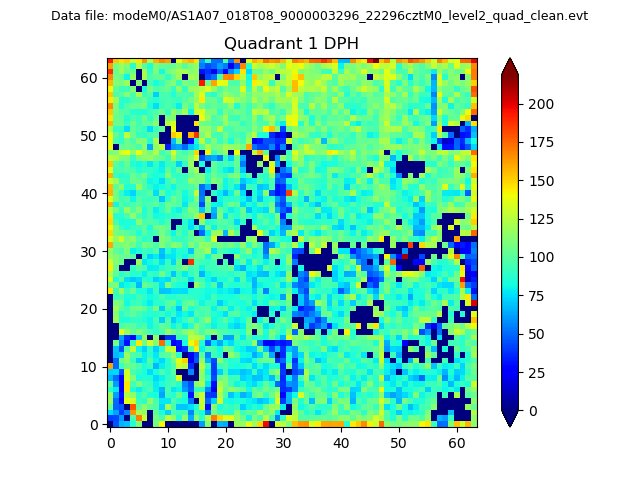 |
Quadrant B |
|---|---|---|---|
| Quadrant D | 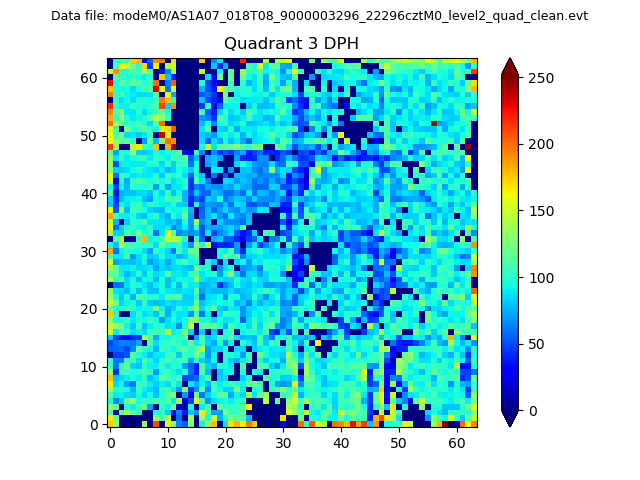 |
 |
Quadrant C |
| Plot type | Count rate plots | Images |
|---|---|---|
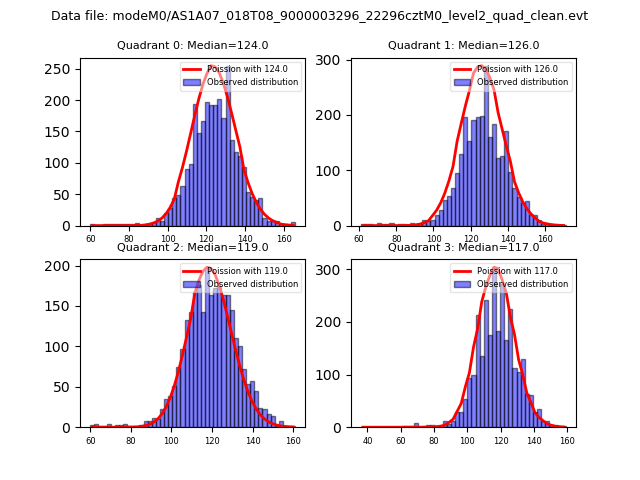
| Comparison with Poisson distribution Blue bars denote a histogram of data divided into 1 sec bins. Red curve is a Poisson curve with rate = median count rate of data. |
 |
 |
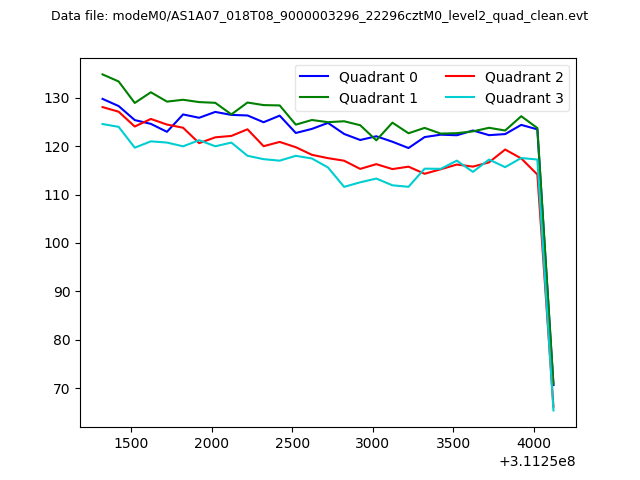
| Quadrant-wise count rates Data is divided into 100 sec bins |
 |
|
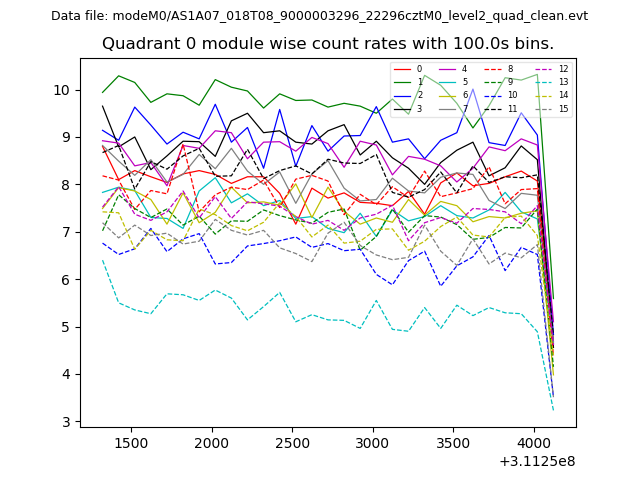
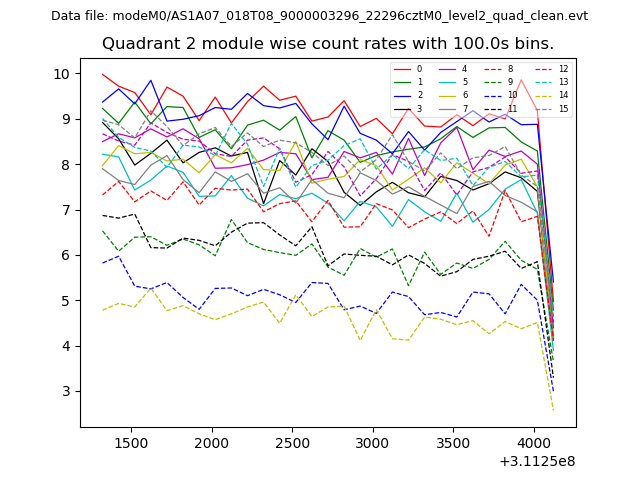
| Module-wise count rates for Quadrant A Data is divided into 100 sec bins |
 |
 |
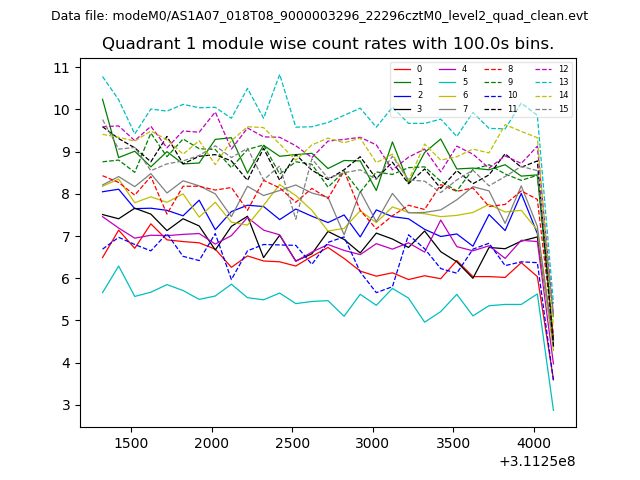
| Module-wise count rates for Quadrant B Data is divided into 100 sec bins |
 |
 |
| Module-wise count rates for Quadrant C Data is divided into 100 sec bins |
 |
 |
| Module-wise count rates for Quadrant D Data is divided into 100 sec bins |
 |
 |
| Parameter | Plot |
|---|---|
| CZT HV Monitor | 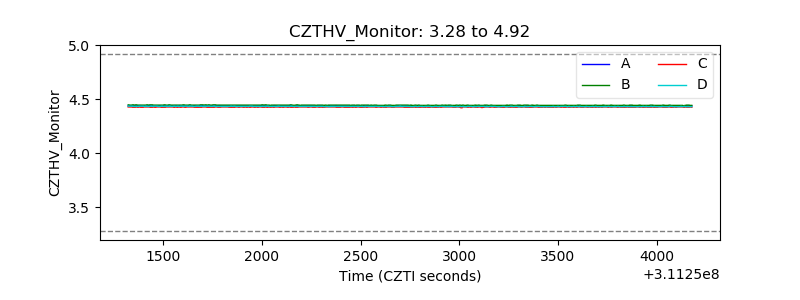 |
| D_VDD |  |
| Temperature 1 | 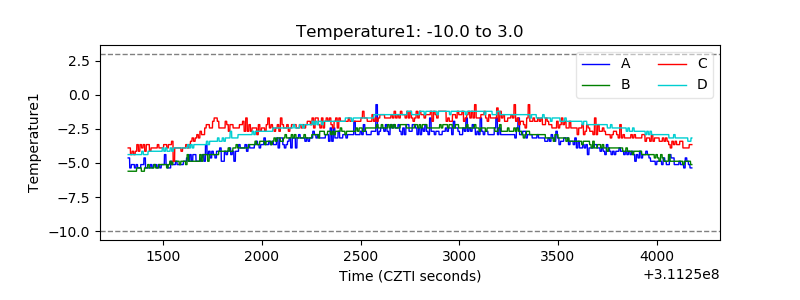 |
| Veto HV Monitor | 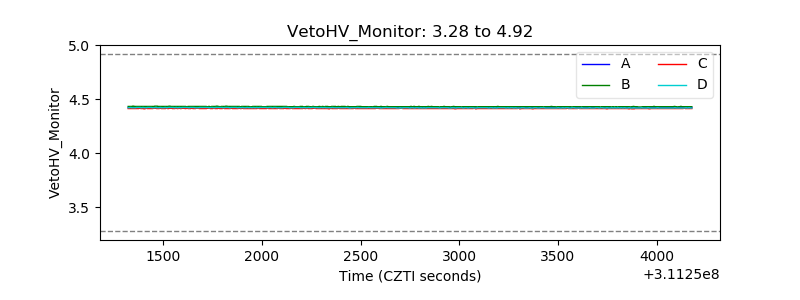 |
| Veto LLD | 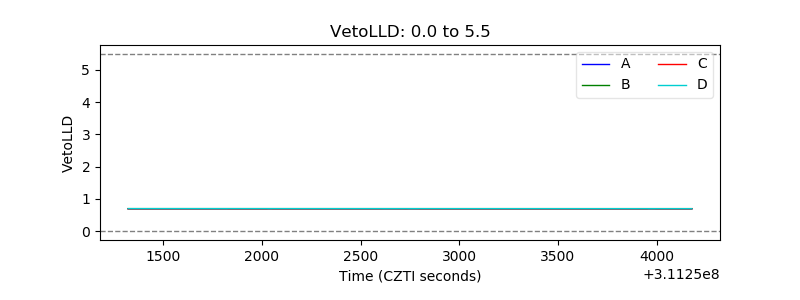 |
| Alpha Counter | 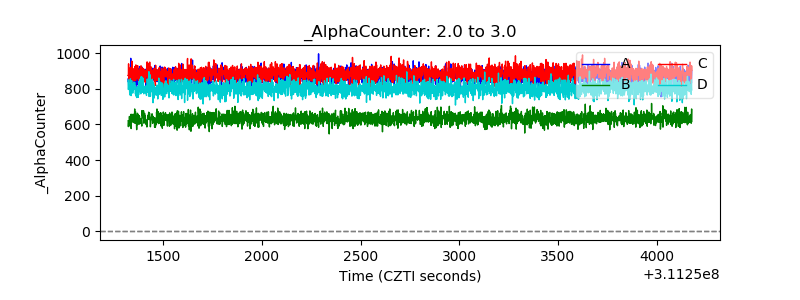 |
| _CPM_Rate | 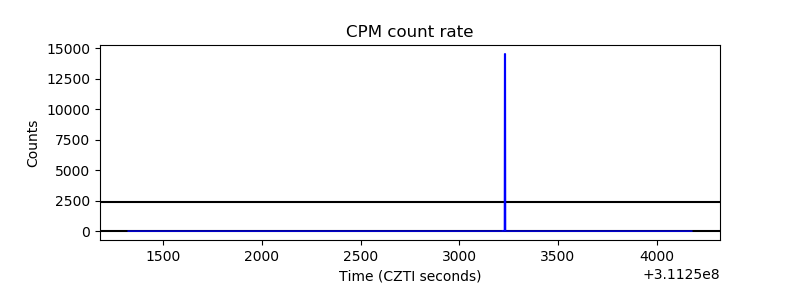 |
| CZT Counter |  |
| +2.5 Volts monitor |  |
| +5 Volts monitor | 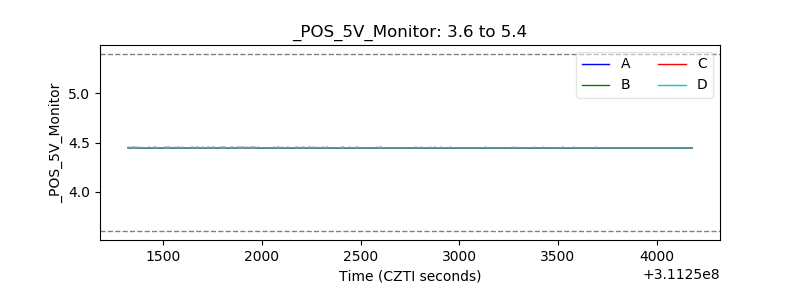 |
| _ROLL_ROT | 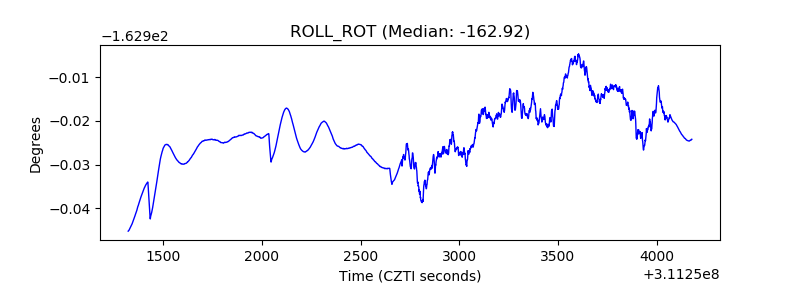 |
| _Roll_DEC | 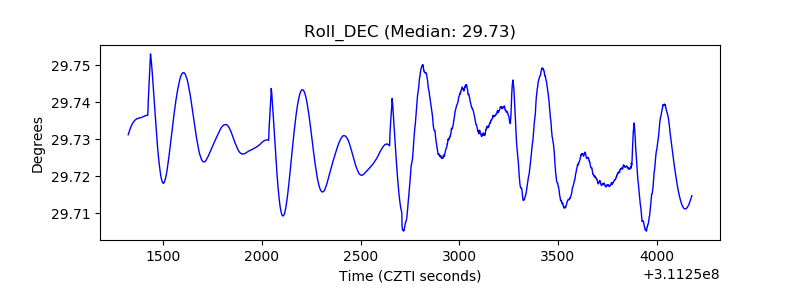 |
| _Roll_RA | 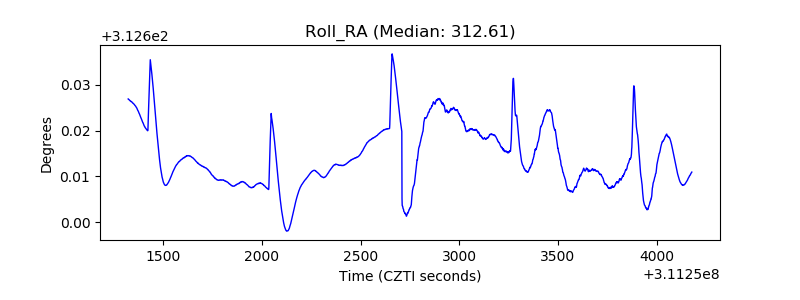 |
| Veto Counter | 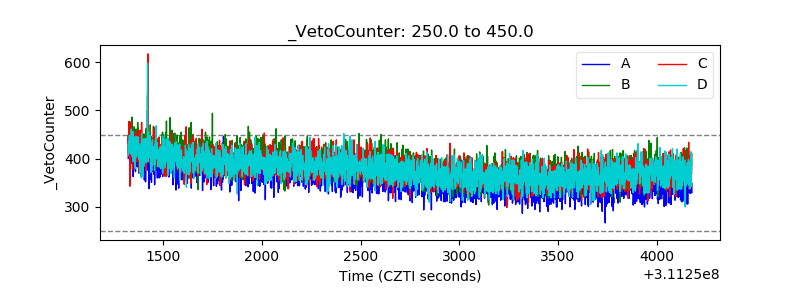 |