| Param | Original file | Final file |
|---|---|---|
| Filename | modeM0/AS1A07_049T01_9000003298_22300cztM0_level2.evt | modeM0/AS1A07_049T01_9000003298_22300cztM0_level2_quad_clean.evt |
| Size (bytes) | 451,045,440 | 95,307,840 |
| Size | 430.2 MB | 90.9 MB |
| Events in quadrant A | 3,152,302 | 614,268 |
| Events in quadrant B | 3,296,202 | 629,737 |
| Events in quadrant C | 3,200,997 | 594,212 |
| Events in quadrant D | 3,549,210 | 575,473 |
| Mode SS | |||
|---|---|---|---|
| Quadrant | BADHDUFLAG | Total packets | Discarded packets |
| A | 0 | 138 | 0 |
| B | 0 | 138 | 0 |
| C | 0 | 138 | 0 |
| D | 0 | 138 | 0 |
| Mode M9 | |||
|---|---|---|---|
| Quadrant | BADHDUFLAG | Total packets | Discarded packets |
| A | 0 | 9 | 0 |
| B | 0 | 10 | 0 |
| C | 0 | 10 | 0 |
| D | 0 | 10 | 0 |
| Mode M0 | |||
|---|---|---|---|
| Quadrant | BADHDUFLAG | Total packets | Discarded packets |
| A | 0 | 13888 | 2 |
| B | 0 | 14223 | 2 |
| C | 0 | 13920 | 2 |
| D | 0 | 15216 | 2 |
| Quadrant | Total seconds | Saturated seconds | Saturation percentage |
|---|---|---|---|
| A | 6782 | 42 | 0.619286% |
| B | 6782 | 58 | 0.855205% |
| C | 6782 | 79 | 1.164848% |
| D | 6782 | 126 | 1.857859% |
Noise dominated data is calculated using 1-second bins in cleaned event files. If a bin has >2000 counts, and if more than 50% of those come from <1% of pixels, then it is considered to be noise-dominated and hence unusable.
| Quadrant | # 1 sec bins | Bins with >0 counts | Bins with >2000 counts | High rate bins dominated by noise | Noise dominated (total time) | Noise dominated (detector-on time) | Marked lightcurve |
|---|---|---|---|---|---|---|---|
| A | 7717 | 6783 | 0 | 0 | 0.00% | 0.00% | 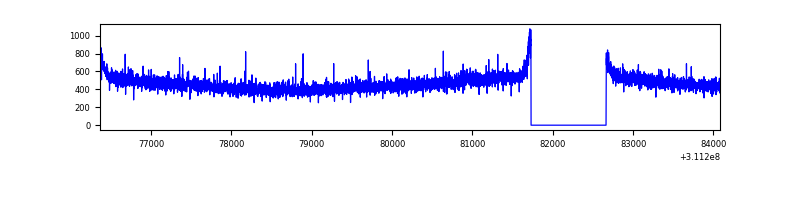 |
| B | 7717 | 6783 | 1 | 1 | 0.01% | 0.01% | 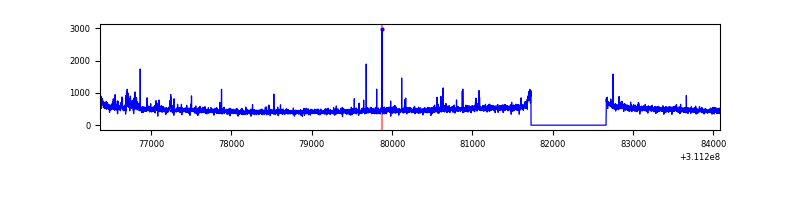 |
| C | 7717 | 6783 | 0 | 0 | 0.00% | 0.00% |  |
| D | 7717 | 6783 | 66 | 66 | 0.86% | 0.97% | 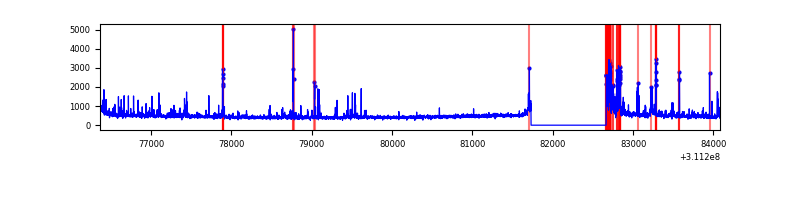 |
Top three noisy pixels from each quadrant. If the there are fewer than three noisy pixels in the level2.evt file, extra rows are filled as -1
| Pixel properties | Quadrant properties | ||||||
|---|---|---|---|---|---|---|---|
| Quadrant | DetID | PixID | Counts | Sigma | Mean | Median | Sigma |
| A | 13 | 254 | 8307 | 45.49 | 817 | 800 | 165.0 |
| A | 3 | 137 | 7199 | 38.77 | 817 | 800 | 165.0 |
| A | 0 | 226 | 7072 | 38.0 | 817 | 800 | 165.0 |
| B | 0 | 190 | 42956 | 272.08 | 818 | 797 | 155.0 |
| B | 3 | 64 | 28876 | 181.21 | 818 | 797 | 155.0 |
| B | 12 | 111 | 18870 | 116.64 | 818 | 797 | 155.0 |
| C | 14 | 238 | 122823 | 657.91 | 788 | 793 | 185.5 |
| C | 13 | 61 | 5443 | 25.07 | 788 | 793 | 185.5 |
| C | 0 | 10 | 4393 | 19.41 | 788 | 793 | 185.5 |
| D | 1 | 52 | 416237 | 2152.2 | 793 | 770 | 193.0 |
| D | 2 | 136 | 49570 | 252.79 | 793 | 770 | 193.0 |
| D | 13 | 249 | 44250 | 225.23 | 793 | 770 | 193.0 |
Histogram calculated using DETX and DETY for each event in the final _common_clean file
| Quadrant A |  |
 |
Quadrant B |
|---|---|---|---|
| Quadrant D |  |
 |
Quadrant C |
| Plot type | Count rate plots | Images |
|---|---|---|
| Comparison with Poisson distribution Blue bars denote a histogram of data divided into 1 sec bins. Red curve is a Poisson curve with rate = median count rate of data. |
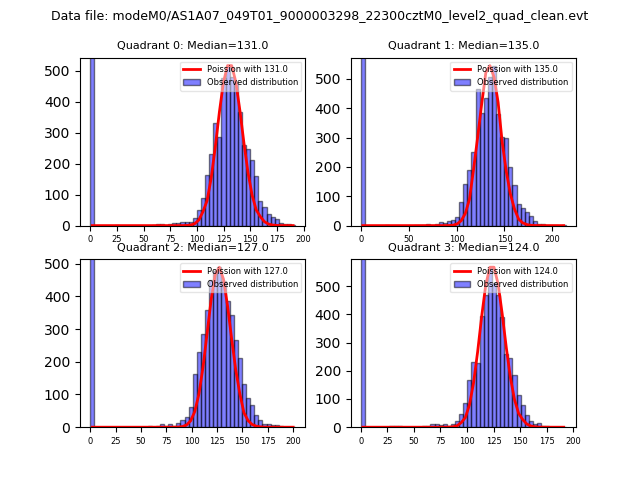 |
 |
| Quadrant-wise count rates Data is divided into 100 sec bins |
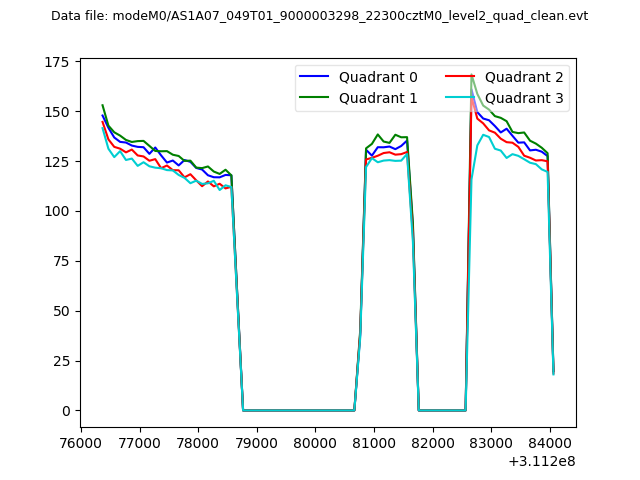 |
|
| Module-wise count rates for Quadrant A Data is divided into 100 sec bins |
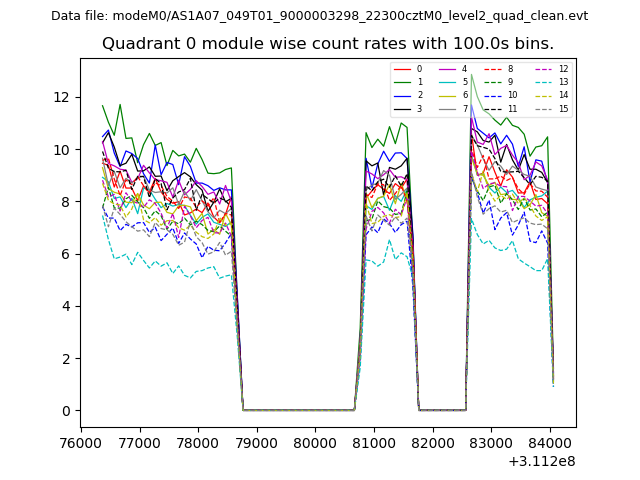 |
 |
| Module-wise count rates for Quadrant B Data is divided into 100 sec bins |
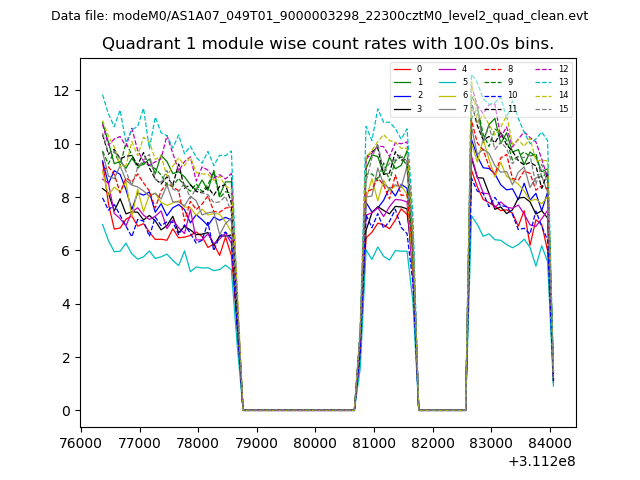 |
 |
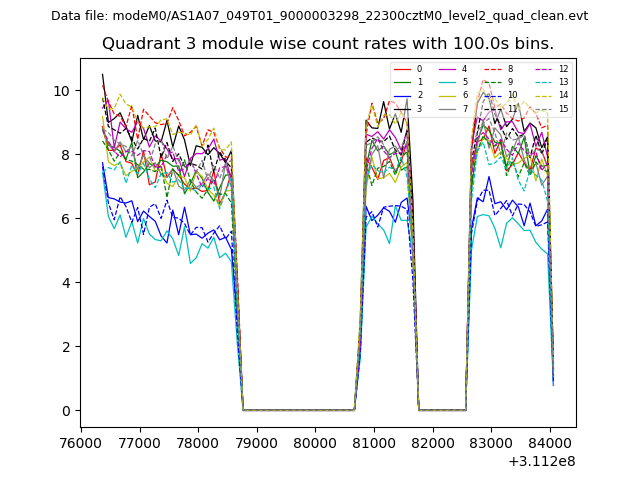
| Module-wise count rates for Quadrant C Data is divided into 100 sec bins |
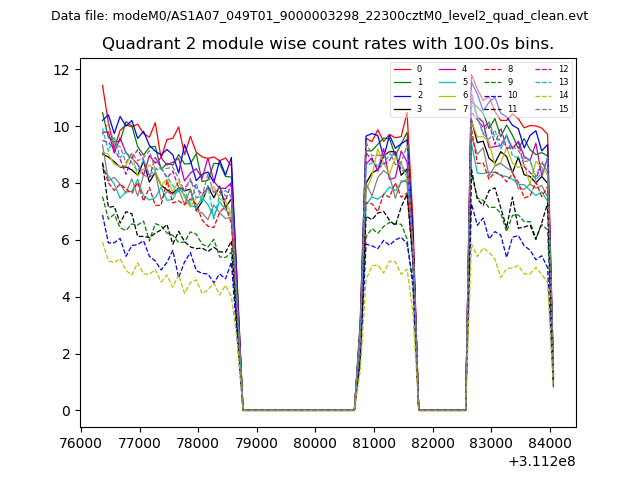 |
 |
| Module-wise count rates for Quadrant D Data is divided into 100 sec bins |
 |
 |
| Parameter | Plot |
|---|---|
| CZT HV Monitor | 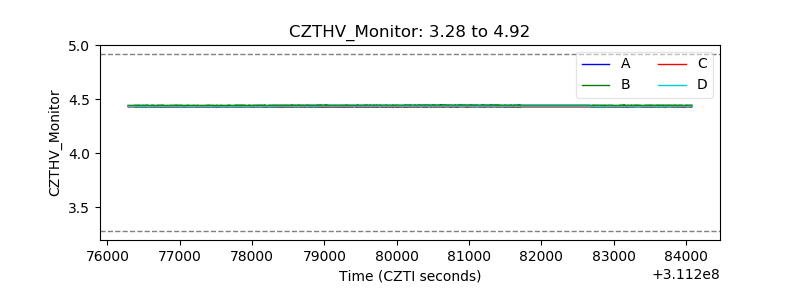 |
| D_VDD |  |
| Temperature 1 |  |
| Veto HV Monitor |  |
| Veto LLD |  |
| Alpha Counter | 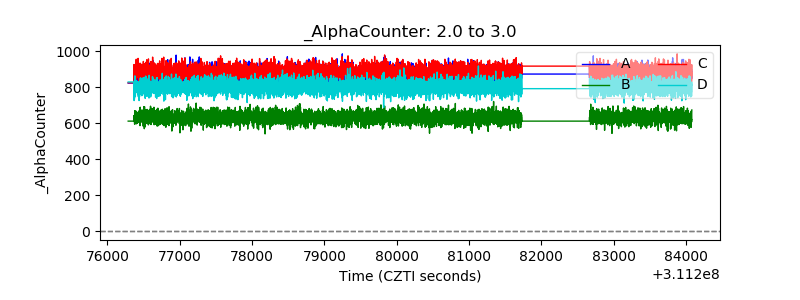 |
| _CPM_Rate | 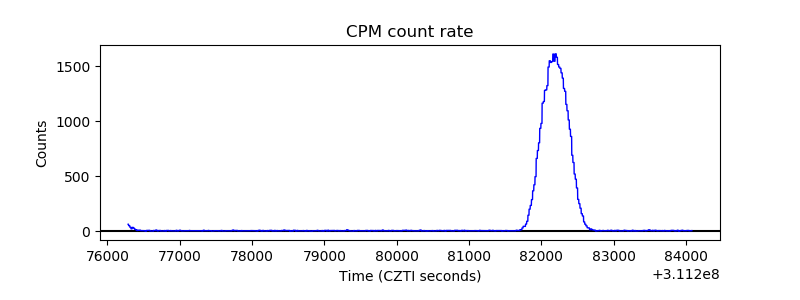 |
| CZT Counter |  |
| +2.5 Volts monitor |  |
| +5 Volts monitor |  |
| _ROLL_ROT | 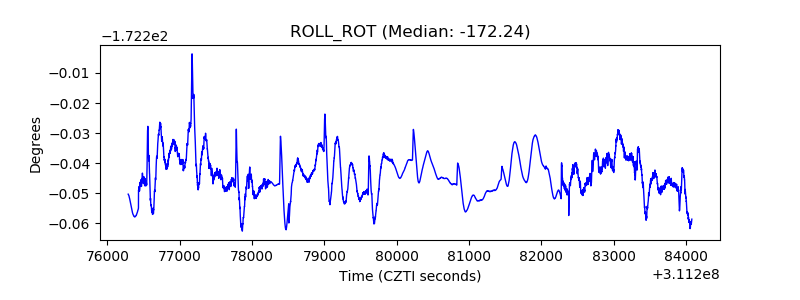 |
| _Roll_DEC |  |
| _Roll_RA |  |
| Veto Counter | 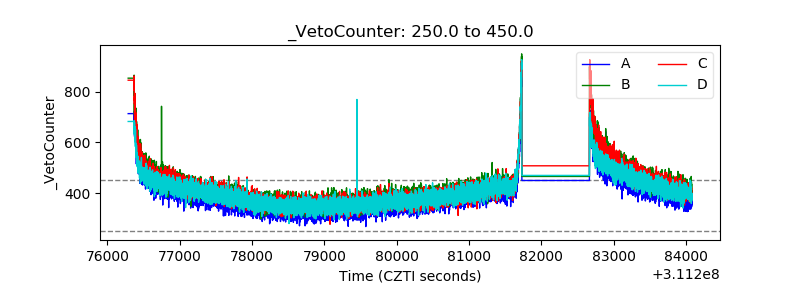 |